
Transitional Area of Ce4+ to Ce3+ in SmxCayCe1-x-yO2-δ with Various Doping and Oxygen Vacancy Concentrations: A GGA + U Study①
2018-03-12 08:40:50WUTongWeiJIAGuiXioWANGXioXiLILeiANShengLi
結(jié)構(gòu)化學 2018年2期
WU Tong-Wei JIA Gui-Xio, b WANG Xio-Xi LI Lei AN Sheng-Li, b
?
Transitional Area of Ce4+to Ce3+in SmCaCe1-x-yO2-δwith Various Doping and Oxygen Vacancy Concentrations: A GGA +Study①
WU Tong-WeiaJIA Gui-Xiaoa, b②WANG Xiao-XiaaLI LeiaAN Sheng-Lia, b
a(,014010)b(014010)
In this work, we perform DFT + U periodic calculations to study geometrical and electronic structures and oxygen vacancy formation energies of SmCaCe1-x-yO2-δsystems (= 0.0312, 0.0625, 0.125 and 0.250;= 0.0312, 0.0625, 0.125 and 0.250;= 0.0312, 0.0625, 0.125, 0.250 and 0.50) with different oxygen vacancy and doping concentrations. The calculated results show that the V1-Sm3+-V2structures where there is a position relationship of the face diagonal between V1and V2both nearest to Sm3+have the lowest energy configurations. The study on electronic structures of the SmCaCe1-x-yO2-δsystems finds that excess electrons arise from oxygen vacancies and are localized on-level traps of their neighbor Ce, and Ca2+and Sm3+co-doping effectively restrains the reduction of Ce4+. In order to avoid the existence of Ce3+,andmust be both larger than 0.0625 as= 0.125 ormust be smaller than 0.125 as== 0.0625.The Ce3+/Ce4+change ratiohas an obvious monotonous increase with increasing the vacancy oxygen concentration. The introduction of Sm3+decreases.In addition, the doped Sm3+can restrain the reduction of Ce4+when the V1-Sm3+-V2structure with a face diagonal position relationship in lower reduced atmosphere exists. It need be pointed out that the Sm0.25Ce0.75O1.5system should be thought of as a Sm-doped Ce2O3one.
cerium oxide, oxygen vacancies, doping, electronic structures, GGA+;
1 INTRODUCTION


Theoretically, the distributions of oxygen vacan- cies and dopants[23], their formation energies[24], geometric and electronic structures[25]and oxygen ionic migration energies of CeO2systems[15, 25, 26]have been investigated at the atomic level. CeO2systems with Sm3+among rare earth metals and Ca2+among alkaline earth metals have the smallest oxygen ionic migration energies[25, 27]and their doping can effectively restrain the electronic con- ductivity. Theoretical[9]and experimental[28, 29]studies showed that Ca2+and Sm3+co-doping could better improve the ionic conductivity. Effects of different oxygen vacancy and doping concentrations on the distributions of oxygen vacancies, dopants and Ce3+of the CeO2systems are investigated.Murgida’s study[30]showed that the oxygen vacancy concen- tration affected the distribution of Ce3+and excess electrons preferred to be localized in the cation sites such that the mean Ce3+coordination number was maximized, and two vacancies were inclined to be second-neighboring. For doped CeO2-δ, our and other studies found that dopants preferred to occupy the nearest neighbor (NN) and next-nearest neighbor (NNN) positions relative to the oxygen vacancy[20, 25]. Independent with oxygen vacancy and doping concentrations, Ce3+is distributed around the nearest neighbor oxygen vacancy[30-32].
However, a systematically theoretical study on Ce3+/Ce4+electronic properties of CeO2with dif- ferent oxygen vacancy and doping concentrations is absent. As is well known, Ca and Sm doping can effectively restrain the reduction of Ce4+to Ce3+and the doped CeO2has the largest ionic conductivity. Hence, in order to better understand the effects of different oxygen vacancy and Ca-, Sm-doping concentrations on the electronic structures (Ce3+/Ce4+) of CeO2systems, in the work, we select various numbers of oxygen vacancies or Ca and Sm dopants in the same supercell to obtain a series of vacancy and doping concentrations. Ultimately, this work would plot transitional area of Ce4+to Ce3+and the Ce3+/Ce4+change ratiounder different oxygen vacancy and doping concentration conditions.
2 Models and computational details
2. 1 Models
CeO2has a fluorite-type structure (3space group) with one formula unit per primitive unite cell[25]. In this work, we considered a number of oxygen vacancies or dopants of Ca2+and Sm3+to produce various oxygen vacancy and doping con- centrations in a 2×2×2 supercell, namely, SmCaCe1-x-yO2-δsystems with various,and(= 0.0312, 0.0625, 0.125 and 0.250;= 0.0312, 0.0625, 0.125 and 0.250;= 0.0312, 0.0625, 0.125, 0.250 and 0.50) were considered, see Table 1. When the doping concentration is larger than 0.30, SmCaCe1-x-yO2-δsystems were not doping but alloying ones. However, for convenience with description in the work, we would unify them to name as doping ones.
Doped atoms are uniformly distributed in a 2×2×2 supercell to obtain systems with various doping concentrations. Hooper’s study[33]on Sm-doped CeO2systems found that the dopant-vacancy interac- tion was a hybrid NN/NNN mixture distribution as the Sm3+concentrations increased and more NN distributions were the most favored. Our previous studies found that the first oxygen vacancy (V1) was the nearest to the dopant (NN)[20, 25]. Here, the same structure model is used. For the CeO2systems where the number of the oxygen vacancy nearest to one Sm3+is more than one, these vacancies are chosen according to the rule of the NN distribution, namely, the second oxygen vacancy nearest to one Sm3+is introduced and named as V2. Thus, V1and V2would have three distinct position relationships in the cube of eight coordinated O2-for one Sm3+, namely, the side one in Fig. 1a, the face diagonal one in Fig. 1b and the body diagonal one in Fig. 1c. Calculation results show that the structures with the face diagonal relationship between V1and V2are the most stable, consistent with the case of pure CeO2systems with double oxygen vacancies[8]. For Ca-doped CeO2systems, the models where Ca2+has a NN or NNN distribution relationship with one oxygen vacancy are considered.
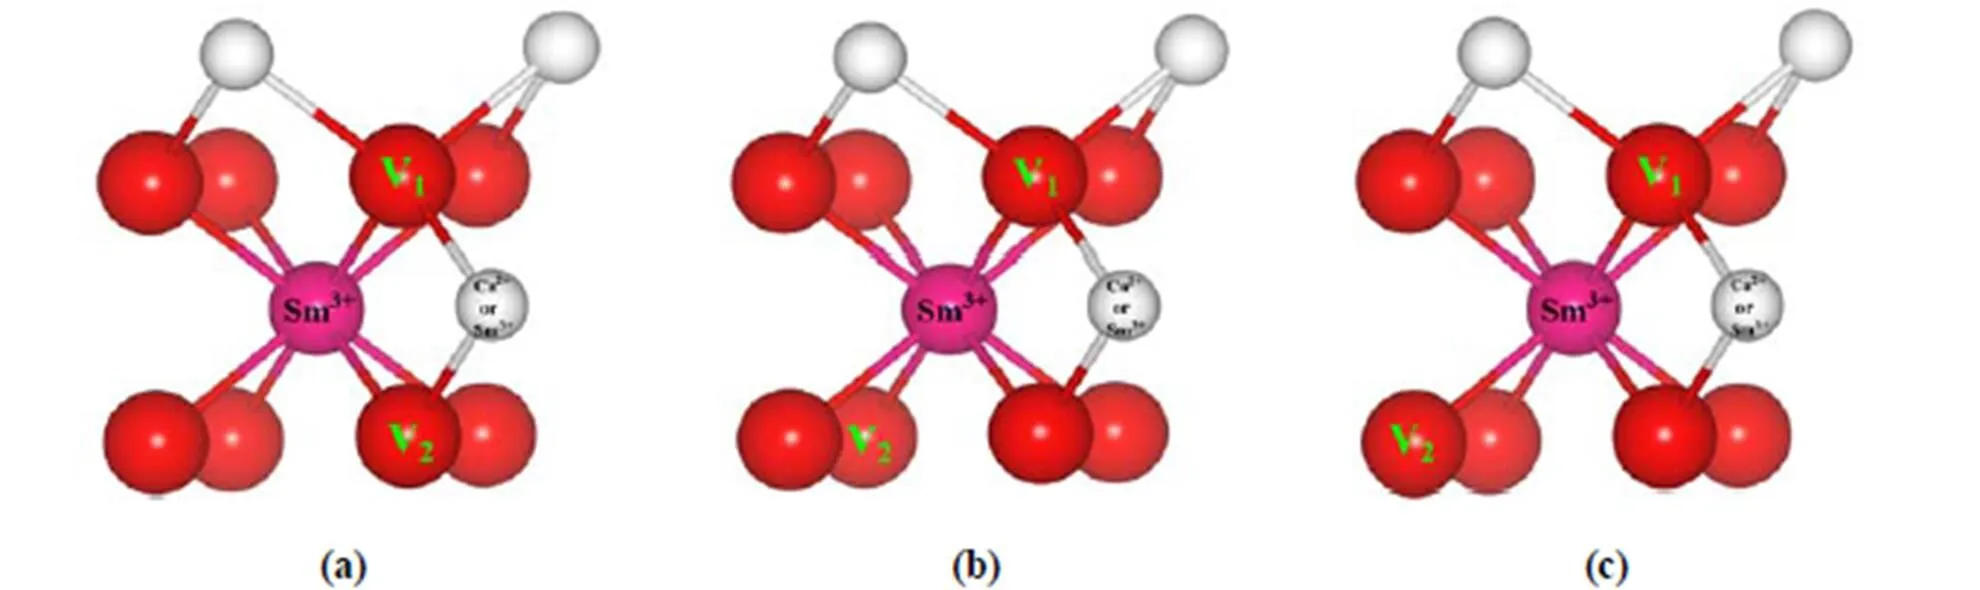
Fig. 1. Geometric structures of Sm0.25Ca0.25Ce0.5O2-δor Sm0.5Ce0.5O2-δsystems with V1and V2. Red spheres note O, white ones note Ce, and the pink ones note one Sm3+. There is a similar notation in the following figures
2. 2 Computational details
All calculations were performed by a Viennasimulation package (VASP)[34]. Ce55645, O22, Ca334and Sm55645were treated as valence electrons. Structures were relaxed until forces on each ion were below 0.02 eV/? and the total energy was converged within 1×10⁻⁴eV. A plane-wave cut off energy of 400 eV, a 3×3×3 Monkhorst-Pack k point mesh and a Gaussian smearing parameter of 0.20 eV were used.
The standard DFT formulation usually fails to describe strongly the correlated electrons due to a deficient treatment of electron correlation. This limitation can be corrected by using a DFT + U method, where the introduction of a Hubbard parametermodifies the self-interaction error and enhances the description of the correlation effects[35]. This methodology has been widely used in reduced CeO2systems[6, 8, 32, 35]. Theoretical work showed that thevalue for Ce should be larger than 5.0 eV[25, 26, 34]. In this work, we used thevalue of 6.0 eV for Ce and-value of 8.0 eV and-value of 0.65 eV for Sm, consistent with the other work[35-47]. The exchange-correlation effects were described with the Perdew Burke Ernzerhof (PBE) functional within the generalized gradient approximation (GGA)[36].The calculated crystal lattice constant from the GGA +method is 5.48 ?, in agreement with the experiment value of 5.41 ?[48].
The formation energies of oxygen vacanciesVofor CeO2-δsystems,Vo-Smfor SmCeO2-δsystems andVo-CaSmfor SmCaCeO2-δsystems can be defined as
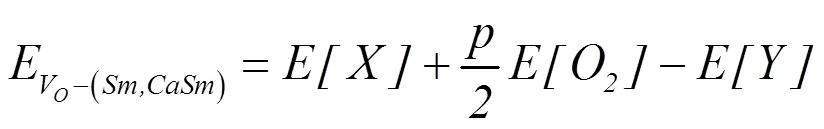
where[] and[] are total energies of pure or doped CeO2systems with and without oxygen vacancies, respectively.[O2] is the energy of one O2molecule set in a 10? × 10? × 10? supercell, andis the number of oxygen vacancies.
3 RESULTS AND DISCUSSION
3. 1 Geometric structures
Model structures with the lowest energies are obtained.The V1-Sm3+-V2structures where there is a diagonal position relationship of the face between V1and V2both nearest to Sm3+have the lowest energy configurations, consistent with the case of pure CeO2systems with double oxygen vacancies[8]. The introduction of Sm3+, Ca2+and oxygen vacancies into CeO2can produce obvious geometric distortions, consistent with the other work[25]. Geometric struc- tures of CeO1.9688, Sm0.0312Ce0.9688O1.9688, Sm0.0312Ce0.9688O1.9375, Sm0.0312Ca0.0312Ce0.9376O1.9688and Sm0.0312Ca0.0312Ce0.9376O1.9375systems as examples are displayed in Fig. 2. Geometric struc- tures of SmCaCe1-x-yO2-δwith other oxygen vacancy and doping concentrations have a similar geometric distortion.
It is well known that the oxygen vacancy is an area of effective positive potential, hence, the neighboring O2-move toward the vacancy, and the neighboring Ce4+move away from the vacancy. From Fig. 2a of the CeO1.9688system, we can see that three of four O2-near the oxygen vacancy move toward it and another O2-moves away from it. From the following electronic structures (see detail discussion on electronic structures), it is known that this O2-is bridged by two Ce3+which have larger negative potential than that of Ce4+. From Fig. 2b of the Sm0.0312Ce0.9688O1.9688system, it is similar to the CeO1.9688system in Fig. 2a and the difference is that one of two Ce3+is Sm3+, namely, the neighboring O2-move toward the vacancy, and the neighboring Ce4+and Sm3+move away from the vacancy. From Fig. 2c of the Sm0.0312Ce0.9688O1.9375system, we can see that the movements of four O2-toward two vacancies and two O2-toward Sm3+resulted from the common attraction of V1and V2to O2-, namely, an O2-bridged by Sm3+and Ce3+is not repelled, different from the systems with one oxygen vacancy. From Fig. 2d of the Sm0.0312Ca0.0312Ce0.9376O1.9688system, four O2-near the oxygen vacancies can be driven toward the vacancy and the neighboring Ce4+move away from the vacancy. The Sm0.0312Ca0.0312Ce0.9376O1.9375system in Fig. 2e is similar to the Sm0.0312Ce0.9688O1.9375system in Fig. 2c.
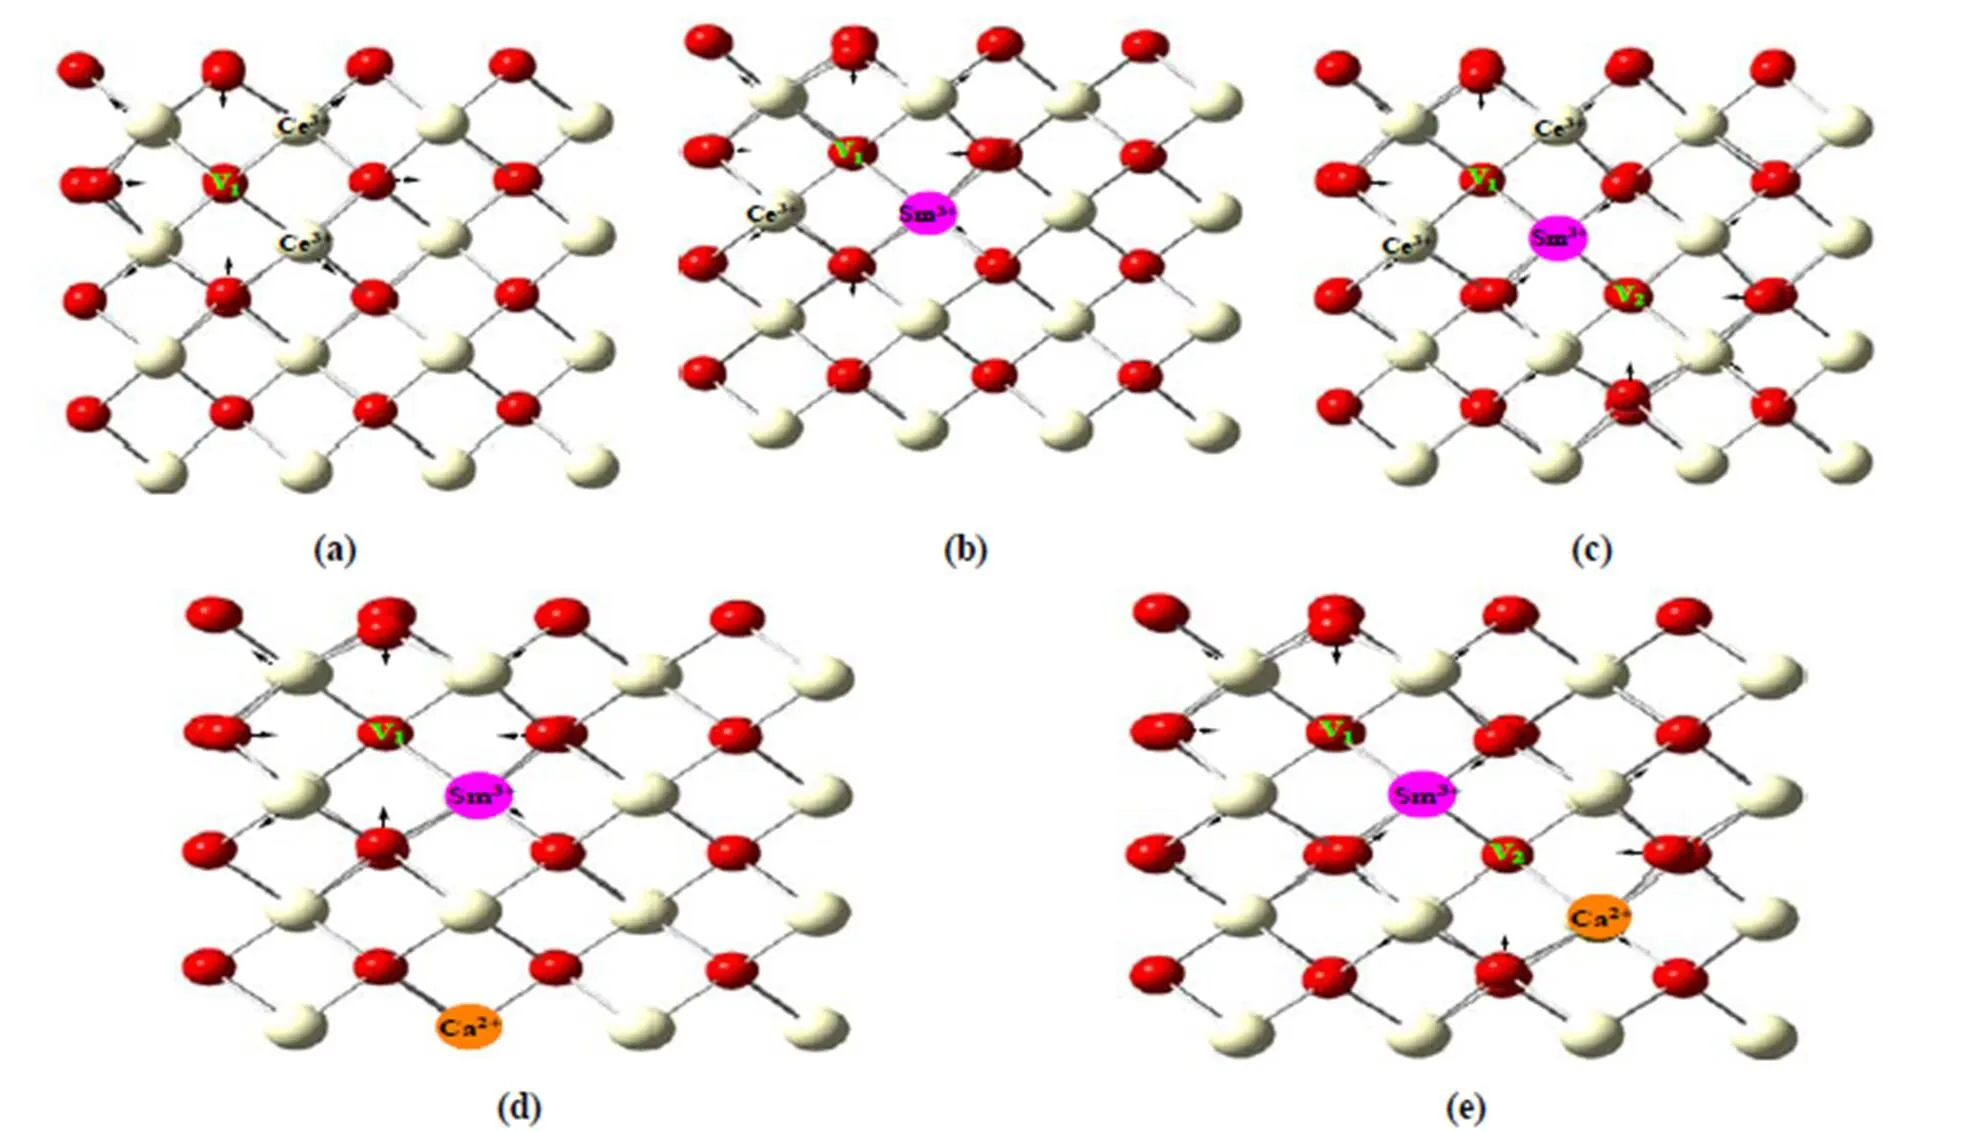
Fig. 2. Optimized geometric structures of the CeO1.9688(a), Sm0.0312Ce0.9688O1.9688(b), Sm0.0312Ce0.9688O1.9375(c), Sm0.0312Ca0.0312Ce0.9376O1.9688(d) and Sm0.0312Ca0.0312Ce0.9376O1.9375(e) systems. Arrow directions indicate moving ones of ions
3. 2 Oxygen vacancy formation energies
Oxygen vacancy formation energies ofVofor CeO2-δsystems,Vo-Smfor SmCe1-xO2-δsystems andVo-CaSmfor SmCaCe1-x-yO2-δsystems are listed in Table 1.Vomonotonously increases with increasing, see Table 1 and Fig. 3. For SmCe1-xO2-δand SmCaCe1-x-yO2-δsystems, we can find thatVo-Smwith a certainandVo-CaSmwith certainandare large asislarge, and bothwith a certainare small asorand y are large, see Table 1 and Fig. 3. It need point out that the introduction of Ca and Sm makes the oxygen vacancy spontaneously form, similar to Fergus’s study on the Sm-doped CeO2systems[49].
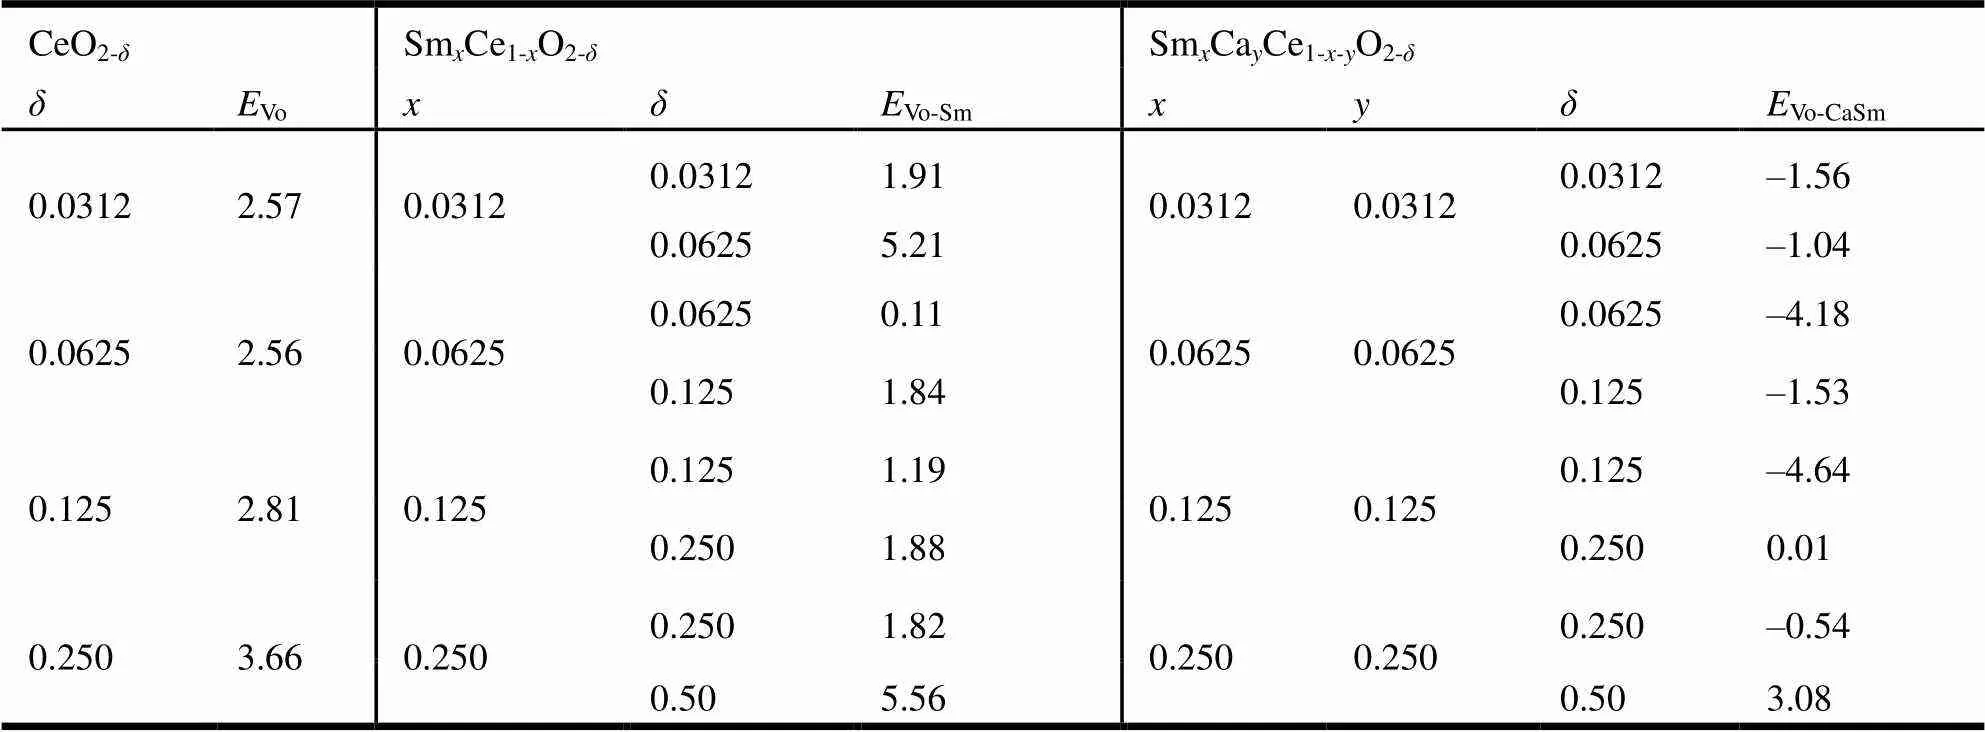
Table 1. Oxygen Vacancy Formation Energies (Unit: eV) of EVo for CeO2-δ, EVo-Sm for SmxCe1-xO2-δ andEVo-CaSm for SmxCayCe1-x-yO2-δ
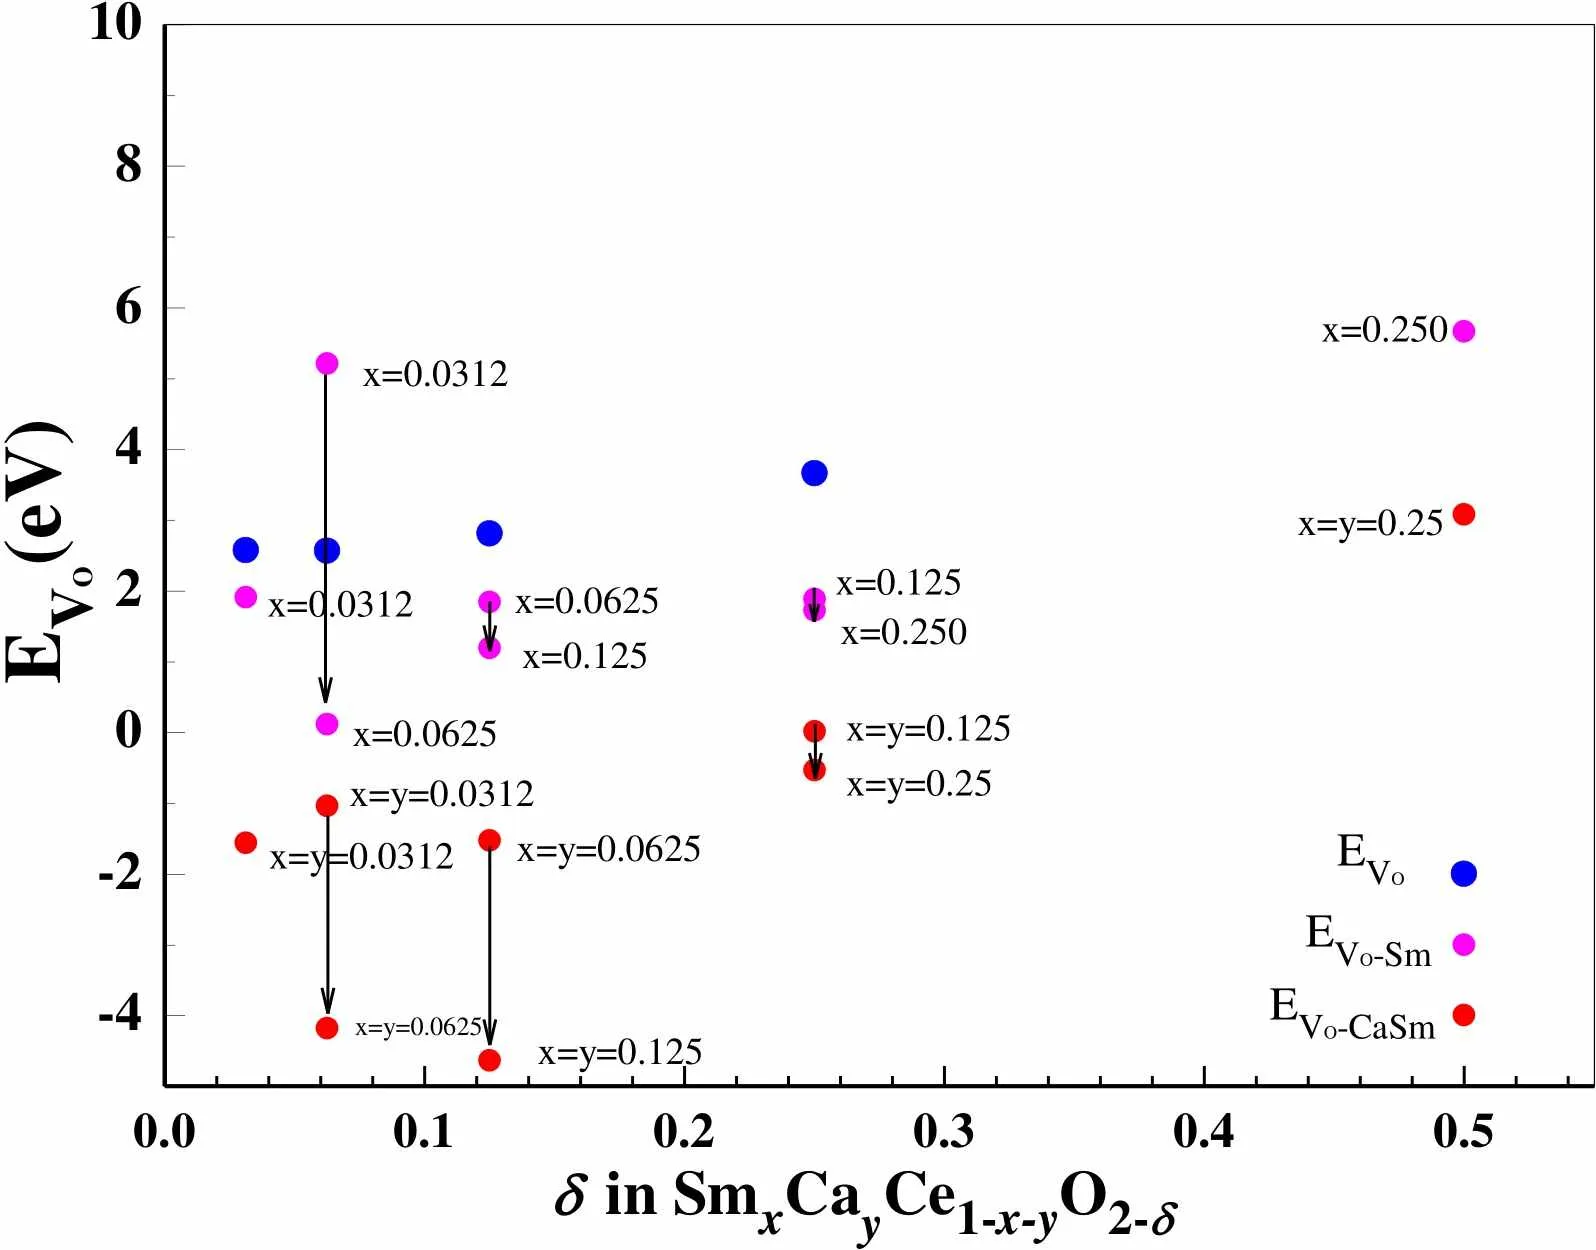
Fig. 3. Variation ofVo,Vo-Sm, andVo-CaSmasof corresponding CeO2-δSmCe1-xO2-δandSmCaCe1-x-yO2-δsystems
3. 3 Electronic structures
When oxygen vacancies in CeO2are formed, the Ce4state is split into two states: an empty Ce4emptystate and an occupied defect Ce3+4fullstate at the range of O2and Ce4empty, consistent with our previous[25]and the other work[32], see Fig. 4. Total electronic densities of states (DOS), partial electronic densities of states (PDOS) and localization electronic densities of states (LDOS) from the defect state of Ce3+for various SmCaCe1-x-yO2-δsystems with different,andare calculated, as shown in Figs. 4 and 5.
3. 3. 1 Excess electron distribution
From the PDOS of Ce4state for CeO1.9688, CeO1.9375, CeO1.875and CeO1.75systems in Fig. 4a, we can see that a new peak appears at the range of –1.2~0 eV for CeO1.9688, CeO1.9375, CeO1.875systems and –0.80~0.60 eV for the CeO1.75system, respectively, which are fully occupied by Ce3+electrons. Compared to the PDOS of Ce4state for the CeO1.75system, the Fermi level of the other systems approximately shift up by 0.50 eV, due to the decrease of oxygen vacancy concentration. Excess electrons arise from the oxygen vacancy and are localized on the-level traps of its neighbor Ce, which can be visually recognized from the corresponding LDOS of the defect Ce3+state in Fig. 4b-e. These are consistent with theoretical studies for CeO1.9843, CeO1.9687, CeO1.9375and CeO1.875[43]and CeO2(111), (110) and (100) surfaces[50].
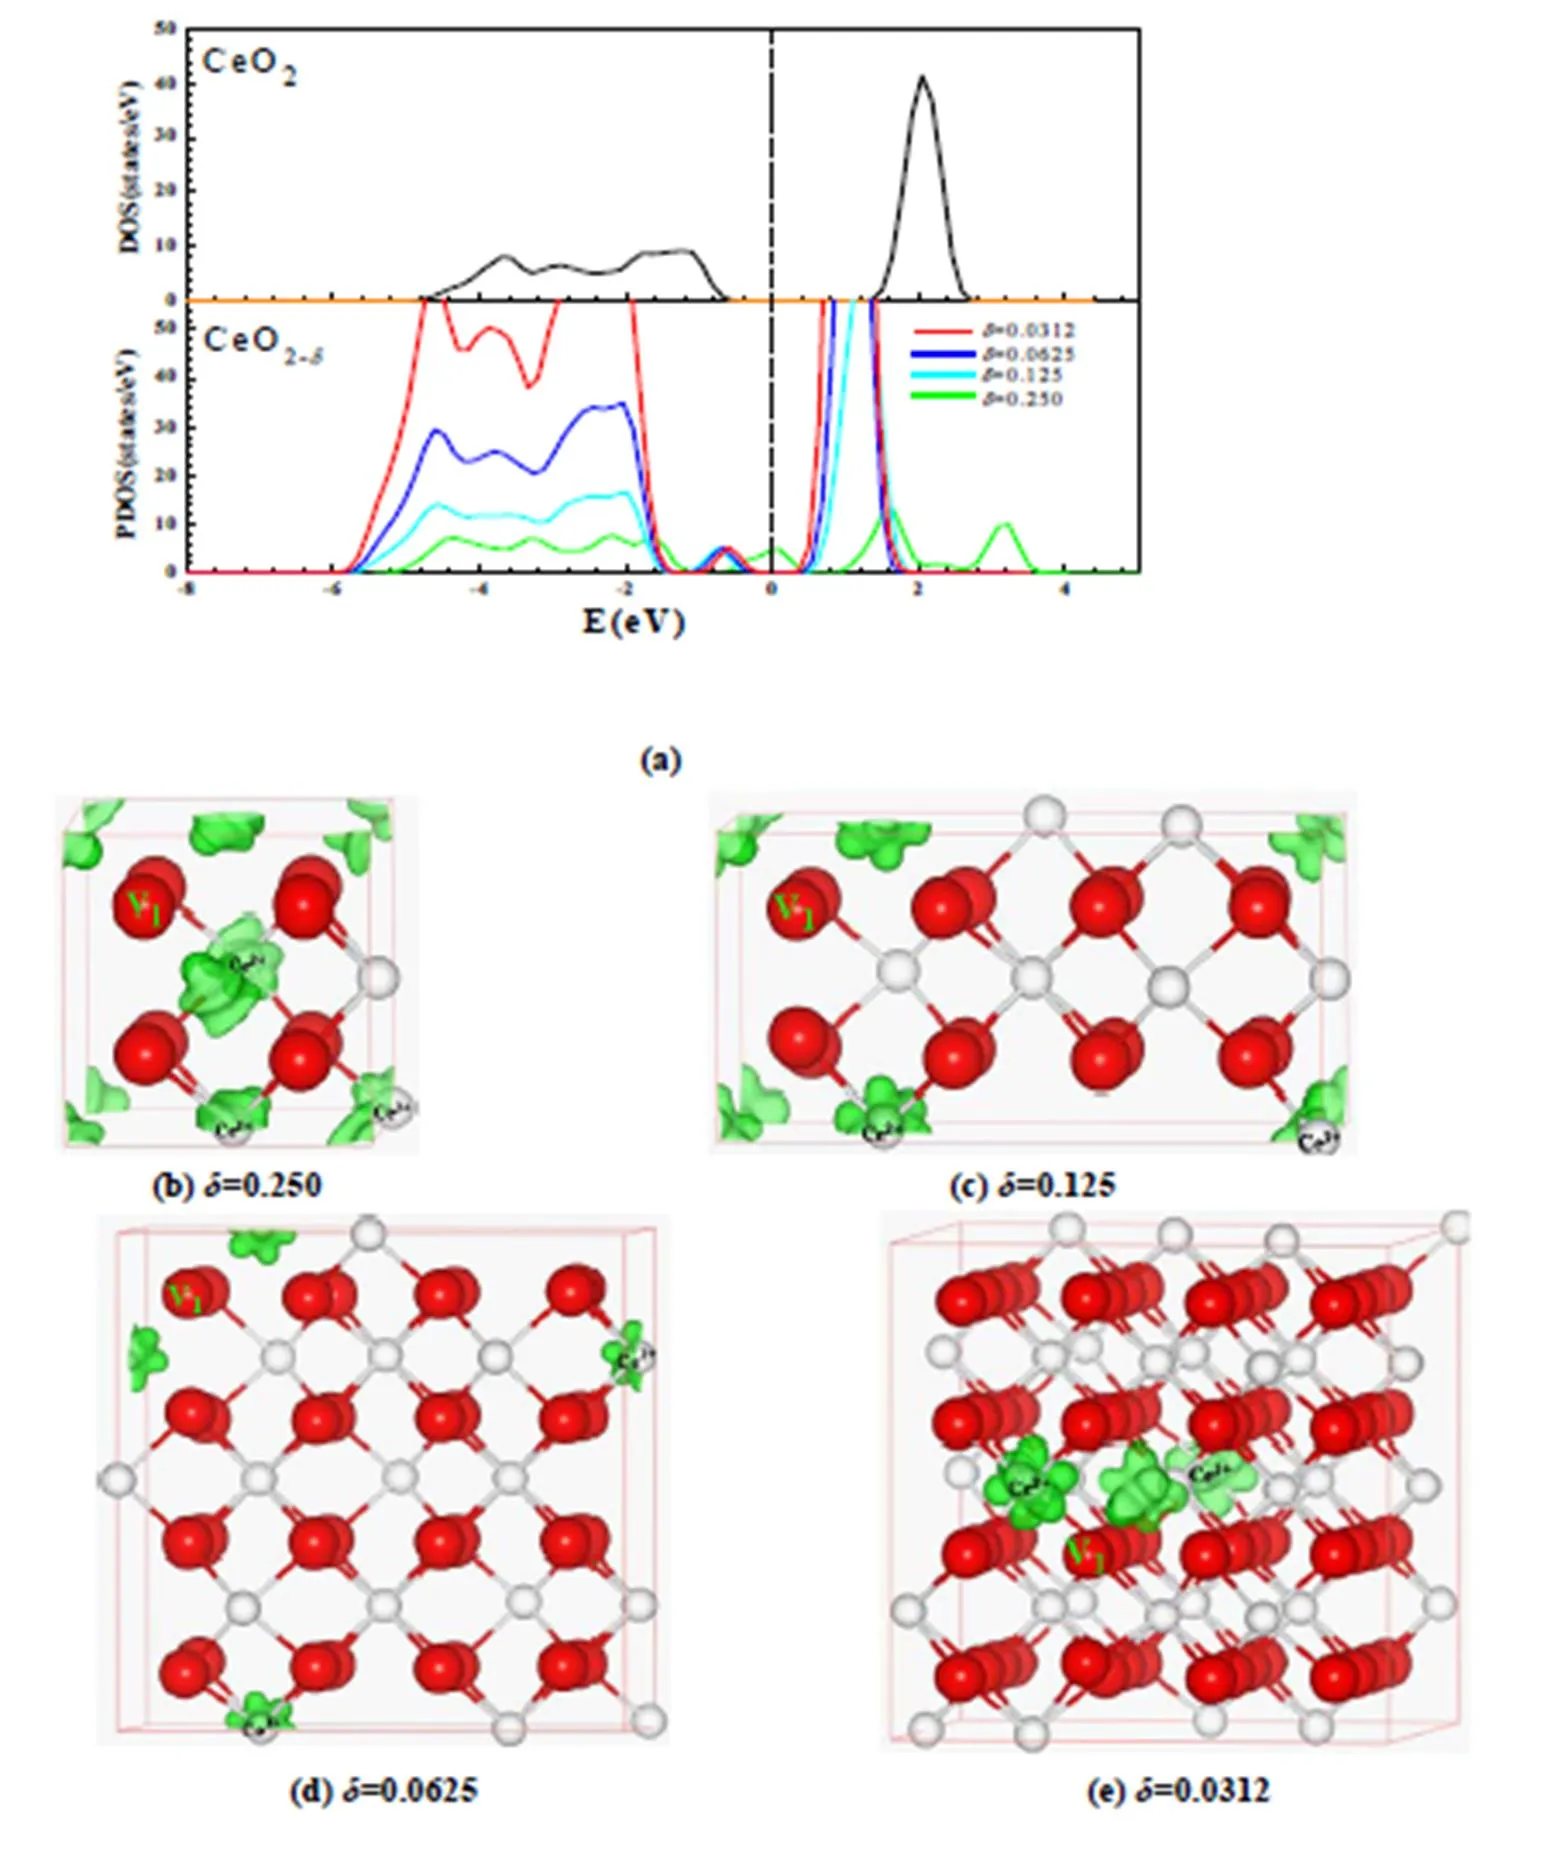
Fig. 4. DOS of the CeO2systems and PDOS of Ce4state for CeO1.9688, CeO1.9375, CeO1.875and CeO1.75systems (a) and the corresponding LDOS (b)-(e) of the defect peaks. The isosurface is shown in green and is set to 0.05 e/?. Here, one primitive cell of various CeO2-δsystems with a 2 × 2 × 2 supercell is shown
From the PDOS of Ce4state for SmCe1-xO2-δ(0.0312≤≤0.25, 0.0312≤≤0.5) systems, see Fig. 5a, similar to CeO2-δsystems mentioned above, a new peak appears in the range of O2~Ce4empty. From the corresponding LDOS of the defect Ce3+state, see Fig. 5c-j, we can see that excess electrons arise from oxygen vacancies and are localized on-level traps of their neighbor Ce, like the case of CeO2-δsystems[5, 26, 30, 32]. For the Sm0.0312Ce0.9688O1.9375system, see Fig. 5j, there are two oxygen vacancies in the 2×2×2 supercell, so they should induce four charge-compensation cations. However, the calculated result finds that there are three, maybe due to the existence of V1-Sm3+-V2structure with a face diagonal position relationship in lower reduced atmosphere and then doped Sm3+can restrain the reduction of Ce4+.
In order to better restrain excess electrons, SmCaCe1-x-yO2-δ(0.0312≤≤0.25, 0.0312≤≤0.25, 0.0312≤≤0.5 ) systems with various,andare explored. From the DOS of Fig. 5b of SmCaCe1-x-yO2-δsystems, we can see that, except for the Sm0.0625Ca0.0625Ce0.875O1.875system, SmCaCe1-x-yO2-δsystems have no Ce3+. In other words, in order to avoid the existence of Ce3+,andmust be respectively larger than 0.0625 as= 0.125 ormust be smaller than 0.125 as== 0.0625. For a series of SmCaCe1-x-yO2-δsystems, from their corresponding LDOS of the defect Ce3+state in Fig. 5c-k, we can see that excess electrons arise from oxygen vacancies and are localized on-level traps of their neighbor Ce, like the case of CeO2-δ[5, 26, 30, 32].
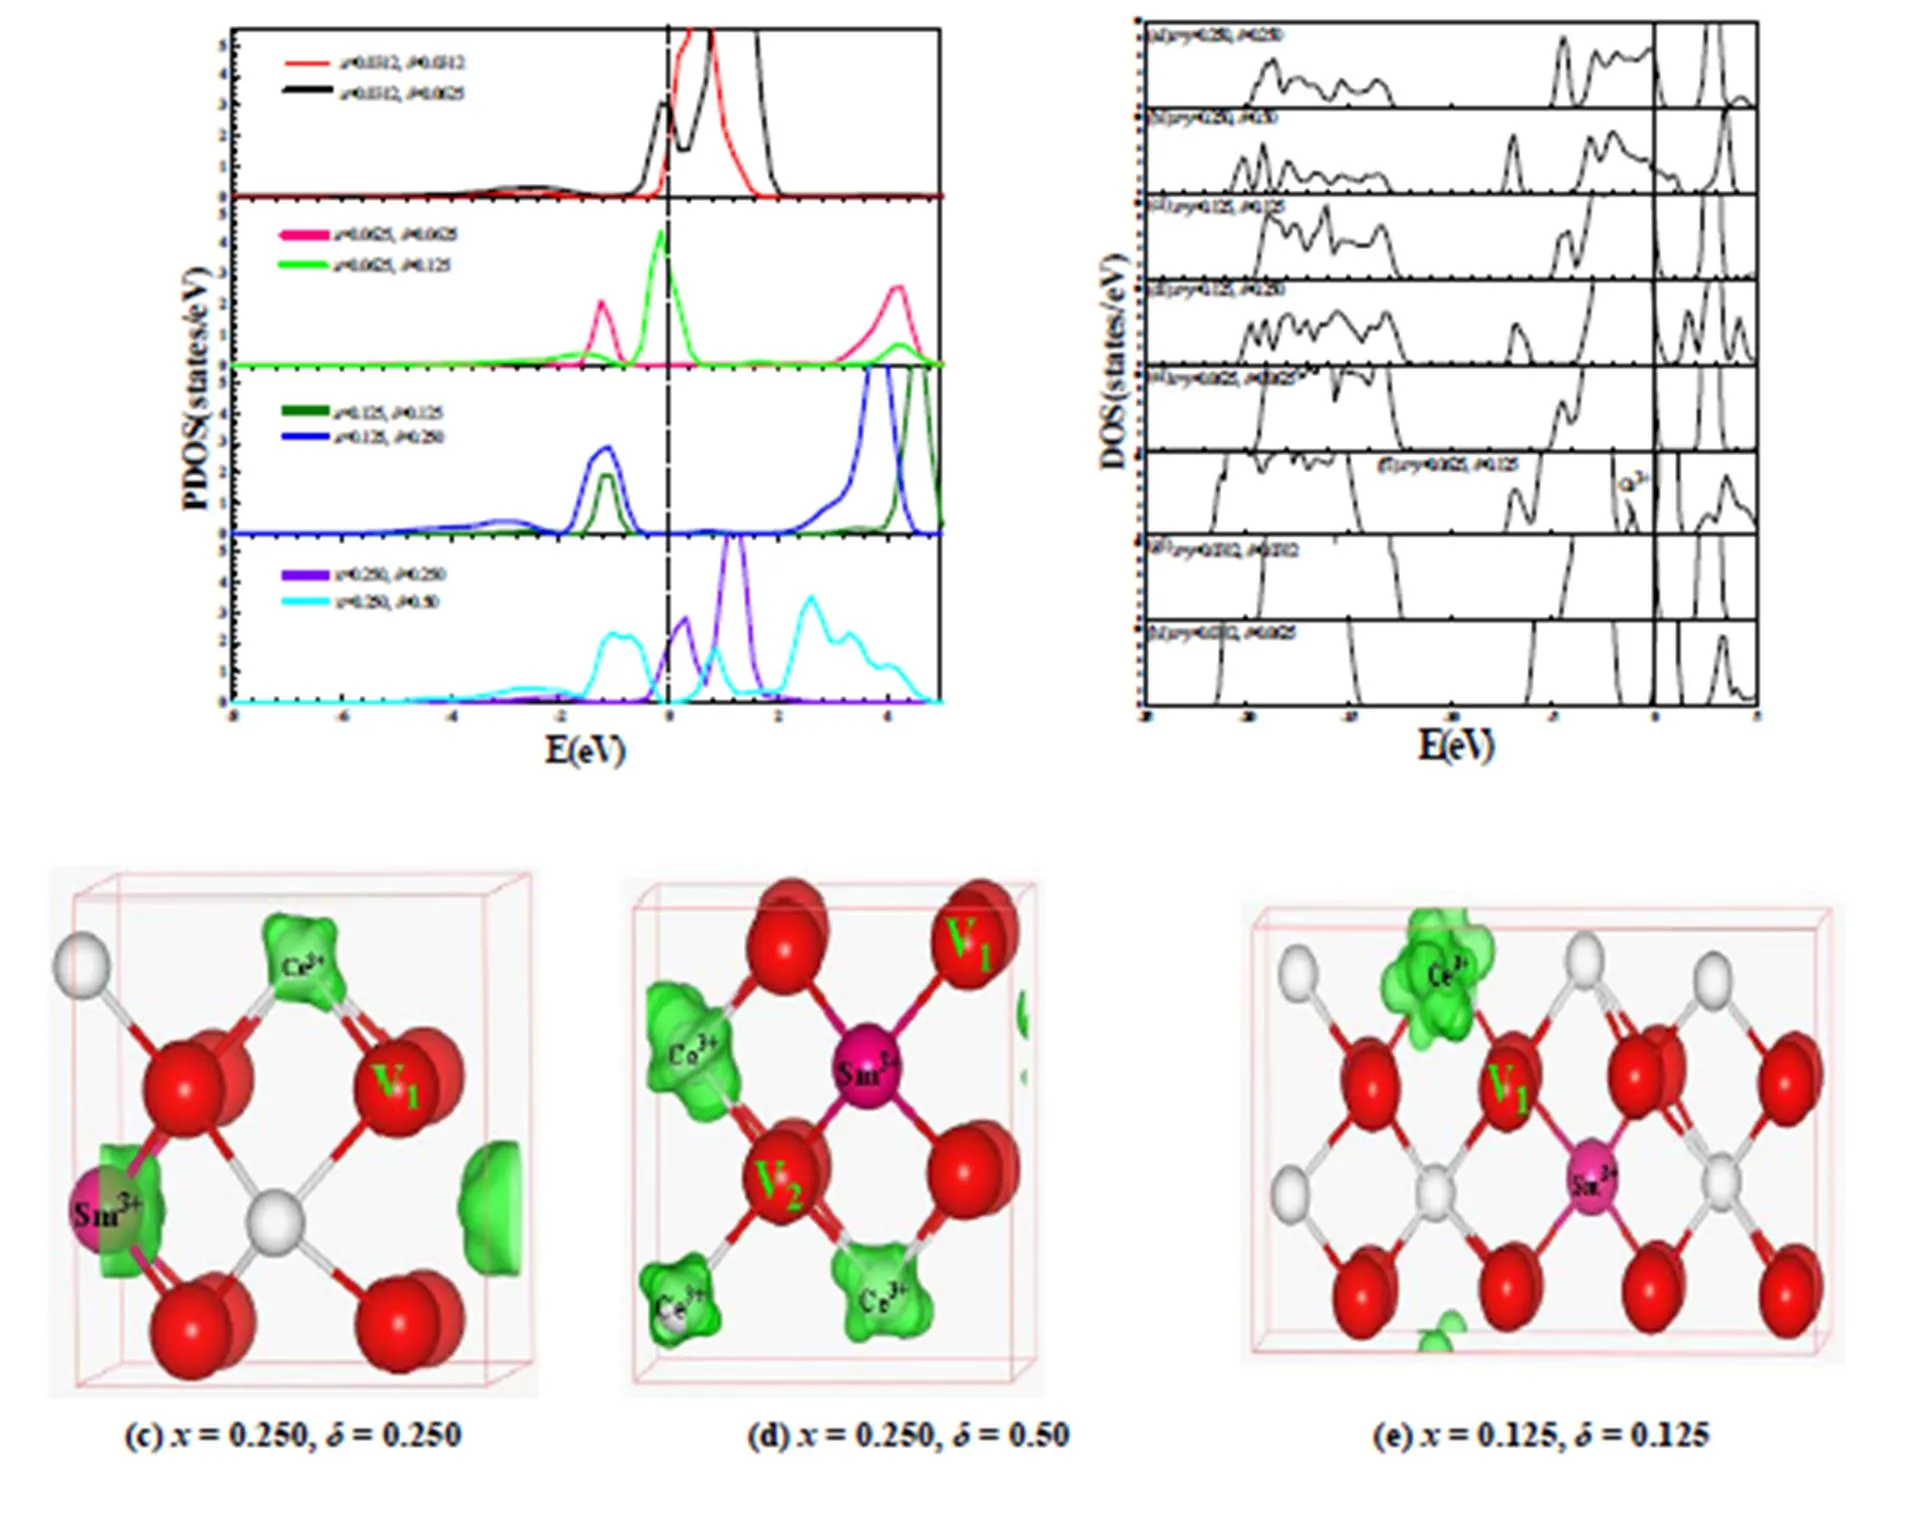
Fig. 5. PDOS of Ce4states for the SmCe1-xO2-δ(0.0312≤≤0.25, 0.0312≤≤0.5) systems (a) and DOS of SmCaCe1-x-yO2-δ(0.0312≤≤0.25, 0.0312≤≤0.25, 0.0312≤≤0.5) systems (b) and the corresponding LDOS (c)~(k) of the defect peaks. Oxygen vacancies are represented by V1and V2. The isosurface is shown in green and set to 0.05 e/?
3. 3. 2 Transitional area of Ce4+to Ce3+and Ce3+/Ce4+change ratio k forSmCaCe1-x-yO2-δsystems with different oxygen vacancy and doping concentrations
In order to visually understand transitional area of Ce4+to Ce3+for the SmCaCe1-x-yO2-δsystems with various oxygen vacancy and doping concentrations, their transitional areas of Ce4+to Ce3+for the SmCe1-xO2-δ(Fig. 6a) and the SmCaCe1-x-yO2-δsystems (Fig. 6b) are plotted.
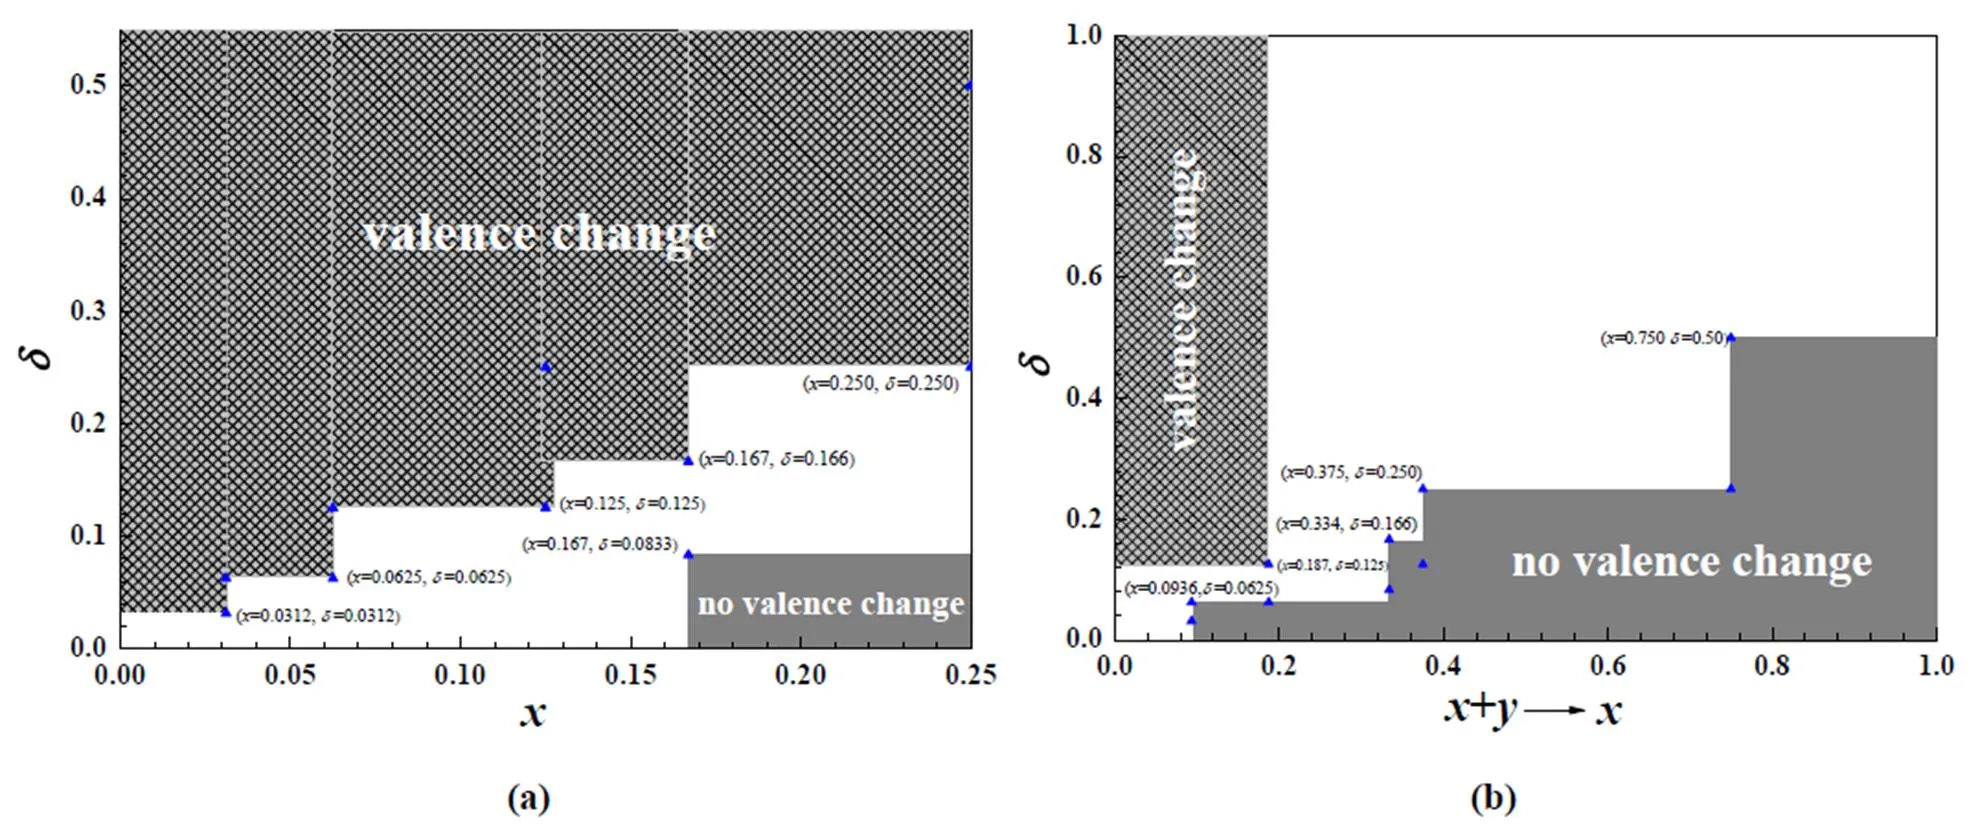
Fig. 6. Transitional area of Ce4+to Ce3+and Ce3+/Ce4+change ratiofor SmCe1-xO2-δand SmCaCe1-x-yO2-δsystems with different oxygen vacancy and doping concentrations
From Fig. 6a, we can see that no Ce3+exists for the SmCe1-xO2-δsystems with≥ 0.167 and≤0.0833 and Ce3+exists for the SmCe1-xO2-δsystems with≤ 0.0312 and≥ 0.0312,≤ 0.0625 and≥ 0.0625,≤ 0.125 and≥ 0.125,≤ 0.167 and≥ 0.166, and≤ 0.250 and≥ 0.250. For the SmCaCe1-x-yO2-δsystem as y ≠ 0, the substitution of Ce4+by Ca2+makes two excess electrons and the substitution of Ce4+by Sm3+makes one excess electron. Based on the case, for convenience of totally reflecting the effect of the doping concentration on the transition ratio of Ce4+to Ce3+, the doping effect of one Ca2+is transformed to that of two Sm3+, in which the ionic radius of doping Ca2+andSm3+is omitted, and its corres- ponding transitional area of Ce4+to Ce3+is plotted in Fig. 6b. From Fig. 6b, we can see that no Ce3+exists for the SmCaCe1-x-yO2-δsystems with≥0.0936 and≤ 0.0625,≥0.334 and≤ 0.166,≥0.375 and≤ 0.250, and≥0.750 and≤ 0.50 and Ce3+exists for the SmCaCe1-x-yO2-δsystems with≤ 0.187 and≥ 0.125.
The Ce3+/Ce4+change ratioin SmCe1-xO2-δsystems with various oxygen vacancy and doping concentrations are studied, as shown in Fig. 6c. From Fig. 6c, we can see thathas obvious monotonous increase with increasing the vacancy concentration, and the introduction of Sm3+reduces,such as Sm0.0312Ce0.9688O1.9375, Sm0.0625Ce0.9375O1.875, Sm0.125Ce0.875O1.75, Sm0.166Ce0.834O1.668and Sm0.25Ce0.75O1.5systems, namely, the introduction of Sm3+restrains the reduction of Ce4+to Ce3+It need be pointed out that Sm0.25Ce0.75O1.5system can be thought of as Sm-doped Ce2O3, because of no unoccupied defect states between the occupied Ce3+states and the unoccupied Ce4empty, see Fig. 5a, in accordance with other theoretical work[51-53].
4 CONCLUSION
In this work, the influence of Sm3+single-doping or Ca2+and Sm3+co-doping, oxygen vacancies and their concentrations on the geometric and electronic structures of SmCaCe1-x-yO2-δsystems are studied. Results for the geometric structures show that the V1-Sm3+-V2structures where there is a position relationship of diagonal of the face between V1and V2both nearest to Sm3+are easily obtained, in agreement with the case of pure CeO2systems. Study for electronic structures finds that the oxygen vacancies are contributed to excess electrons and these electrons are localized on-level traps of its neighbor Ce for the SmCaCe1-x-yO2-δsystems. The Ce3+/Ce4+change ratiois related with the dopant and oxygen vacancy concentrationsIn addition, the existence of V1-Sm3+-V2structure with face diagonal position relationship in lower reduced atmosphere maybe makes the doped Sm3+restrain the reduction of Ce4+. It need be pointed out that Sm0.25Ce0.75O1.5system can be thought of as Sm-doped Ce2O3.
(1) Brett, D. J. L.; Atkinson, A.; Brandon, N. P.; Skinner, S. J. Intermediate temperature solid oxide fuel cells.2008, 37, 1568–1578.
(2) Ruiz, T. E.; Sirman, J. D.; Baikov, Y. M.; Kilner, J. A. Oxygen ion diffusivity, surface exchange and ionic conductivity in single crystal Gadolinia doped Ceria.1998,113, 565–569.
(3) Park, S.; Vohs, J. M.; Gorte, R. J. Direct oxidation of hydrocarbons in a solid-oxide fuel cell.()2000, 404, 265–267.
(4) Molinari, M.; Parker, S. C.; Sayle, D. C.; Islam, M. S. Water adsorption and its effect on the stability of low index stoichiometric and reduced surfaces of ceria.2012, 116, 7073–7082.
(5) Kullgren, J.; Hermansson, K.; Castleton, C. Many competing ceria(110) oxygen vacancy structures: from small to large supercells.2012, 137, 044705.
(6) Allen, J. P.; Watson, G. W. Occupation matrix control of- and-electron localisations using DFT +.2014, 16, 21016–21031.
(7) Steele, B. C. H. Appraisal of Ce1-yGdO2-y/2electrolytes for IT-SOFC operation at 500 ℃.2000, 129, 95–110.
(8) Ismail, A.; Hooper, J.; Giorgi, J. B. A DFT + U study of defect association and oxygen migration in samarium-doped ceria.2011, 13, 6116–6120.
(9) Suparna, B.; Parukuttyamma, S. D.; Dinesh, T. S. M.; Krishnakumar, M. Enhanced ionic conductivity in Ce0.8Sm0.2O1.9: unique effect of calcium Co-doping.2007, 17, 2847–2854.
(10) Wang, F. Y.; Cheng, S.Gd3+and Sm3+co-doped ceria based electrolytes for intermediate temperature solid oxide fuel cells.2004, 6, 743–746.
(11) Kim, N.; Kim, B. H.; Lee, D. Effect of co-dopant addition on properties of gadolinia-doped ceria electrolyte.2000, 90, 139–143.
(12) Mori, T.; Yamamura, H. Preparation of an alkali-element or alkali-earth-element-doped CeO2-Sm2O3system and its operation properties as the electrolyte in planar solid oxide fuel cells.1998, 6, 175–179.
(13) Van, H. J.; Horita, T.; Kawada, T.; Sakai, N.; Yokokawa, H.Low temperature fabrication of (Y, Gd, Sm)-doped ceria electrolyte.1996, 86, 1255–1258.
(14) Yang, N.; Belianinov, A.; Strelcov, E. Effect of doping on surface reactivity and conduction mechanism in samarium-doped ceria thin films.2014, 8, 12494–12501.
(15) Ruiz-Trejo, E.; Sirman, J. D.; Baikov, Y. M.; Kilner, J. A. Nanoparticles and nanoceramics of Y-doped CeO2.1998, 113, 565–571.
(16) Yoshida, H.; Deguchi, H.; Miura, K. Investigation of the relationship between the ionic conductivity and the local structures of singly and doubly doped ceria compounds using EXAFS measurement.2001,140, 191–199.
(17) Andersson, D. A.; Simak, S. I.; Skorodumova, N. V.Optimization of ionic conductivity in doped ceria.2006, 103, 3518–3521.
(18) Yin, Y. H.; Li, S. Y.; Zhu, W.; Xia, C. R. Research on calcium-doped ceria used in intermediate-temperature SOFCs anodes.2005, 03, 317–322.
(19) Mogensen, M.; Lindegaard, T.; Hansen, U. R. Physical properties of mixed conductor solid oxide fuel cell anodes of doped CeO2.1994, 141, 2122–2126.
(20) Wei, X.; Pan, W.; Cheng, L. Atomistic calculation of association energy in doped ceria.2009, 180, 13–17.
(21) Frayret, C.; Villesuzanne, A.; Pouchard, M.; Matar, S.Density functional theory calculations on microscopic aspects of oxygen diffusion in ceria-based materials.2005, 101, 826–839.
(22) Nakayama, M.; Martin, M. First-principles study on defect chemistry and migration of oxide ions in ceria doped with rare-earth cations.2009, 11, 3241–3249.
(23) Grinter, D. C.; Ithnin, R.; Pang, C. L.; Thorton, G. Defect structure of ultrathin ceria films on Pt(111): atomic views from scanning tunneling microscopy.2010, 114, 17036–17041.
(24) Nolan, M.; Fearon, J. E.; Watson, G. W. Oxygen vacancy formation and migration in ceria.2006, 177, 3069–3074.
(25) Jia, G. X.; Hao, W. X.; Pan, F.; Yang, J. C.; Zhang, Y. F. Electronic structures and oxygen ion migration energies of metal doped CeO2systems: a DFT+study.2013, 71, 1668–1675.
(26) Wu, T. W.; Jia, G. X.; Bao, J. X.; Liu, Y. Y.; An, S. L. Electronic structures and oxygen ion migrations of the CaO or BaO and Sm2O3co-doped CeO2System: A DFT + U Study.2016, 32, 1363–1369.
(27) Yahiro, H.; Eguchi, K.; Arai, H. Electrical properties and reducibilities of ceria-rare earth oxide systems and their application to solid oxide fuel cell.1989, 36, 71–75.
(28) Kumar, A.; Devi, P. S.; Maiti, H. S.A novel approach to develop dense lanthanum calcium chromite sintered ceramics with very high conductivity.2004, 16, 5562–5563.
(29) Banerjee, S. P.; Devi, S. Sinter-active nanocrystalline CeO2powder prepared by a mixed fuel process: effect of fuel on particle agglomeration.2007, 9, 1097–1107.
(30) Murgida, G. E.; Ferrari, V.; Ganduglia, P. M. V. Ordering of oxygen vacancies and excess charge localization in bulk ceria: a DFT + U study.2014, 90, 115120/1–10.
(31) Zhang, C.; Michaelides, A.; King, D. A.; Jenkins, S. J. Oxygen vacancy clusters on ceria: decisive role of ceriumelectrons.2009, 79, 075433/1–11.
(32) Graciani, J.; Antonio, M.; Márquez, J. J.; Plata, Y. O.; Norge, C.; Meyer, H. A.; Claudio, M.; Zicovich, W.; Javier, F. S. Comparative study on the performance of hybrid DFT functionals in highly correlated oxides: the case of CeO2and Ce2O3.2011, 7, 56–65.
(33) Hooper, J.; Ismail, A.; Giorgi, J. B. Computational insights into the nature of increased ionic conductivity in concentrated samarium-doped ceria: a genetic algorithm study.2010, 12, 12969–12972.
(34) Kresse, G.; Furthmüller, J. Efficiency oftotal energy calculations for metals and semiconductors using a plane-wave basis set.. 1996, 6, 15–50.
(35) Delfina, G. P.; Alfredo, J.; Beatriz, I. Mn-doped CeO2: DFT + U study of a catalyst for oxidation reactions.2013, 117, 18063–18073.
(36) Perdew, J. P.; Burke, K.; Ernzerhof, M. Generalized gradient approximation made simple.1996, 77, 3865–3867.
(37) Castleton, C. W.; Kullgren, J.; Hermansson, K. Tuning LDA+U for electron localization and structure at oxygen vacancies in ceria.2007, 127, 244704/1–11.
(38) Loschen, C.; Carrasco, J.; Neyman, K. M. Illas, F. First-principles LDA+U and GGA+U study of cerium oxides: Dependence on the effective U parameter.2007, 75, 035115/1–8.
(39) Nolan, M.; Parker, S. C.; Watson, G. W. Reduction of NO2 on ceria surfaces.2006, 110, 2256–2262.
(40) Nolan, M.; Watson, G. W. The surface dependence of CO adsorption on ceria.2006, 110, 16600–16606.
(41) Nolan, M.; Parker, S. C.; Watson, G. W. CeO2catalysed conversion of CO, NO2and NO from first principles energetics.2006, 8, 216–218.
(42) Scanlon, D. O.; Galea, N. M.; Morgan, B. J.; Watson, G. W. Reactivity on the (110) surface of ceria: a GGA+study of surface reduction and the adsorption of CO and NO2.2009, 113, 11095–11103.
(43) Keating, P. R. L.; Scanlon, D. O.; Watson, G. W. Intrinsic ferromagnetism in CeO2: dispelling the myth of vacancy site localization mediated superexchange.2009, 21, 405502/1–6.
(44) Dudarev, S. L.;Botton, G. A.; Savrasov, S. Y.; Humphreys, C. J.; Sutton, A. P. Surface proton hopping and fast-kinetics pathway of water oxidation on Co3O4(001) surface.1998, 57, 1505–1517.
(45) Larson, P. W.; Lambrecht, R. L.; Chantis, A. N.; Schilfgaarde, V. M. Electronic structure of rare-earth nitrides using the LSDA+approach: importance of allowing 4orbitals to break the cubic crystal symmetry.2007, 75, 045114/1–14.
(46) Dorado, B.; Jomard, G.; Freyss, M.; Bertolus, M. Stability of oxygen point defects in UO2by first-principles DFT + U calculations: occupation matrix control and Jahn-Teller distortion.2010, 82, 035114/1–11.
(47) Feng, J.; Xiao, B.; Wan, C. L.Electronic structure, mechanical properties and thermal conductivity of Ln2Zr2O7(Ln = La, Pr, Nd, Sm, Eu and Gd) pyrochlore.2011, 59, 1742–1760.
(48) Monkhorst, H. J.; Pack, J. D. Special points for Brillouin-zone integrations.1976, 13, 5188–5192.
(49) Fergus, J. W. Recent developments in cathode materials for lithium ion batteries.2006, 189, 30–36.
(50) Nolan, M.; Parker, S. C.; Watson, G. W. The electronic structure of oxygen vacancy defects at the low index surfaces of ceria.2005, 595, 223–232.
(51) Silva, D. G. L. F.; Ganduglia, P. M. V.; Sauer, J.; Bayer, V.; Kresse, G. Hybrid functionals applied to rare-earth oxides: the example of ceria.2007, 75, 045121/1–10.
(52) Skorodumova, N. V.; Ahuja, R.; Simak, S. I.; Abrikosov, A.; Johansson, B.; Lundqvist, B. I. Electronic, bonding, and optical properties of CeO2and Ce2O3from first principles.2001, 64, 115108/1–9.
(53) Andersson, D. A.; Simak, S. I.; Johansson, B.; Abrikosov, I. A.; Skorodumova, N. V. Modeling of CeO2, Ce2O3, and CeO2-xin the LDA+formalism.2007, 75, 035109/1–6.
9 May 2017;
8 August 2017
10.14102/j.cnki.0254-5861.2011-1715
①the National Natural Science Foundation of China (No. 51474133) and Inner Mongolia Natural Science Foundation (No. 2016MS0513)
②E-mail: guixiao.jia@163.com
- 結(jié)構(gòu)化學的其它文章
- Synthesis, Crystal Structure and Photoluminescent Property of a New Zn(II) Complex Based on 3,4-Bis(2-pyridyl)-5-(4-pyridyl)-1,2,4-triazole①
- A New Dinuclear Zinc Polymer Based on 3-Methoxy-2-hydroxybenzaldehyde:Synthesis, Structure, Spectral Characterization and Hirshfeld Surface Analysis①
- Fabrication of WO3/TiO2 Heterostructures for Efficiently Photocatalytic Gaseous Hydrocarbons Degradation: Origin of Photoactivity and Revisit the Role of WO3 Decoration①
- Two Copper Complexes Based on Pyrazole- 3-carboxylic Acid as Heterogeneous Catalysts for Highly Selective Oxidation of Alkylbenzenes①
- Synthesis, Crystal Structure and Cytotoxic Activities of Oxazolidin-2-one Derivatives①
- Crystal Structures, Thermal Behaviors and Biological Activities of Acylhydrazone Compounds Containing Pyrazine Rings and Halogen Atoms①