
Spatial and Temporal Variation in Water Productivity and Grain Water Utilization Assessment of Heilongjiang Province, Northeast China
2018-04-02 09:18:18FuQiangSunMengxinLiTianxiaoCuiSongLiuDongandYanPeiru
Fu Qiang, Sun Meng-xin, Li Tian-xiao, Cui Song, Liu Dong, and Yan Pei-ru
College of Water Conservancy and Civil Engineering, Northeast Agricultural University, Harbin 150030, China
Introduction
In recent years, rapid economic development and population growth have increased the consumption of water to meet additional demands for food, intensified the competition for water among agriculture, industry,and the environment.Agriculture is the largest waterconsuming sector (FAO, 1994; Rosegrantet al., 2002),and in many developing countries, irrigated agriculture has been expanding rapidly in recent decades.Under the pressures of water scarcity and increasing population growth, China's agricultural production is being challenged to produce more agricultural products despite limited water resources (Brown and Halweil,1998; Kanget al., 2010).Specifically, Heilongjiang Province is an important grain production region located in southeastern China.Analyzing the current agricultural water use and improving water productivity are necessary to meet this challenge.
The term "water productivity" (WP) was originally promoted by Molden (1997) and is used to express production per unit of water consumed (Perryet al., 2009).Many spatial-temporal studies of regional or basin-scaleWPhave been reported in the literature.So far, two major procedures for assessing regionalWPhave been widely applied.The first uses statistical or model-simulated yield and water use data to assessWP(Garget al., 2012; Amarasinghaet al.,2015; Wanget al., 2014).For instance, Chapagain and Hoekstra (2004) used statistical data from the Food and Agricultural Organization (FAO) to determine theWPof each country in the world from 1997 to 2001.Based on a review of 84 literature sources containing experiments from the past 25 years, Zwart and Bastiaanssen (2004) estimated the average values and global ranges of crop water productivity (CWP)for irrigated wheat, rice, cotton and maize.Igbadunet al.(2006) quantifiedCWPof a maize crop cultivated under irrigation from field experimental data in the Mkoji subcatchment of the Great Ruaha River Basin in Tanzania.Huang and Li (2010) assessed basin-scaleCWPfor the staple grain crops rice, wheat, maize and soybean in the major breadbasket basins of China over the period 1997-2004 using a hydro-modelcoupled-statistics approach.Sharmaet al.(2016)quantified and mapped long-term spatial-temporal variability inCWP, evapotranspiration water productivity and associated environmental variables at regional scales for maize- and soybean-producing counties in Nebraska.
The second procedure integrates remote sensing(RS) and geographical information system (GIS)technology with models to obtain spatial-temporal expressions of yield and water use and to then assessWP(Zwartet al., 2010a; Caiet al., 2010; Yan and Wu,2014; Camposet al., 2017).Liuet al.(2007) estimated the global production andWPof wheat by developing a GIS-based EPIC model.Zwartet al.(2010b) studied global wheatWPby developing WATPRO model,which is based on RS data combined with normalized difference vegetative index (NDVI) and surface albedo data sets.Yan and Wu (2014) analyzed theCWPof winter wheat based on RS data and found a steady increase inCWPin recent years.Caiet al.(2010) studied rice yield, water consumption and WP in the Ganges basin in India based on RS, statistics and meteorological data.Liet al.(2016) evaluated the spatial pattern ofCWPin the middle reaches of the Heihe River Basin using the Aqua Crop model.
The previous studies, however, have been chiefly concerned with single crops (Phogatet al., 2017;Howellet al., 2015) or with a kind of water input.This paper attempted to incorporate the staple grain crops rice, maize and soybean into a single integrated analytical framework using fourWPindices to represent different water inputs.Based on data collected from the main irrigation districts of 12 prefecture-level cities in Heilongjiang Province, our study quantified temporal variation and spatial distribution inWPusing spatial statistics.Aimed to address the issues associated with grain crop production and water use at the regional scale across Heilongjiang Province.In addition, this paper discussedWP-based policy suggestions for improving agricultural water management in irrigated land and provided suggestions for targeted irrigation programs in various regions of Heilongjiang Province.
Materials and Methods
Study area
The study region, Heilongjiang Province, is located in the northeastern part of China between 121°13'-135°06'E and 43°26''-53°34''N (Fig.1).Its topography is characterized by mountains to the north and east which surrounds the central great plains.The Songnen Plain to the west and the Sanjiang Plain to the northeast are two of the most important regions of agricultural production in China (Huet al., 2017).The climate ranges from humid to semi-humid, with an average precipitation of approximately 540 mm/year,and the growing season precipitation (May-September)accounts for 80%-90% of the yearly rainfall.Heilongjiang Province has 15.94 million hectares of arable land, ranking second in China, per capita arable land is three times the country average.Food crops are mainly rice, maize and soybean, which cover more than 90% of the total sown area.Water is essential for agricultural development and food production.China's water resources are abundant, but the per capita water availability is only 2 039.2 m3, less than a quarter of the global level, while the per capita water availability in Heilongjiang Province is 2 129.8 m3, which is near the average for China.The water demands of grain production seriously restrict the distribution of water resources to other industries in Heilongjiang Province.Therefore, studying the grain water productivity (WP)and water use situation in Heilongjiang Province is very important.
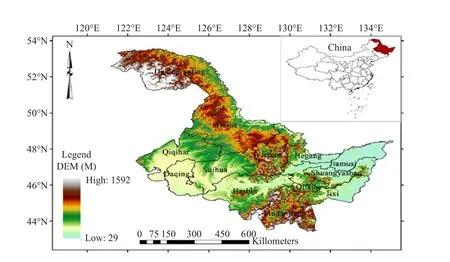
Fig.1 Map of Heilongjiang Province
Data resources
Based on the availability of data, the production of rice, maize and soybean in 12 prefecture-level cities in Heilongjiang Province from 2007 to 2015 was selected as the study topic.The Daxing'anling region is not suitable for the growth of food crops due to terrain and climatic conditions and was therefore not included in our analysis.The meteorological data included the highest and the lowest temperature,sunshine hours, wind speed, relative humidity and precipitation, of these 12 cities were obtained from the China Meteorological Data Service Center (http://data.cma.cn/).Grain yield per unit area, county and city land area and other data were from the Heilongjiang Statistical Yearbook.Irrigation water, irrigated area,irrigation water utiliza-tion coefficient and other irrigation data were from the Heilongjiang Water Conservancy Construction Yearbook and Heilongjiang Province irrigation water utilization analysis and analysis results summary.The crop coefficientKcwas determined using crop yields in related studies.
WP indices
WPcan be expressed as agricultural production per unit volume of water.The numerator may be expressed in terms of crop yield (kg · hm-2).A number of options are available to define the volume of water per unit of area (m3· hm-2) in the denominator (Playan and Mateos, 2006).Based on data availability, four in dices were selected and calculated in this study.Eqs.(1)-(4) represented the ratios of grain yield to gross water inflow, generalized agricultural water input,field evapotranspiration (crop water consumption)and irrigation water withdrawal, respectively; the correspondingWPindices were called gross inflow water productivity (WPg), generalized agricultural water productivity (WPa), evapotranspiration water productivity (WPET) and irrigation water productivity(WPI), respectively.The indices differred in scientific connotation and numerical performance, but any of them could be used to quantify the relationship between water utilization and grain production.Gross water inflow (10P+Ig) referred to the maximum quantity of water resources a region could supply within a specific time, soWPgreflected the climate and condition of water resources in the region.Generalized agricultural water input (10Pe+Ig) was the amount of water resources used for agricultural production during the crop growth period, which consisted of effective precipitation and irrigation water in flow (Li and Huang, 2010).Field evapotranspiration was the actual amount of water consumed by crop production,and improvingWPETwas a direct method of enhancing the efficiency of water use at the field scale.

Where,Ywas the yield of grain crops (kg · hm-2);Pwas the precipitation during crop growth period (mm);Igwas irrigation water diverted (m3· hm-2);Pewas the effective precipitation during crop growth period(mm); andETcwas growing-season crop evapotranspiration (mm).Pewas the fraction of the total precipitationPas rainfall that was available to the crop and did not run off.Without detailed site-specific information,Pewas very difficult to determine.A simple approximation was provided by the U.S.Department of Agriculture Soil Conservation (D?ll and Siebert, 2002).
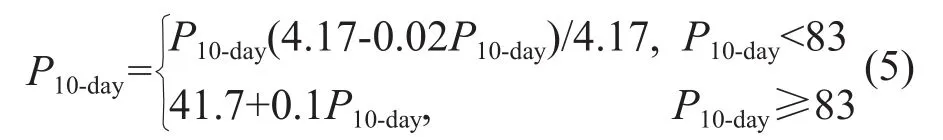
Where,P10-dayandPe10-daywere the 10-day precipitation and effective precipitation (mm), respectively.
Grain evapotranspiration
Daily reference evapotranspiration was computed using the standardized Penman-Monteith (Djamanet al., 2016).The Penman-Monteith method recommended by FAO 56 was used in this paper to estimateET0as expressed by Eq.(6).Actual evapotranspiration for a given agricultural crop could be related to the potential evapotranspiration,ET0, according to Eq.(7)(Jenson, 1968).
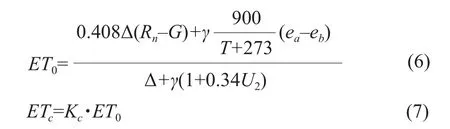
Where,ET0was the crop reference evapotranspiration (mm · d-1);Rnwas the net radiation at the crop surface (MJ · m-2d);Gwas the soil heat flux density(MJ · m-2d);Twas the mean daily air temperature (℃);eawas the actual vapor pressure (kPa);ebwas the saturation vapor pressure (kPa); Δ was the slope vapor pressure curve (kPa · ℃-1);γwas the psychometric constant (kPa · ℃-1);U2was the wind speed at a height of 2 m (m · s-1); andETcwas actual crop evapotranspiration.Kcwas the crop coefficient, which was dimensionless.
Provincial WP
WPat the provincial scale was weighted by the effective irrigation area of each city based on the calculatedWPresults of each city:

Where,WPprov.was the provincial water productivity(kg · m-3);nwas the number of prefecture-level cities;WPiwasWPof cityi(kg · m-3); andSiwas the effective irrigated area of cityi(hm2).
Implications of relationships among WP indices
The gross inflow water resource was the maximum amount of water that flowed into the field in the period of crop growth.However, the field evapotranspiration represented the effective water consumption in the agricultural production process, and thus the amount of water actually required for grain production.Therefore, the ratio ofWPgtoWPETreflected the generalized water use efficiency for grain production, a dimensionless ratio called the generalized agricultural water resource consumption ratio (α).
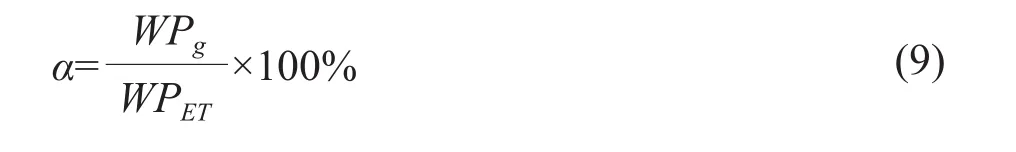
Becauseαwas the proportion of water resources actually consumed by farmland out of the total input water resources, 1–αrepresented the theoretical watersaving potential of regional food production.A higherαindicated a smaller proportion of water wasted in production and a larger amount of water that could be saved or used in other sectors.αindices could be improved on both fronts by reducing the water lost through irrigation water conveyance (evaporation from the water surface and during percolation) and increasing the effective utilization of rainwater.
However, in practical water management, managers were more likely to reduce irrigation water waste than to increase the efficient use of rainwater.Hence,an indicatorβwas introduced to measure the rate of irrigation water-saving potential with respect to the total generalized agricultural water resources:
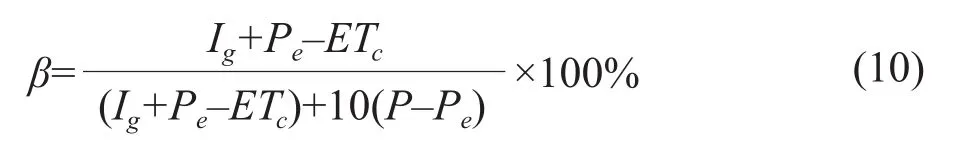
Where,βwas the proportion of the total amount of irrigation water that could be saved in generalized agricultural water resources, called the irrigation water use potential index.A higherβindicated that irrigation water represented a larger proportion than natural precipitation of the generalized agricultural water resources that were not used for crop evapotranspiration.Reducingβwas beneficial to the efficient use of water resources.
Sinceβwas similar toαin that the numerator and denominator were both water inputs,βcould also be written as a relationship betweenWPindicators.Because field evapotranspiration was also called agricultural water consumption and to facilitate rewriting formulas,ETcwas approximated as (Ig× η+Pe).
Therefore, Eq.(10) could also be written as:
Where,ηwas the irrigation water utilization coef ficient (irrigation efficiency), which was a dimensionless ratio of the volume of irrigation water used beneficially to the total volume of irrigation water applied.
According to Eq.(11),βreflected a relationship among the fourWPin dices.This relationship reflected the fact that reducing the consumption of water resources for food production, especially irrigation water resources, could improve the efficiency of water use in the region.However, due to differences in natural conditions and water resources in different areas,the urgency of reducing irrigation water input also differred.Therefore, the relationship betweenWPETandWPIwas used to establish an additional indexγ:

Ifγwas below 100%, the amount of irrigation water loss was greater than the field evapotranspiration supplied by precipitation, which might cause increased agricultural water use.Therefore,γwas called the irrigation water reduction priority index.The urgency of reducingβin regions withγvalues less than 100%was stronger than in those withγvalues above 100%(Caoet al., 2015).
Results and Discussion
Temporal and spatial distribution of water productivity (WP)
Trend analysis of provincialWPs over time
Based on Eq.(8), the fourWPs of each city were weighted to obtain provincial averages for the four indicators (Fig.2).Fig.2 showed that the four provincialWPs of grain crop in the irrigation area of Heilongjiang Province increased from 2007 to 2012,reaching a maximum in 2012 and then decreasing.Between 2013 and 2015, these values were stable.The decline inWPafter 2012 was mainly caused by Heilongjiang Province implementing a project in 2013 to change dryland fields into paddy fields in some irrigation districts, which increased production, but led to a surge in irrigation water consumption.During the study interval, the average annual rates of change inWPg,WPaandWPIfor rice were negative, butWPs of maize and soybean showed a slightly increasing trend.The average annual growth rates ofWPETwere 1.07%for rice, 4.29% for maize and 1.02% for soybean,which indicated that the utilization rates of water resources in the field were improved.
Comparing four parts of Fig.2 showed that the annual trends ofWPg,WPaandWPIin rice and maize were basically the same, while all these indices were lower in soybean due to its lower yield, which for the same amount of water provided a productivity far lower than those of rice and maize.The differences ofWPETamong the three kinds of grain were large,which indicated significant differences in the water requirements of these crops during the growth period.There were no significant differences between rice and maize for the first three indices of water productivity,butWPETshowed that the water demand of maize was lower than that of rice.
In 2007, the average rice yield was 7 020 kg · hm-2,higher than those of other years.In this year, the water input and field evapotranspiration were also high,and the four riceWPindices were at their lowest.Similarly, the yield of maize was the highest in 2014,but itsWPindices were not high.From 2008 to 2012, the yields of rice, maize and soybean increased steadily.During this period, the fluctuation of unit irrigation water was minimal, andWPindex values showed an increasing trend.Based on the statistical data of the Yearbook, the above results showed thatWPindices depended on the change of grain yield per unit area and the total amount of irrigation water.In addition, changes in rainfall had some influences onWP, but compared to the amount of irrigation water,the impact was small.
Statistical analysis of provincialWPover time
As the basis for a numerical analysis of the spatial dispersion and time variation in the fourWPs, it could be calculated the major statistics of water productivity at the city scale, including the maximum and minimum values, standard deviations (SDs) and coefficients of variation (CVs).CVwas the ratio of eachSDto its respective mean and reflected the degree of dispersion inWPover different years.The years 2007, 2012 and 2015 were selected as representative years, as shown in Table 1, because 2007 and 2015 were the starting and ending years of the study interval and 2012 had the largest number of statistical maxima.
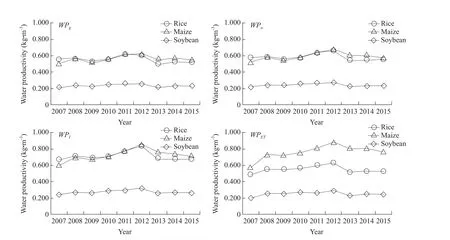
Fig.2 Provincial WPs from 2007 to 2015
Comparing the statistical values of 2007 and 2015,the difference between the maximum value and the minimum value was reduced, as wasCVamong cities,which indicated that the difference in irrigationWPamong the cities had narrowed.However,CVs of rice and soybean did not decrease consistently but rather showed maximum values in 2012, indicating thatWP's changes in these 12 prefecture-level cities were not synchronous and that the degree of spatial difference changed over time.Many factors affected the utilization of irrigation water; the study area was large, involving different terrains and climate types; and the differences in economic factors and management levels between regions were significant.These issues had a vital impact on irrigation water-use efficiency andWP.The increased regional differences in rice and soybeanWPs from 2007 to 2012 were due to these issues, which caused the grain yield and irrigation water consumption of cities to vary.However, the minimum value ofWPincreased as the cities with lowerWPimproved their irrigation; thus,the difference inWPamong the cities was gradually narrowing.
ComparingWPs within the same crop,WPs could be ranked by spatial difference asWPI>W(wǎng)Pa>W(wǎng)Pg>W(wǎng)PET.As the quantity of water input decreased, the inter-regional dispersion increased.Comparing the same indicators among the different crops, the spatial difference ranking was maize>soybean>rice.
Annual growth rate ofWPat city scale
The annual growth rate ofWPin every region of Heilongjiang Province was calculated according to the above theory, and the specific results are shown in Fig.3.
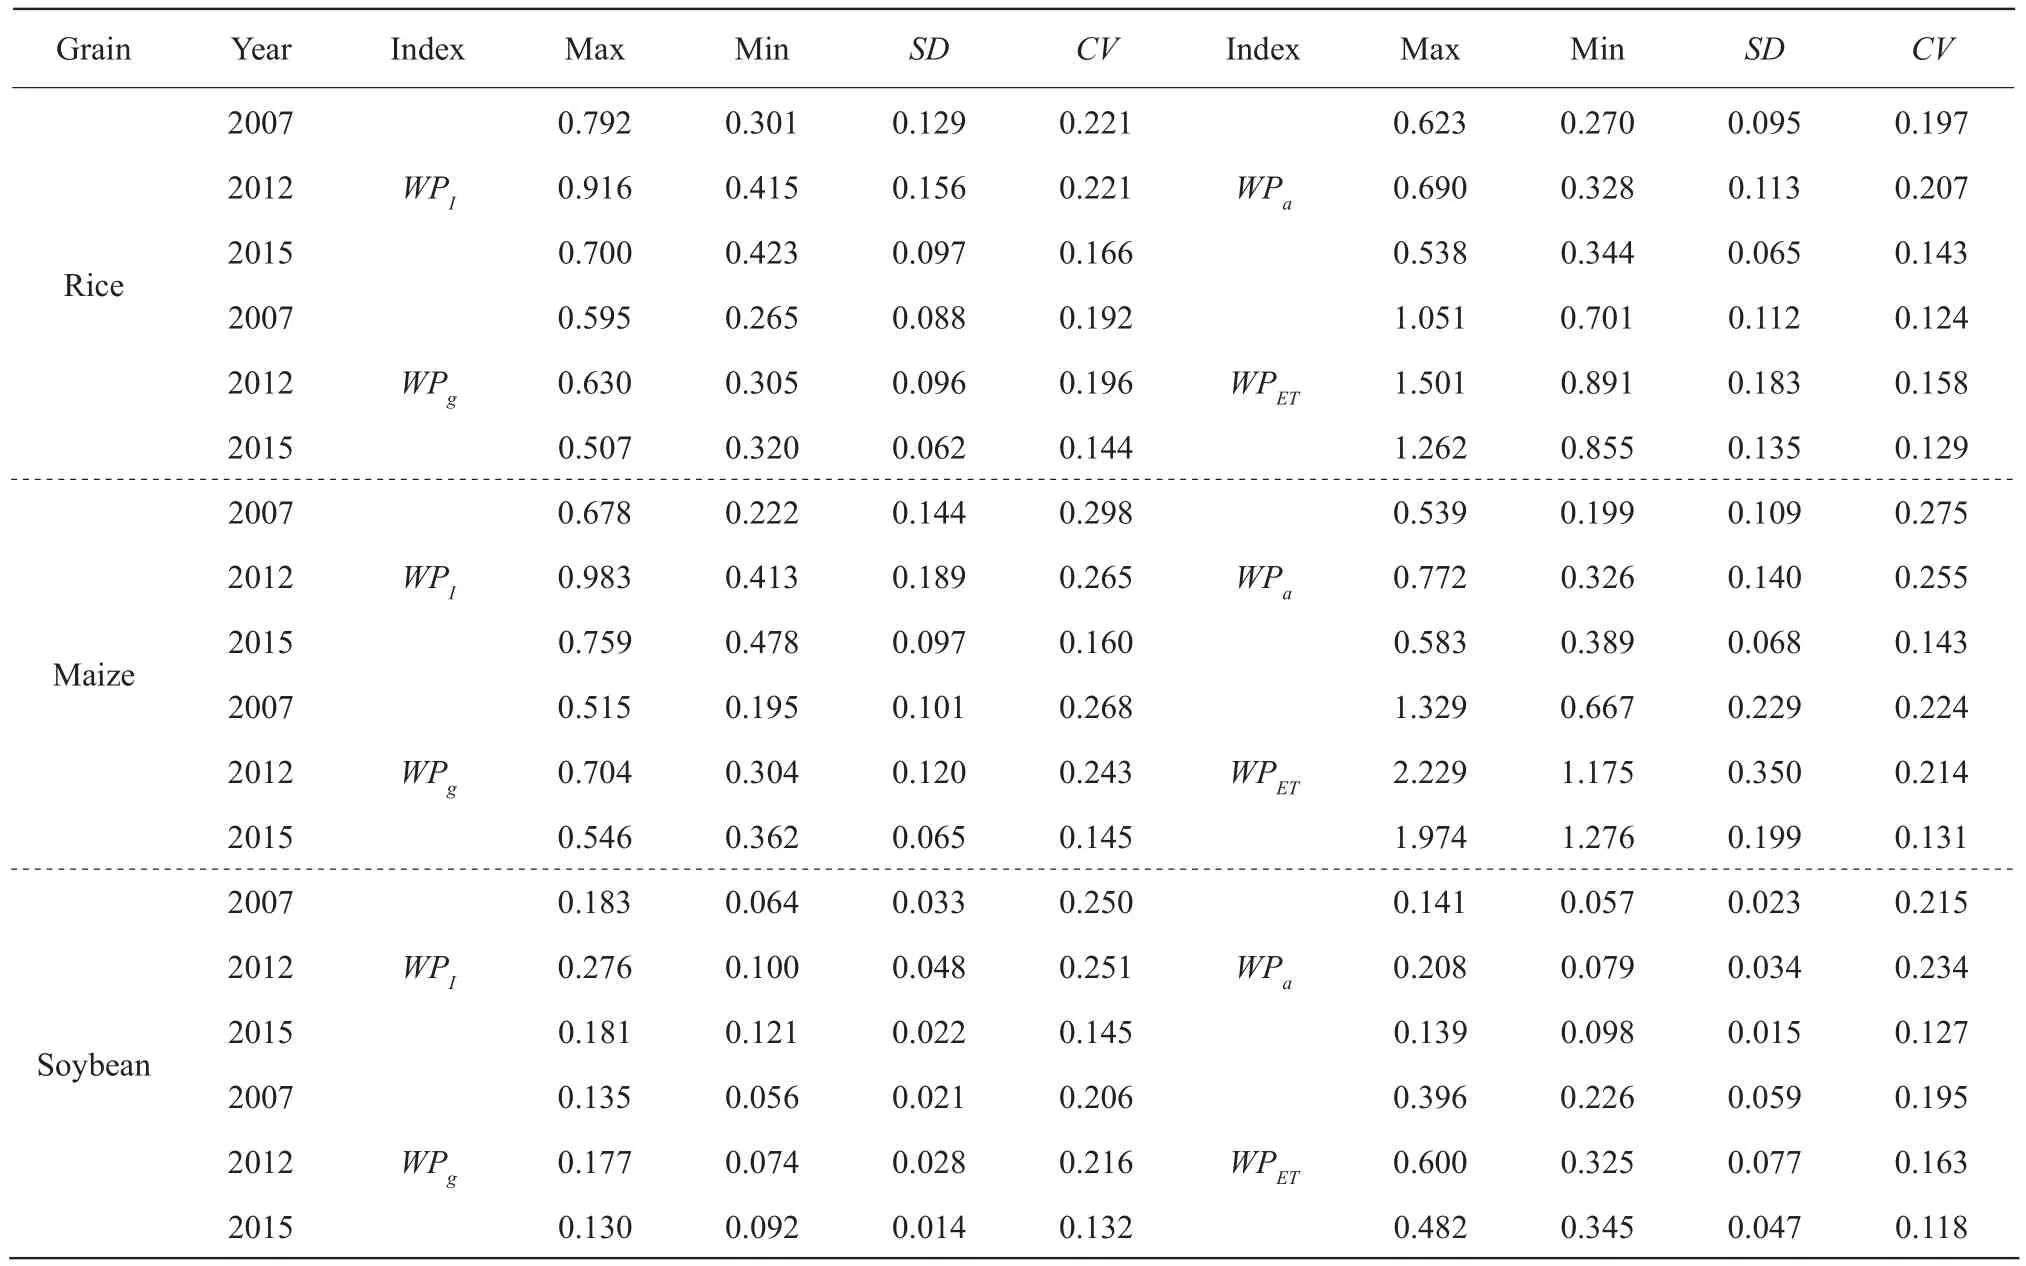
Table 1 Main statistics of four WP indicators in representative years
Fig.3 showed that during the study interval (2007-2015),WPgandWPafor rice had positive average annual rates of change only in the cities of Hegang City,Qitaihe City and Jiamusi City, while the rest of the cities showed negative growth.The annual growth rate ofWPIin 12 cities was between –2.1% and 6.9%.WPETin Daqing City grew the fastest at 4.2% per year, while most other cities grew by 2%.Harbin City, Jixi City, Qitaihe City and Mudanjiang City showed little change, growing by 0.1%, 0.4%, 0.6%and 0.8%, respectively.The annual growth rates of the fourWPs in maize were higher than those in rice, andWPs were positive for all cities except for Mudanjiang City.WPs in Hegang City and Jiamusi City grew relatively rapidly, and all the indices in these two cities showed an annual growth rate of more than 6.5%.The average annual growth rate of maizeWPwas higher than that of rice over the whole study period, which was consistent with the dominant position of maize cultivation in Heilongjiang Province.
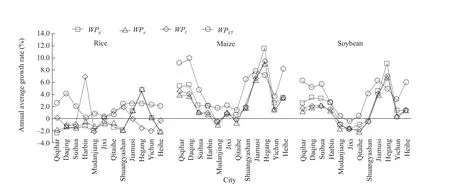
Fig.3 Annual average growth rate of each indicator from 2007 to 2015
Because of the small annual variation of soybean yield per hectare, the annual growth change ofWPin most cities was not obvious.WPI,WPgandWPaof Hegang City increased by 9.1%, 6.7% and 7%,respectively, which were the fastest rates among the cities.The cities with the highest growth rates forWPETwere Qiqihar City and Heihe City, with values of 6.3% and 6%, respectively.
According to the above analysis, the areas with rapid growth ofWPcould be divided into two categories: one included cities with the ability and funding to invest in agricultural production technology and irrigation water management measures, and the other comprised the main grain-producing regions in Heilongjiang Province,where soil, precipitation, temperature and other natural conditions were most suitable for crop growth.
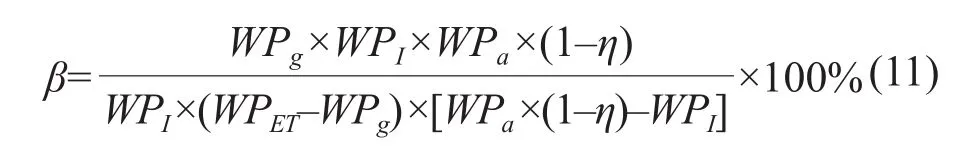
Spatial distribution of city-scaleWP
The maximum and minimum values of the indicators of the three grain crops were different in each year,but the annual average was more stable and better reflected the management level of an irrigation area.WPs of the three grain crops under study are presented in Fig.4.Comparing different grainWPs at the same water input amount, rice and maize had higher values because of their relatively high yields.Thus, water productivity increased with decreasing water input when comparing differentWPindices of different grain crops.
Rice is the most important cereal crop in Heilongjiang Province, which is becoming a national rice basket region due to the superior nutritional quality of the rice, which also has flavors favored by Chinese rice consumers.For rice, highWPs were found in the central and southern regions of Heilongjiang Province and the eastern region, including Harbin City, Suihua City and Shuangyashan City.Harbin City and Suihua City are on the Songnen Plain, and Shuangyashan City is on the Sanjiang Plain.These two plains, possessing relatively favorable biophysical conditions and management practices, registered the highestWPs.Hegang City and Heihe City, which were both insignificant as rice-growing areas, had the lowest riceWPs.
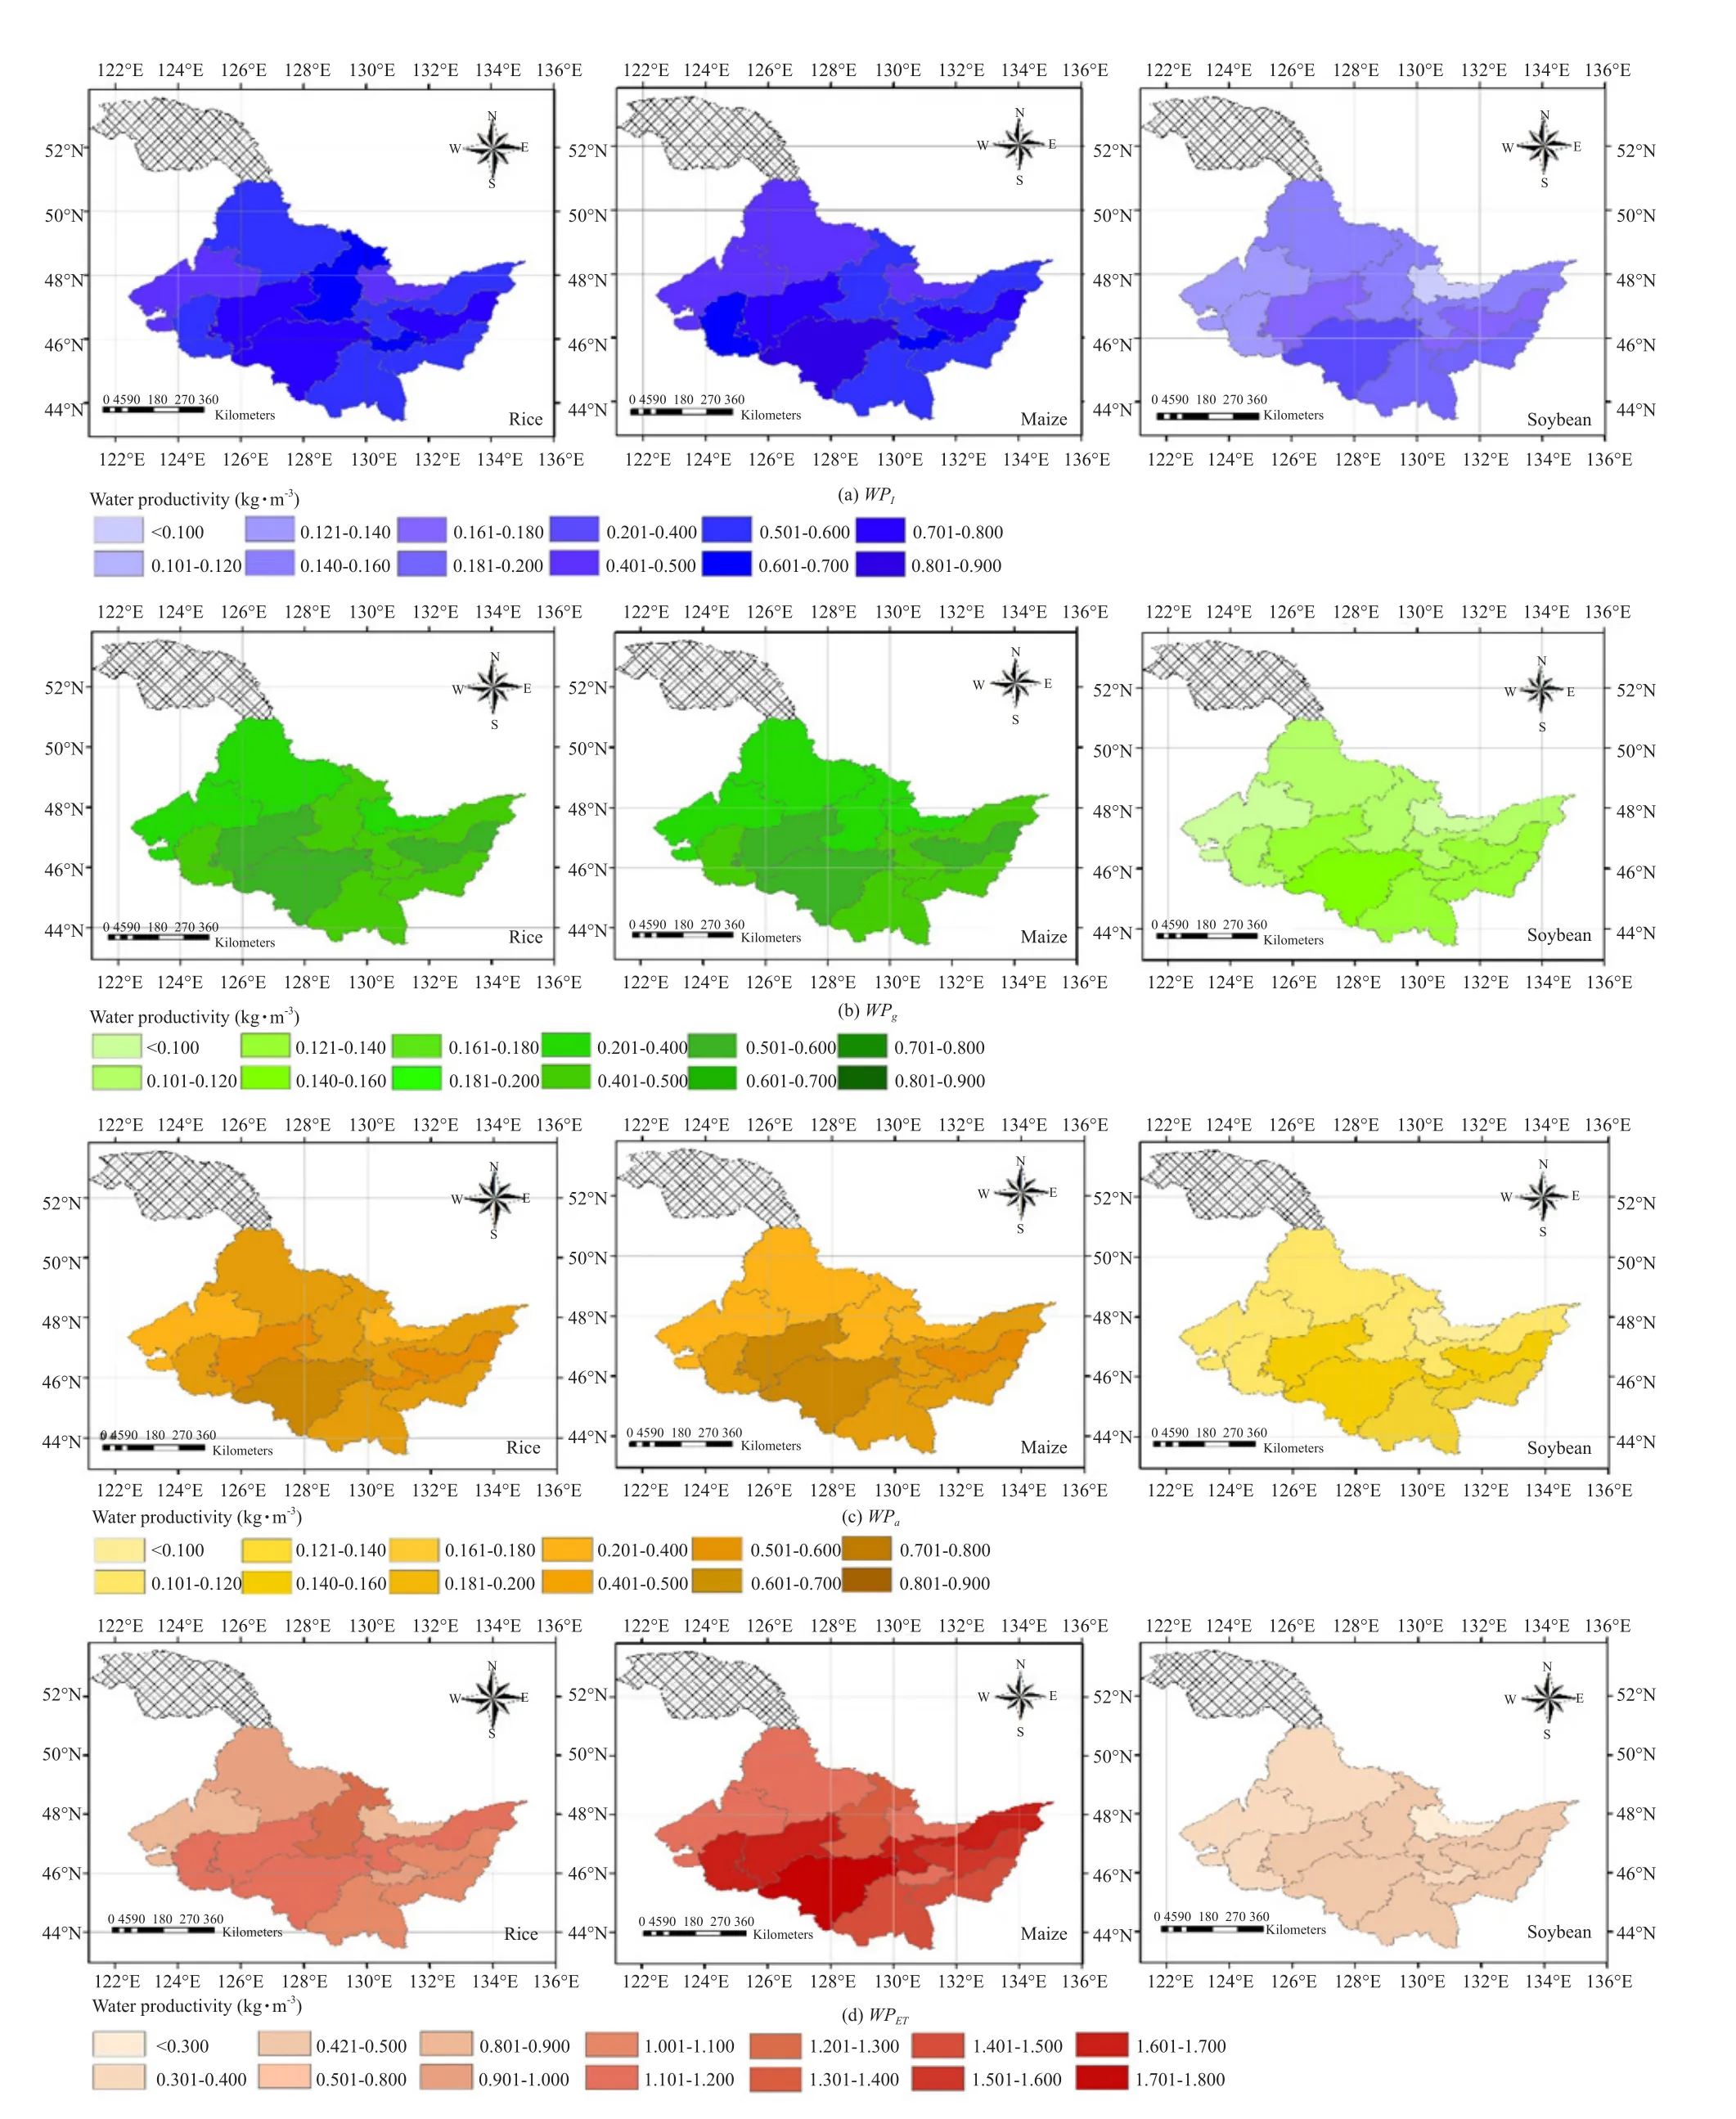
Fig.4 Spatial distribution of water productivity indices in Heilongjiang Province
Maize, the most abundant cereal crop grown in Heilongjiang Province, which accounted for about 40% of the total planted area of food crops, displayed a similar spatial pattern to rice with respect toWPindices, with Harbin City being the highest and Hegang City the lowest.Cities on the Songnen Plain had the largest maize per hectare yield, so the resultingWPs were very high.Since the requirement of maize for water during the growth period was much less than that of rice, the regionalWPETof maize was higher, with values in Suihua City, Jiamusi City and Shuangyashan City of more than 1.5 kg · m-3.
WPs of soybean were not consistent with its total production.Heilongjiang Province was the largest and most important soybean producer in China, but the per hectare yield of soybean was low compared to those of rice and maize, resulting in a lowWP.The spatial pattern showed an apparent descending gradient stretching from southern to northern cities.Compared to those of rice and maize,WPindices for soybean in Heihe City and Qitaihe City achieved a high yield ranking, because the biophysical conditions of Heihe City and Qitaihe City were more suitable for soybean sowing than for other two grains.
From a regional perspective, in summary,WPs of cities on the Songnen Plain (i.e., Harbin City, Suihua City and Daqing City) were consistently higher.These cities' natural conditions and water resources were suitable for crop growth, especially for rice and maize;these cities were not major soybean producers, but with a reasonable level of irrigation, soybeanWPwas also high.Cities with moderate values on Sanjiang Plain mainly planted the high-water-consumption grain crop rice; precipitation was abundant in these areas but relatively concentrated, so it cannot be efficiently used to grow grain.Because growing rice in these areas still required a large amount of irrigation water, the irrigation water grain productivity indicators remained moderate.The lowerWPvalues in the mountainous region of Qitaihe City were due to lower yield, which was mainly caused by higher elevations and lower temperatures.In agricultural areas with a semi-arid climate, such as Qiqihar City, dryness combined with soil and water loss was a major constraint for agricultural production.In that reclamation area, sandy soil texture, drought and windy climate resulted in high in filtration and low irrigation water-use efficiency.Hence,WPwas lower as a result of higher application of irrigation water.
Water utilization evaluation of grain production
Potential enhancement of regional water-use efficiency
Given the changing agricultural management and climatic conditions, identifying the areas with the highest potential for improvedWPmanagement was very important.Eq.(13) was used to calculate the consistency (C) of percent chance of improvement inWPs in the rice-, maize- and soybean-growing districts of cities.
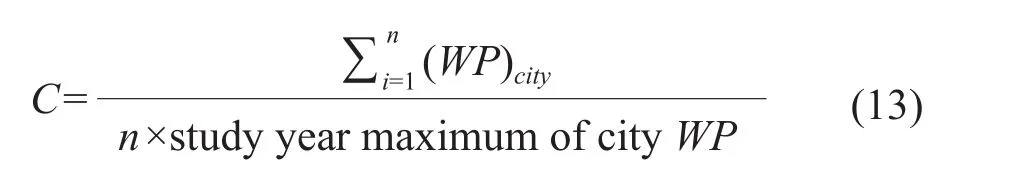
Where,nwas number of study years (n=9).This process scales the cumulativeWPfor each city by nine times the maximum for each city expressed as a percentage.The consistency values (C) were calculated and are listed in Table 2.
Table 2 showed that the consistency ofWPI,WPgandWPafor rice were similar in each city, with values between 47% and 85%, whileWPETfluctuated between 56% and 81%.The variation for maize was similar to that for rice; the average consistency value ofWPETranged from 50% to 77%, and other three indicators were 40%-84%.The difference among the four indices of soybean was small, and all were 47%-80%.Cvalues of soybean were lower than those of rice and maize in each city, indicating that the soybean crop had a high potential for improving water-use efficiency during the growing period.
Cities with high meanWPand low consistency had the highest potential for improvingWP.Table 2 showed that the consistency indicators for fourWPs of three crops were lowest in Hegang City, indicating a high potential for the promotion ofWPthere.The consistency values in Harbin City and Suihua City were higher, indicating that irrigation management and water resource allocation methods were better optimized in those cities.
Analysis of regional water consumption based onWP
Using Eqs.(9)-(11), three indicators were analyzed to describe water resource utilization and efficiency improvement state.These three indicators could be used to explore ways to improve the water-use efficiency of grain production in different irrigated regions.These results are shown in Figs.5 and 6.
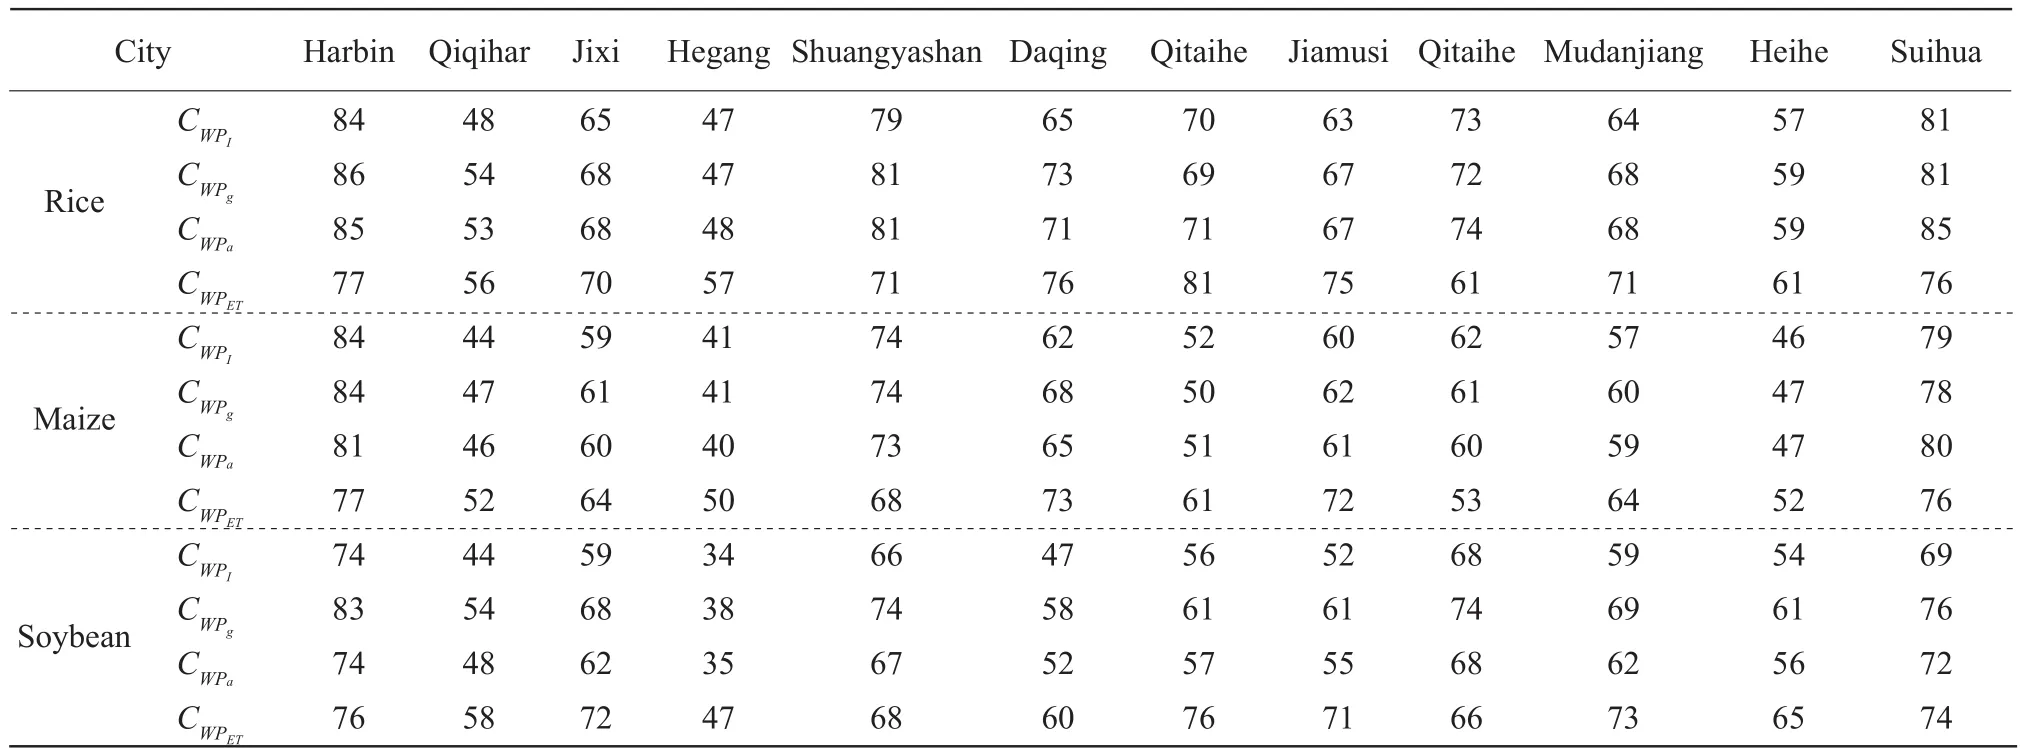
Table 2 Calculated consistency values of WP indices by city (%)
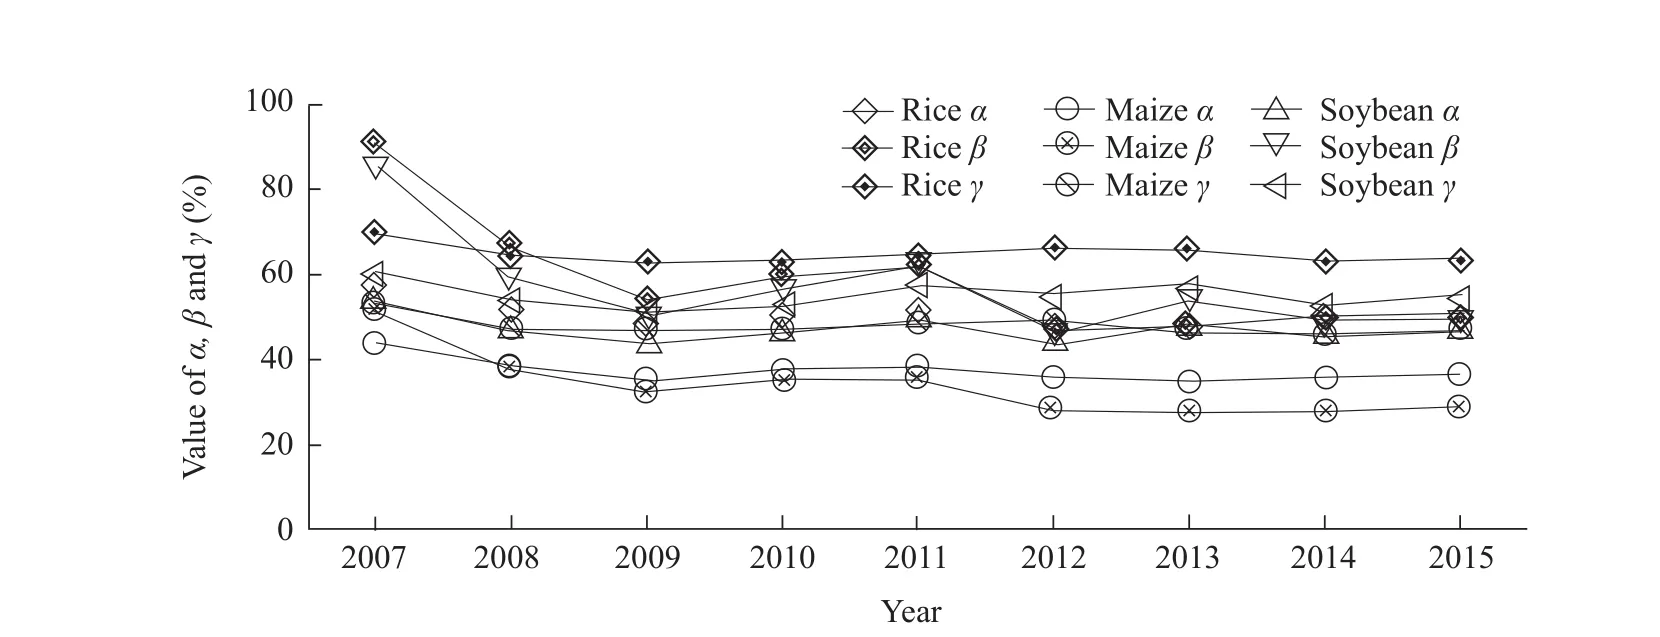
Fig.5 Provincial α, β and γ from 2007 to 2015

Fig.6 Values of indicators α, β and γ in 12 cities from 2007 to 2015
(1) Utilization rate of generalized agricultural water resources
These results showed thatαvalues of rice, maize and soybean in irrigated farmland during the study period were 50.4%, 37.0% and 46.9%, respectively.The effective utilization rate of generalized agricultural water resources for rice in the irrigated land of Heilongjiang Province was just over 50.0%, while those for maize and soybean were lower.αvalues of the three crops in each city fluctuated, but overall, the value ofαwas lower in 2015 than that in 2007.
The spatial distribution analysis revealed that the annualαof rice, maize and soybean in Qitaihe City were the highest in the province.The values of riceαin Harbin City and Shuangyashan City were both approximately 50.0%.The water-saving irrigation technology in Harbin City was of very high quality,and Qitaihe City had superior management of irrigation water input.In Shuangyashan City, irrigation investment funds accounted for 60.0% of the total water conservation construction, and rainfall was abundant.The above factors led to the higherαvalues in these three cities.Some areas with lowαvalues also had abundant precipitation, but poor agricultural water management resulted in a substantial waste of irrigation water resources and caused the lowαindices in these cities.Values ofαfor maize and soybean were between 20.0% and 40.0%, indicating that the irrigation efficiency of these two crops urgently needed improvement and that emphasis should be placed on reducing the water supply from source irrigation.
(2) Rate of irrigation water-saving potential in the total generalized agricultural water resources
Indicatorβwas calculated byWPg,WPI,WPa,WPETand the provincial average value ofη.The results of this calculation showed that the provincial value ofβfor rice decreased from 90.2% to 50.9%, whileβvalue for soybean decreased from 85.5% to 50.5%.Large fluctuations were observed in the annual values, likely because the precipitation and the effective precipitation occurred during the growth season fluctuated in each year.βvalue for maize decreased steadily from 51.9%to 29.0% without major fluctuations during the study period.The utilization efficiency of irrigation water was greatly influenced by irrigation construction investment and irrigation technology.As the utilization coefficient of irrigation water increased with time, the total irrigation water amount decreased, soβvalues of grain crops in recent years showed a significantly decreasing trend.The annual averageβvalues of the provincial irrigation area were 58.7% for rice, 34.0%for maize and 57.1% for soybean, indicating that in the water resources that were not fully utilized by rice and soybean crops, the proportion of irrigated water was nearly 60.0%, higher than that of precipitation.The lowerβfor maize indicated that the utilization rate of irrigation water was better for maize crops.
At the city scale, seven cities showed downward trends inβvalue, while the remaining five showed upward trends.The annual rate of decrease inβvalue of all the three crops in Mudanjiang City reached more than 5.5%, close to the average for the province.βof rice in Hegang City decreased faster than those of maize and soybean, while in Daqing City,βof soybean decreased more than those of rice and maize.In other cities, the differences in the rate ofβchange between the three types of grain crop were smaller.In the spatial analysis, regions with higherβwere mostly distributed in the western semi-arid and eastern parts of the province.From 2007 to 2008, the western semiarid and eastern regions had higherβvalues.The highβin the western region was mainly due to reduced rainfall, which caused a high degree of precipitation utilization by crops because almost all precipitation was effective precipitation.In other words, the gross inflow water resources that were not used by crops primarily consisted of irrigation water, so these areas had higherβvalues.Measures for improvingWPin these regions should include the adoption of advanced water-saving irrigation technology to decrease conveyance water loss and the total irrigation diversion.Though precipitation (P) and effective precipitation (Pe) was high during the growth period of the grain crops, irrigation water waste was still a lot,the irrigatedWPindices in the cities in the eastern part of the province were low.
(3) Index for urgency of reducing irrigation water use
Overall, the provincial irrigation waterγvalue was less than 100%, which indicated inefficient use of water resources.Thus, reducing the water resources used for irrigation would be appropriate.Most cityscale values ofβwere less than 50.0%, meaning that half of the irrigation water could not be effectively used by grain crops, resulting in a great waste of water resources.The values ofγin Harbin City, Shuangyashan City and Qitaihe City were the highest;althoughγvalues in these cities were less than 100%their irrigation water control was better than that of other cities, reflecting a higher management level.Because rice was a paddy-field crop, its irrigation water demand was higher and the values ofγwas much higher than those of maize and soybean; thus,irrigation water for rice should be properly controlled.
According to Figs.4 and 6, the cities with highWPs were concentrated in the southern and eastern areas of Heilongjiang Province.The values ofαandβin Harbin City, Shuangyashan City and Qitaihe City were close to the provincial average, while theirγvalues were far higher than those of other cities.Water supply and demand in these areas were more reasonable than in other regions, so the most important factor in raisingWPwould be to increase crop yields.In some areas with lowαandβbut higherγ, such as Hegang City,WPwas low; to raiseWPthere, the amount of irrigation water should be reduced while also improving crop yields.In cities with all three indices low, such as Qitaihe City,WPindices were not only determined by water resources but also by crop varieties and yields.Managers could develop targeted irrigation programs according to the different wateruse efficiencies of different crops.
Conclusions
To understand water productivity (WP) in irrigated cropland, this work contributed a collection of actual water input data, a quantification ofWPin Heilongjiang Province from four perspectives, a quantitative assessment of the temporal and spatial variation inWPindices, and a discussion of the implications of the grain-water relationship.The conclusions were as below.
(1) The values ofWPin Heilongjiang Province first increased and then decreased but showed an overall increase from 2007 to 2012.The trends of the annual growth rates of maize and soybean WP indices were similar and positive for most cities, while the annual growth rate of riceWPwas low and negative for most cities.WPshowed spatial differences among the irrigated areas in Heilongjiang Province, and the causes of these differences were closely related to changes in grain yield and the total irrigation water consumption.
(2) Spatially, the cities with highWPs tended to be distributed in the southwestern region and the eastern region, whileWPindices in the northern region were lower.Over time, the spatial differences inWPamong cities in the province were gradually decreasing.An analysis of the relationships among the four indicators of grain production water evaluation revealed that more than half of the inflow water was not being used effectively by crops.As the provincial irrigation water-use coefficient increased and irrigation wateruse potential decreased over time, irrigation water-use efficiency generally showed a rising trend.However,the efficiency of irrigation water use in each region was still at a relatively low level.
(3) The key to improvingWPwas to control irrigation water input and improve irrigation management.From the perspective of grain cultivation, the maize sowing area in Heilongjiang Province was relatively large, but the utilization efficiency of water resources was not high during the growth period.Due to low yield, soybeanWPwas low.To improve the wateruse efficiency of grain production in Heilongjiang Province, it could be recommended that managers adjusted crop irrigation system, controlled rice irrigation water quantity and actively increased the yield per unit area of soybean.
Amarasingha R P R K, Suriyagoda L D B, Marambe B,et al.2015.Simulation of crop and water productivity for rice (Oryza sativaL.)using APSIM under diverse agro-climatic conditions and water management techniques in Sri Lanka.Agric Water Manag, 160:132-143.
Brown L R, Halweil B.1998.China‘s water shortage could shake world foods security.World Watch, 11(4): 10-21.
Cai X L, Sharma B R.2010.Integrating remote sensing, census and weather data for an assessment of rice yield, water consumption and water productivity in the Indo-Gangetic river basin.Agric Water Manag, 97(2): 309-316.
Campos I, Neale C M U, Arkebauer T J,et al.2017.Water productivity and crop yield: a simplified remote sensing driven operational approach.Agric For Meteorol, doi:10.1016/j.agrformet.2017.07.018
Cao X C, Wang Y B, Wu P T,et al.2015.Water productivity evaluation for grain crops in irrigated regions of China.Ecol Indic, 55:107-117.
Chapagain A K , Hoekstra A Y.2004.Water footprint of nations,vol.1.main report.Value of Water Research Report Series 16, UNESCOIHE, Delft, the Netherlands.
Djaman K, Mel V C, Balde A B,et al.2016.Evapotranspiration,irrigation water requirement, and water productivity of rice (Oryza sativaL.) in the Sahelian environment.Paddy Water Environ, 15(3):469-482.
D?ll P, Siebert S.2002.Global modeling of irrigation water requirements.Water Resour Res, 38(4): 1037-1048.
Food and Agriculture Organization (FAO).1994.The state of food and agriculture 1993.Food and Agriculture Organization, Rome, Italy.
Garg K K , Bharati L, Gaur A,et al.2012.Spatial mapping of agricultural water productivity using the swat model in Upper Bhima catchment, India.Irrig Drain, 61(1): 60-79.
Howell T A, Evett S R, Tolk J A,et al.2015.Evapotranspiration, water productivity and crop coefficients for irrigated sun flower in the U.S.Southern High Plains.Agric Water Manag, 162: 33-46.
Hu Q, Wu W B, Song Q,et al.2017.How do temporal and spectral features matter in crop classification in Heilongjiang Province,China?J Integr Agric, 16(2): 324-336.
Huang F, Li B G.2010.Assessing grain crop water productivity of China using a hydro-model-coupled-statistics approach.Part II:Application in breadbasket basins of China.Agric Water Manag,97(9): 1259-1268.
Igbadun H E, Mahoo H F, Tarimo A K P R,et al.2006.Crop water productivity of an irrigated maize crop in Mkoji sub-catchment of the Great Ruaha River Basin, Tanzania.Agric Water Manag, 85 (1-2):141-150.
Jensen M E.1968.Chapter 1:Water consumption by agricultural plants.Plant Water Consumption and Response.New York,U.S.A.
Kang S Z, Shi W, Zhang J.2000.An improved water-use efficiency for maize grown under regulated deficit irrigation.Field Crops Res, 67(3): 207-214.
Li B G, Huang F.2010.Trends in China's agricultural water use during recent decade using the green and blue water approach.Advan Water Sci, 21(4): 575-583.(in chinese)
Li J, Zhu T, Mao X M,et al.2016.Modeling crop water consumption and water productivity in the middle reaches of Heihe City River Basin.Comput Electron Agric, 123: 242-255.
Liu J G, Wiberg D, Zehnder A J B,et al.2007.Modeling the role of irrigation in winter wheat yield, crop water productivity, and production in China.Irrig Sci, 26(1): 21-33.
Molden D.1997.Accounting for the water use and productivity.SWIM.paper 1.International Irrigation Management Institute, Columbo, Sri Lanka.
Perry C, Steduto P, Allen R G,et al.2009.Increasing productivity in irrigated agriculture: agronomic constraints and hydrological realities.Agric Water Manag, 96(11): 1517-1524.
Phogat V, Skewes M A, McCarthy M G,et al.2017.Evaluation of crop coefficients, water productivity, and water balance components for wine grapes irrigated at different deficit levels by a sub-surface drip.Agric Water Manag, 180: 22-34.
Playán E, Mateos L.2006.Modernization and optimization of irrigation systems to increase water productivity.Agric Water Manag, 80(1):100-116.
Rosegrant M W, Cai X M, Cline S A.2002.Global water outlook to 2025 averting an impending crisis.In: a 2020 vision for food,agriculture and the environment initiative.International Food Policy Research Institute, Washington, DC, U.S.A.
Sharma V, Irmak S, Djaman K,et al.2016.Large scale spatial and temporal variability in evapotranspiration, crop water use efficiency, and evapotranspiration water use efficiency of irrigated and rainfed maize and soybean.J Irrig Drain Eng, 142: 4015063.doi:10.1061/(ASCE)IR.1943-4774.0000985
Wang Y B, Wu P T, Engel B A,et al.2014.Application of water footprint combined with a unified virtual crop pattern to evaluate crop water productivity in grain production in China.Sci Total Environ, 497-498: 1-9.
Yan N, Wu B F.2014.Integrated spatial-temporal analysis of crop water productivity of winter wheat in Hai Basin.Agric Water Manag, 133(1): 24-33.
Zwart S J, Bastiaanssen W G M, de Fraiture C,et al.2010.A global benchmark map of water productivity for rainfed and irrigated wheat.Agric Water Manag, 97(10): 1617-1627.
Zwart S J, Bastiaanssen W G M, de Fraiture C,et al.2010.WATPRO:a remote sensing based model for mapping water productivity of wheat.Agric Water Manag, 97(10): 1628-1636.
Zwart S J, Bastiaanssen W G M.2004.Review of measured crop water productivity values for irrigated wheat, rice, cotton and maize.Agric Water Manag, 69(2): 115-133.
 Journal of Northeast Agricultural University(English Edition)2018年1期
- Journal of Northeast Agricultural University(English Edition)的其它文章
- Operational Performance Evaluation of Corn Processing Industry Technological Innovation Alliance Based on Survey Data in Heilongjiang Province
- Analysis of Process of Microwave Puffing Blueberry Snacks
- Stability Analysis of a Lignocellulose Degrading Microbial Consortium
- Pharmacokinetics of Milbemycin Oxime in Dogs Following Its Intravenous and Oral Administration
- Comparative Research on Facultative Anaerobic Cellulose Decomposing Bacteria Screened from Soil and Rumen Content and Diet of Dairy Cow
- Effect of Mineral and Vitamin Supplementation on Performance and Haemotological Values in Broilers