
Impact of the winter North Pacific Oscillation on the Surface Air Tem perature over Eurasia and North America:Sensitivity to the Index definition
2018-04-08 10:59:13ShangfengCHENandLinyeSONG
Advances in Atmospheric Sciences 2018年6期
Shangfeng CHEN and Linye SONG
1Center for Monsoon System Research,Institute of Atmospheric Physics,Chinese Academy of Sciences,Beijing 100029,China
2Institute of Urban Meteorology,China Meteorological Administration,Beijing 100089,China
1. Introduction
The North Pacific Oscillation(NPO)is a crucial atmospheric internal variability over the extratropical North Pacific(Walker and Bliss,1932;Wallace and Gutzler,1981).The spatial distribution of the NPO is characterized by an oscillation in sea level pressure(SLP)and geopotential height anomalies between the midlatitudes and subtropics of the North Pacific(Kutzbach,1970;Rogers,1981;Linkin and Nigam,2008).Previous studies have demonstrated that change in the NPO is closely connected with the anomalous westerly winds and storm track over the North Pacific extratropics(Rogers,1981;Linkin and Nigam,2008).
Studies have found that the weather and climate over the North Pacific,Eurasian continent,North America,and the Southern Hemisphere can be influenced by the NPO(Hameed and Pittalwala,1991;Li and Li,2000;Guo and Sun,2004;Wang et al.,2007a,2007b;Zhou et al.,2008;Yu and Kim,2011;Baxter and Nigam,2015;Chen et al.,2015a;Song et al.,2016).For instance,Guo and Sun(2004)suggested that the East Asian winter monsoon activity,surface air temperature(SAT)anomalies over China,and precipitation over the middle and lower reaches of the Yangtze River and South China are significantly impacted by the NPO.Wang et al.(2007b)also indicated that the NPO has a pronounced influenc on the East Asian winter monsoon activity and SAT variations over East Asia.Yan et al.(2005)reported that NPO variation is significantly correlated with the summer precipitation variation over China on the interdecadal timescale.Linkin and Nigam(2008)demonstrated that SAT and precipitation anomalies over North America are significantly influenced by the winter NPO.Song et al.(2016)showed that the winter NPO can exert a notable influence on the follow ing Australian spring rainfall variation through air–sea interaction in the tropical Pacific.Several previous studies have demonstrated that the winter NPO is an important extratropical factor in triggering the outbreak of an El Nio event in the follow ing winter through the seasonal foot printing mechanism(Vimont et al.,2001,2003a,2003b;Alexander et al.,2010;Chen et al.,2013).
Several different ways were employed to de fine the NPO index in previous studies.For example,in Wallace and Gutzler(1981)the NPO index was defined as the standardized SLP anomaly difference between two grid points,i.e.,(25°N,165°E)and(65°N,170°E).By contrast,in Guo and Sun(2004)the NPO was defined as the region-averaged SLP anomaly difference between two selected areas,i.e.,(50°–65°N,130°–170°W)and(25°–40°N,130°E–170°W).In addition,several studies have employed the empirical orthogonal function(EOF)technique to de fine the NPO index.For instance,in Linkin and Nigam(2008),Yu and Kim(2011)and Wang et al.(2007b)the NPO index was defined as the principal component time series corresponding to the second EOF mode of SLP anomalies over the North Pacific.Note that the regions selected for the EOF analysis were different among these studies.
A recent study reported that the influenc of the winter NPO on the following winter’s ENSO activity is sensitive to the definition of the NPO index(Chen and Wu,2017).The study found that a significant NPO–El Nio connection can only be obtained when the NPO-associated cyclonic anomalies in the North Pacific subtropics extend to near-equatorial areas.Hence,a question naturally arises as to whether the influence of the winter NPO on the SAT variations over Eurasia and North America is also sensitive to the definition of the NPO index.With this in mind,the primary goal of the present study is to examine the sensitivity of the influenc of the winter NPO on the Eurasian and North American SAT to different de fi nitions of the NPO index.
The rest of the paper is arranged as follows:section 2 describes the data and methods;section 3 compares different NPO indices and their impacts on the Eurasian and North American SAT;section 4 discusses our fi ndings;and section 5 provides a summary.
2. Data and methods
This study uses the monthly mean horizontal winds,SLP,and daily mean geopotential height from the ERA-Interim(Dee et al.,2011).The ERA-Interim dataset is available from 1979 to the present day and has a horizontal resolution of 1.5°×1.5°.The daily mean geopotential height is used to calculate the synoptic-scale eddy(storm track).Also employed is the monthly mean SAT from the University of Delaware(Willmott and Matsuura,2001).This SAT dataset is available from 1900 to 2014 and has a horizontal resolution of 0.5°×0.5°.
We compare six NPO indices based on different de fi nitions;one is based on grid-point SLP,two on area-mean SLP,and three on the EOF technique.Detailed de fi nitions are as follows:
(1)Difference in standardized SLP anomalies between(65°N,170°E)and(25°N,165°E),following Wallace and Gutzler(1981).Hereafter,we refer to this index as W 81 for short.Note that Wallace and Gutzler(1981)identified five major teleconnection patterns during boreal winter,one of which represents the NPO.They found a strong negative correlation between centers of action at(65°N,170°E)and(25°N,165°E)in the SLP field,representing the points for the NPO index.
(2)Difference in region-averaged SLP anomalies between(50°–65°N,130°–170°E)and(25°–40°N,130°–170°E),according to Guo and Sun(2004).Hereafter,we refer to this index as G04 for short.
(3)Difference in region-averaged SLP anomalies between(55°–72.5°N,180°–140°W)and(15°–27.5°N,175°E–147.5°W),according to Furtado et al.(2012).Hereafter,we refer to this index as F12 for short.
(4)The principle component(PC)time series corresponding to the second EOF mode of SLP anomalies over(20°–60°N,120°E–80°W),follow ing Yu and Kim(2011).Hereafter,we refer to this index as Y11 for short.
(5)The PC time series corresponding to the second EOF mode of SLP anomalies over(20°–85°N,120°E–120°W),follow ing Linkin and Nigam(2008).Hereafter,we refer to this index as L08 for short.
(6)The PC time series corresponding to the second EOF mode of SLP anomalies over(0°–90°N,100°E–120°W),follow ing Wang et al.(2007b).Hereafter,we refer to this index as W 07 for short.
The method of W 81 was the first proposed and is the easiest way to calculate the NPO index.However,it uses only two grid points,which may bring some problems—especially for low-resolution SLP data.G04 has the potential to partially solve this problem,but it may not capture the spatial distribution well.F12 employs EOF analysis to firstly decide the two loading centers of the NPO.The remaining methods(Y11,L08,W 07),all employ EOF decomposition based on different regions.The EOF method is orthogonal and can capture the spatiotemporal distribution features of SLP anomalies,but using different regions may lead to different behaviors of the NPO.
In this study, the positive NPO phase refers to anomalous positive SLP over the midlatitudes and anomalous negative SLP over the subtropics of the North Pacific. The reverse is true for the negative phase of NPO. The study period is from 1979 to 2014. Statistical significance is estimated based on the two-tailed Student’st-test.
3. Results
3.1. Different NPO indices
Firstly,we compare the boreal winter NPO indices based on the different definitions(Fig.1).Note that 1980 DJF refers to the boreal winter of 1979/80.The six NPO indices in DJF from 1980 to 2015 display significant interannual variation(Fig.1).Large positive values in 1984,1991,2005 and 2011,and extreme negative values in 1983,1992,1998 and 2007,can be captured by the six NPO indices(Fig.1).In contrast,large spreads among the six NPO indices appear during the period from 1993 to 1996.
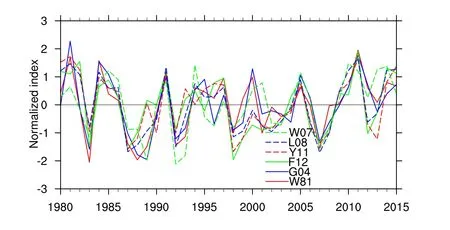
Fig.1. Time series of normalized winter (DJF-averaged) NPO index on the basis of diあerent definitions. Detailed definitions of the NPO indices(i.e.,W 07,L08,Y11,F12,G04 and W 81)are provided in section 2.
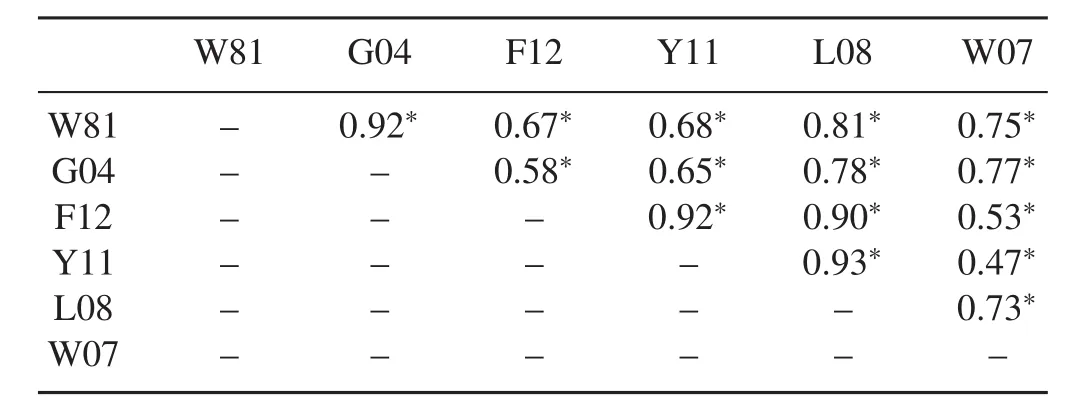
Table 1. Correlation coefficients among the different DJF NPO indices.An asterisk indicates the correlation coefficient is significant at the 95%confidence level.
The correlation coefficients among the different DJF NPO indices are shown in Table 1,all of which are significant at the 95%confidence level according to the Student’st-test.Nevertheless,large spread exists in the correlation between different pairs of DJF NPO indices(Table 1).In particular,the largest correlation is 0.93 between the L08 and Y11 NPO indices.This indicates that the L08 and Y11 NPO indices share about 86%of the common variance.In addition,the correlations between G04 and W 81,Y11 and F12,and L08 and F12,are larger than 0.9.In contrast,the correlations of the W 07 NPO index with the other NPO indices are less than 0.77.Speci fi cally,the correlation coefficient is only 0.47 between the W 07 NPO and Y11 NPO indices.This implies that the W 07 and Y11 NPO indices only share about 22%of their common variance.
We further exam ine the spatial distribution of the NPO related to the six NPO indices.Here,the spatial pattern of the NPO is represented by the SLP anomalies obtained by regression upon the normalized NPO index(Fig.2).A significant meridional dipole SLP anomaly pattern can be observed over the North Pacific for the six NPO indices(Fig.2).However,the strength and location of the negative SLP anomalies over the subtropical North Pacific display significant differences among the six NPO indices(Fig.2).For example,negative SLP anomalies over the subtropical North Pacific related to W 81,G04 and W 07(Figs.2a,b and f)are located more westward compared to those associated with F12,Y11 and L08(Figs.2c–e).Pronounced negative SLP anomalies can be observed over the tropical North Indian Ocean for W 81,G04 and W 07(Figs.2a,b and f).By contrast,the SLP anomalies over the tropical Indian Ocean related to F12,Y11 and L08 are not obvious(Figs.2c,d and e).The amplitude of the negative SLP anomalies related to W 07 over the North Pacific subtropics is the weakest among the six NPO indices(Fig.2).
The positive SLP anomalies over the midlatitudes of the North Pacific also show substantial differences among the six NPO indices.For instance,the centers of the positive SLP anomalies over the North Pacific related to F12,Y11 and L08(Figs.2a,b and f)shift eastward compared to those related to W 81,G04 and W 07(Figs.2c,d and e).In addition,signi ficant and positive SLP anomalies associated with W 81,G04,L08 and W 07 extend westward into the Eurasian continent(Figs.2a,b,e and f).In particular,significant and large positive SLP anomalies can be observed over the Arctic region for the W 07 NPO index.This is likely because the area used for the EOF analysis extends more northward in W 07,which may contain atmospheric variability signals over the high latitudes.
The above analyses show that the structures of the NPO based on different de fi nitions display pronounced differences over the North Pacific.Speci fi cally,the SLP anomalies related to W 07 NPO index show large-scale significant positive anomalies over high latitudes.This implies that W 07 may have a significant correlation with the Arctic Oscillation(AO),which is the dom inant mode of atmospheric variability over the Northern Hem isphere extratropics(Thompson and Wallace,1998;Chen et al.,2013).To con fi rm this speculation,we calculate the correlations of the DJF AO index with the simultaneous DJF NPO indices.Follow ing previous research(e.g.,Chen et al.,2014,2015b),the DJF AO index is defined as the PC time series corresponding to the first EOF mode of anomalous SLP over the extratropical Northern Hem isphere.It is found that the correlation coefficient between the DJF AO index and the DJF W 07 NPO index reaches 0.67,significant at the 99%confidence level according to the Student’st-test.This is because the geographical domain used for the EOF analysis extends more northward in W 07,which may include the atmospheric variability over the high latitudes.By contrast,the correlations of DJF AO with DJF W 81,G04,F12,Y11 and L08 are weak(r=0.23,0.25,0.09,and 0.02,respectively)and do not pass thet-test at the 95%confidence level.This indicates that,when the region over the North Pacific employed in the EOF analysis extends too far north,the second EOF mode of SLP anomalies may not represent the real NPO pattern,but may be a mixture of the NPO and AO.
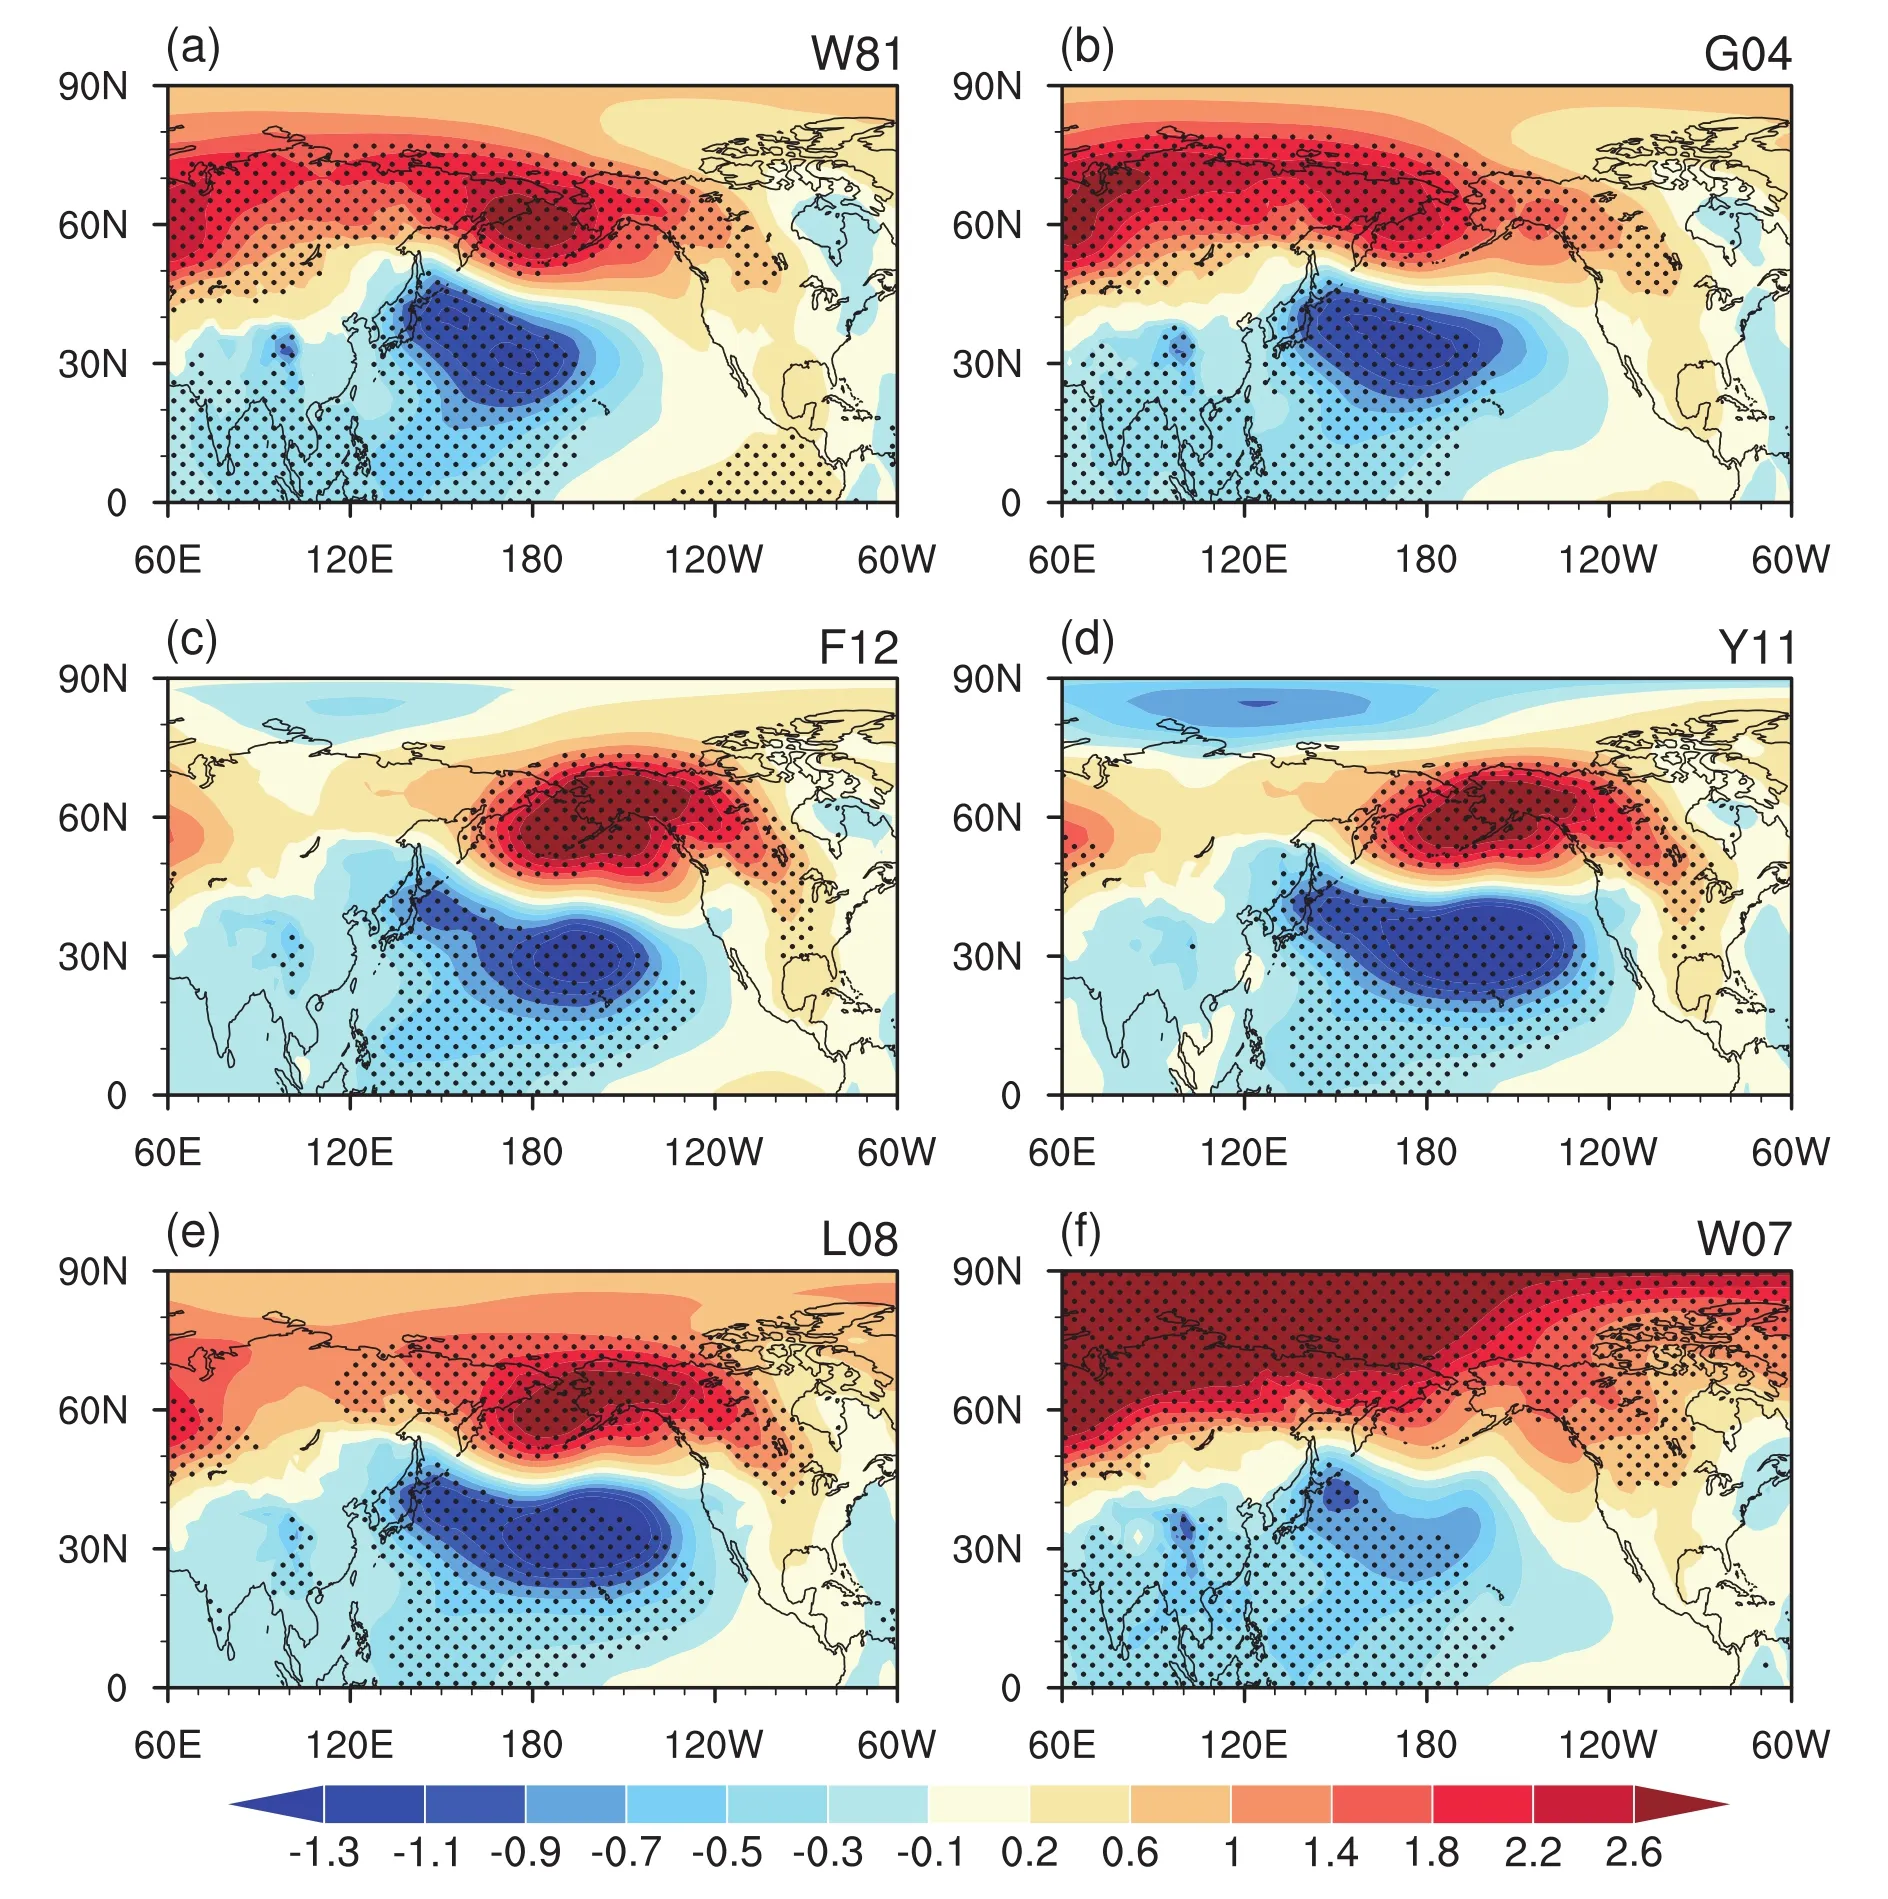
Fig.2. SLP anomalies in DJF regressed on the normalized DJF index for(a)W 81,(b)G04,(c)F12,(d)Y11,(e)L08 and(f)W 07.Those anomalies in(a–f)that are significantly different from zero at the 95%confidence level are stippled.Units:hPa.
3.2. Impact of the NPO on SAT
To exam ine whether the impacts of the winter NPO on the SAT over Eurasia and North America are sensitive to the definition of the NPO index we display the DJF SAT anomalies obtained by regression upon the normalized DJF NPO indices in Fig.3.Substantial differences in SAT anomalies can be observed over the Eurasian continent and North America related to the six NPO indices(Fig.3).significant negative SAT anomalies appear over northwestern Canada,extending southeastward to southeastern America,and significant positive SAT anomalies occur over the Chukotka peninsula,in association with the F12,Y11 and L08 NPO indices(Figs.3–e).By contrast,the SAT anomalies related to W 81,G04 and W 07 over North America and the Chukotka peninsula are relatively weak and insignificant(Figs.3a,b and f).In addition,pronounced negative SAT anomalies related to W 81,G04,L08 and W 07 are apparent over the region to the southwest of Lake Baikal(Figs.3a,b,e and f).In particular,significant negative SAT anomalies can also be observed to the northwest of Lake Baikal related to the W 07 NPO index(Fig.3f).
To quantitatively compare the SAT anomalies over the Eurasian continent and North America,we calculate the SAT anomalies over four selected regions,which are outlined inFig.3.These regions are selected because their SAT anomalies display significant differences among the six NPO indices.The four regions selected for comparison are in the northern part of East Siberia(60°–70°N,80°–120°E),the southern part of East Siberia(45°–55°N,70°–120°E),the Chukotka peninsula(60°–70°N,160°E–170°W),and North America(42°–60°N,82°–110°W).The SAT anomalies averaged over these four selected regions,regressed upon the normalized NPO indices,are presented in Fig.4.
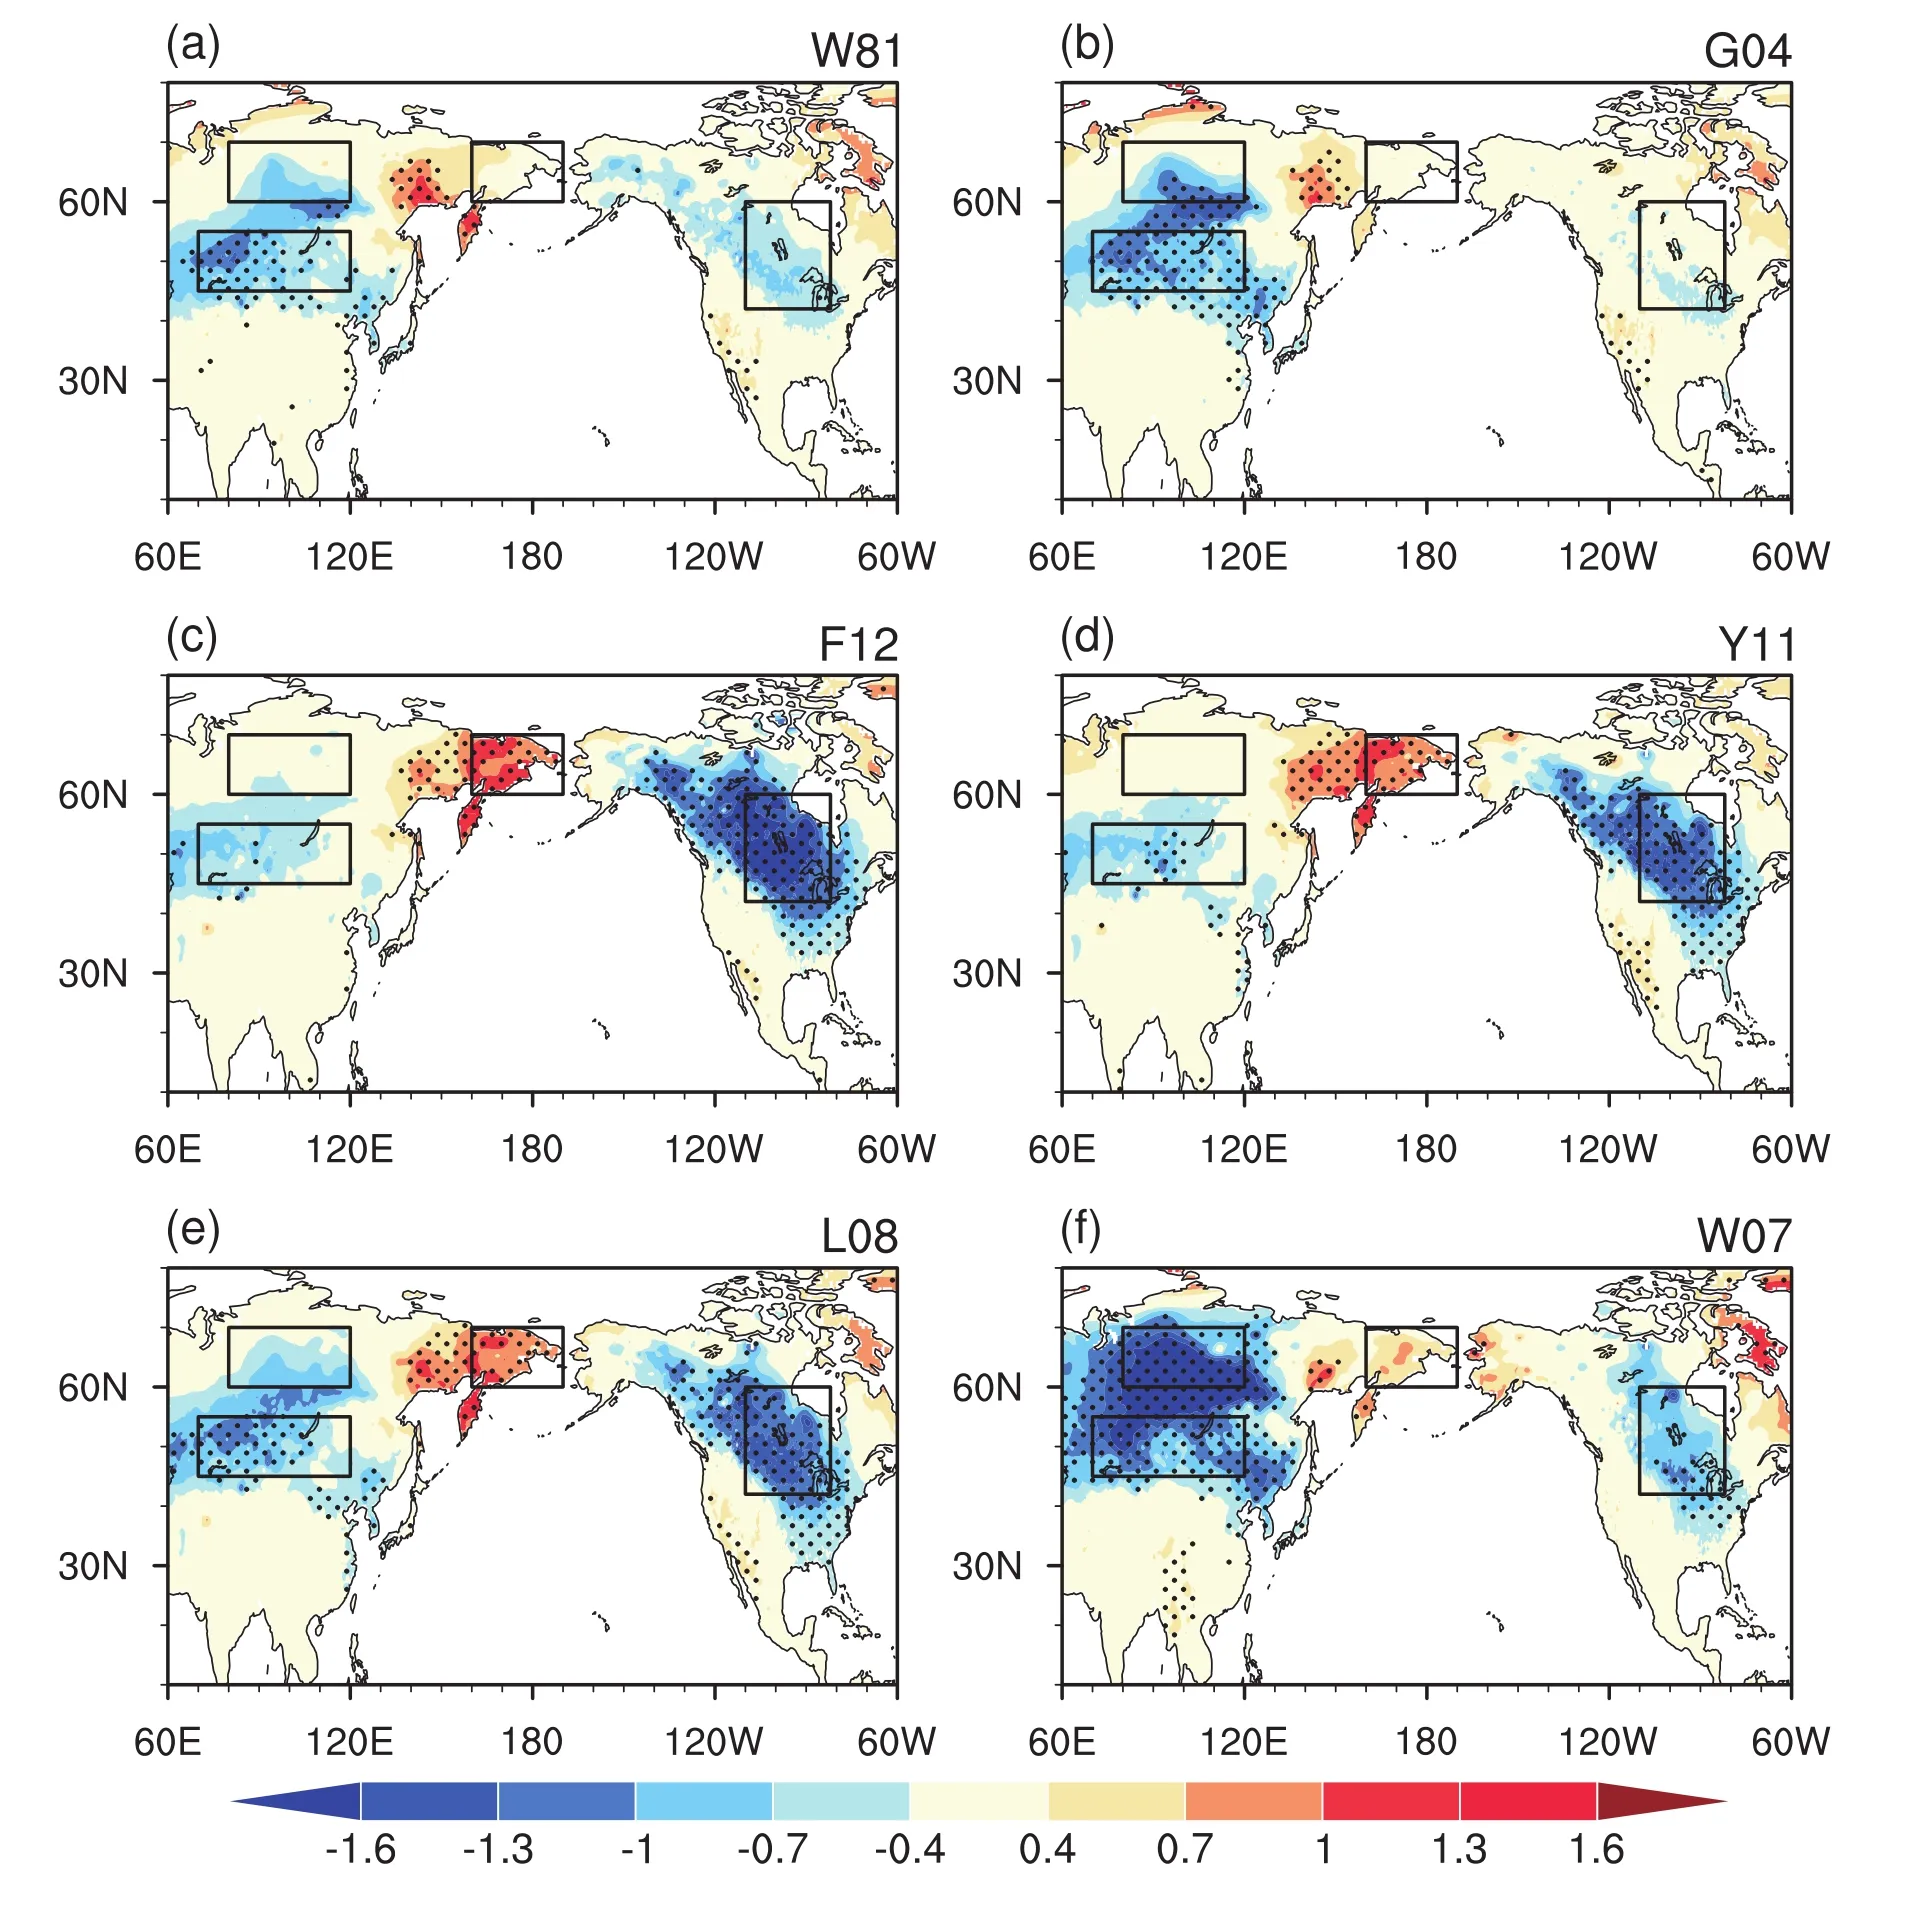
Fig.3. SAT anomalies in DJF regressed on the normalized DJF indices for(a)W 81,(b)G04,(c)F12,(d)Y11,(e)L08 and(f)W 07.Those anomalies in(a–f)that are significantly different from zero at the 95%confidence level are stippled.Units:°C.
In the northern part of East Siberia,negative SAT anomalies related to the W 07 NPO index reach?1.6°C,and these anomalies are significant at the 95%confidence level(Fig.4a).The negative SAT anomalies related to the W 81,G04,F12 and L08 NPO indices are?0.4°C,0.5°C,0.3°C and 0.6°C,which are much weaker in amplitude compared to those related to the W 07 NPO index.In particular,the SAT anomalies related to Y11 are extremely weak and positive.In the southern part of East Siberia,the negative SAT anomalies related to W 81,G04,L08 and W 07 are larger and much more significant compared to those related to F12 and Y11(Fig.4b).In the Chukotka peninsula,the SAT anomalies related to F12,Y11 and L08(W 81,G04 and W 07)are significant(non-significant)at the 95%confidence level,according to the Student’st-test(Fig.4c).In addition,the magnitude of the SAT anomalies related to the F12,Y11 and L08 NPO indices reaches 1°C,0.9°C and 0.85°C,respectively,which are much larger than those related to W 81,G04 and W 07(Fig.4c).In North America,the negative SAT anomalies related to F12,Y11 and L08 are larger and more significant than those related to the other three indices(Fig.4d).For example,the amplitude of the negative SAT related to the F12 NPO index reaches?1.5°C.By contrast,the amplitude of the SAT anomalies related to the G04 NPO index is only around?0.3°C.The above analyses strongly indicate that the influences of the NPO on the SAT over the Eurasian continent and North America are sensitive to the definition of the NPO index.
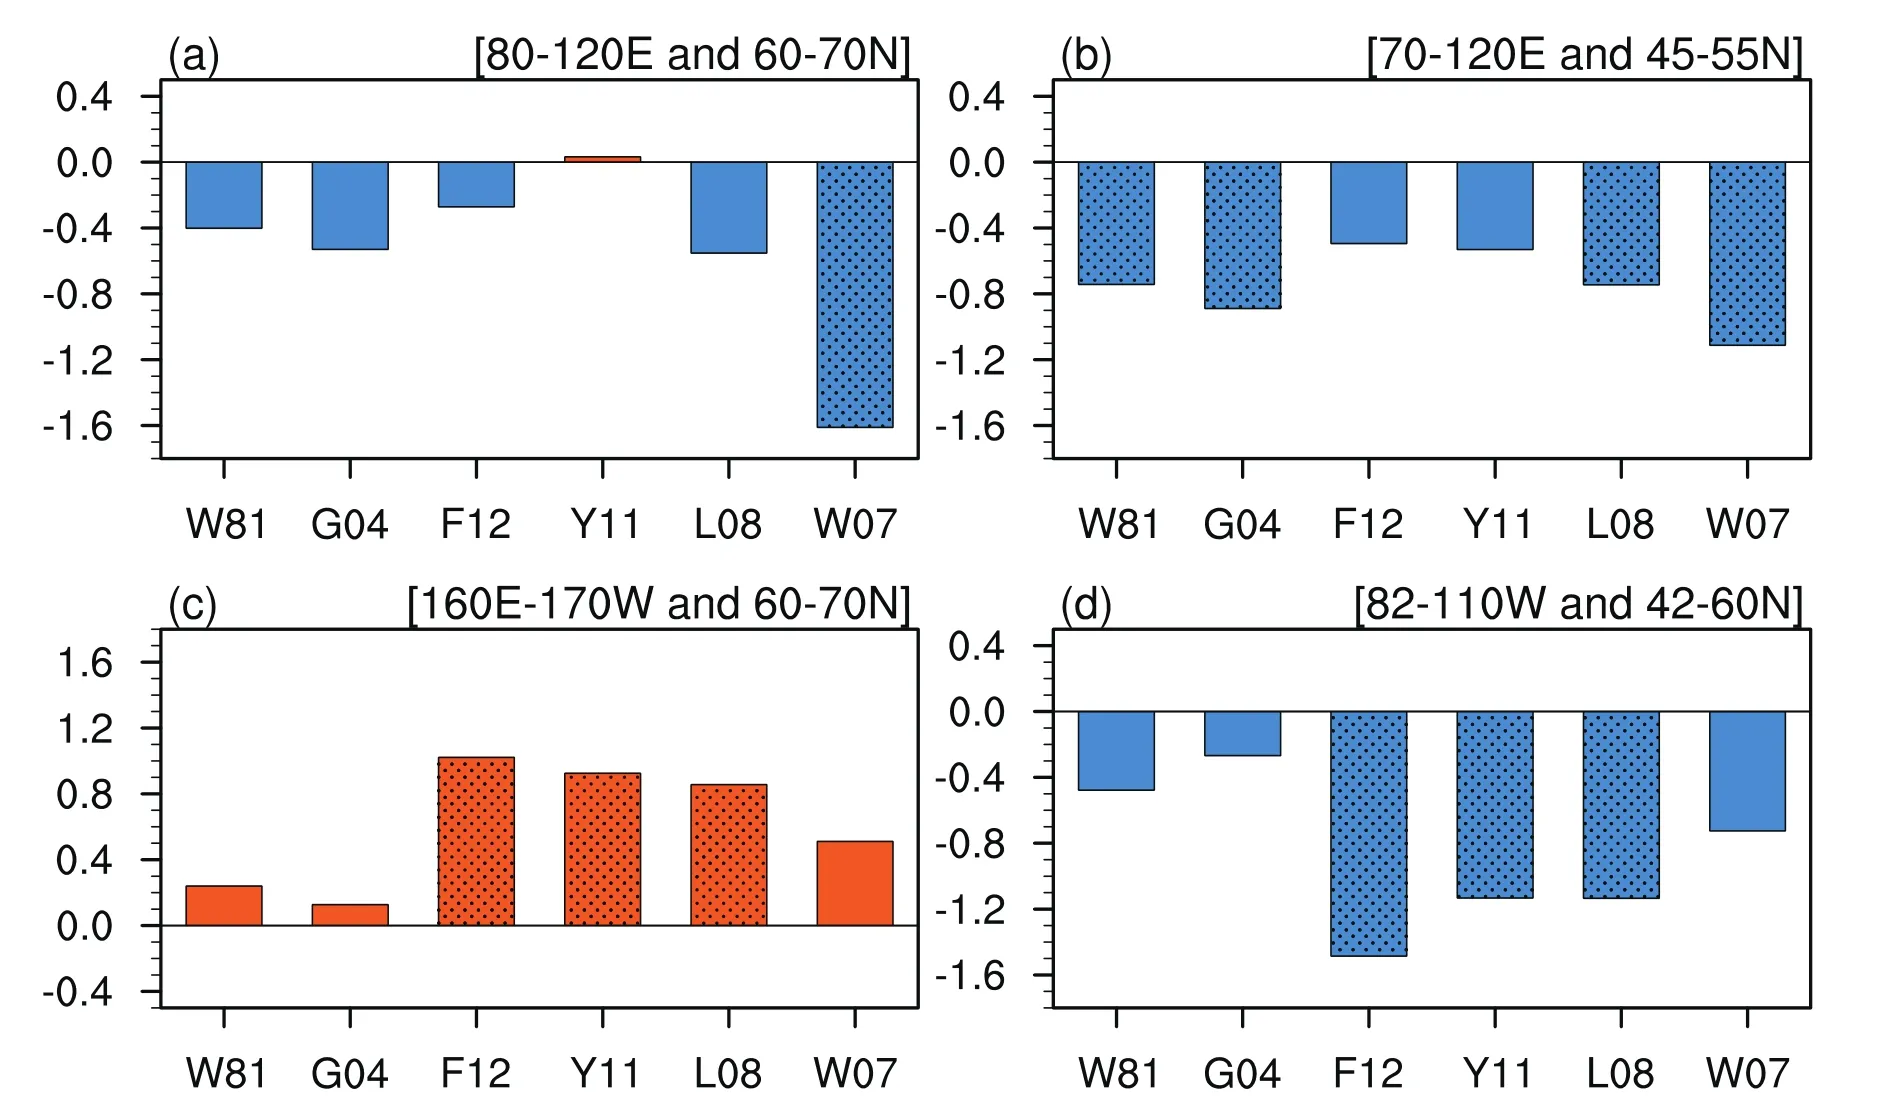
Fig.4. Anomalies of DJF SAT(units:°C)averaged over(a)(60°–70°N,80°–120°E),(b)(45°–55°N,70°–120°E),(c)(60°–70°N,160°E–170°W)and(d)(42°–60°N,82°–110°W)regressed on the normalized W 81,G04,FLA12,Y11,L08 and W 07 NPO indices.Stippling denotes SAT anomalies that are significantly different from zero at the 95%confidence level.
But why is the influenc of the NPO on the SAT sensitive to its definition?One possibility is that it may be attributable to change in the structure of atmospheric circulation anomalies related to the different NPO de fi nitions.To con fi rm this assertion,we compare the spatial structures of DJF 850-hPa winds anomalies obtained by regression upon the different NPO indices(Fig.5).A significant meridional dipole atmospheric circulation anomaly can be seen over the North Pacific related to the six NPO indices,with an anomalous cyclone over the subtropics and an anomalous anticyclone over the midlatitudes(Fig.5),consistent with the structure of anomalous SLP(Fig.2).However,the zonal locations of the anomalous dipole atmospheric circulation pattern related to the six NPO indices display substantial differences.
The anomalous anticyclone over the midlatitudes and the anomalous cyclone over the subtropical North Pacific related to the F12,Y11 and L08 NPO indices(Figs.5c–e)are located more eastward compared to those related to W 81,G04 and W 07(Figs.5a,b and f).This is consistent with the differences in the DJF SLP anomalies among the six NPO indices(Fig.2).As a result,large and significant northerly wind anomalies are apparent over North America,and southerly wind anomalies can be observed around the Russian Far East,related to the F12,Y11 and L08 NPO indices(Figs.5c–e).The significant anomalous northerly winds over North America related to F12,Y11 and L08(Figs.5c–e)bring colder air from higher latitudes,and explain the formation of signi ficant negative SAT anomalies over North America(Figs.3c–e).By contrast,the anomalous northerly winds over North America related to the W 81,G04,and W 07 NPO indices are much weaker and less significant(Figs.5a,b and f).As a result,the induced negative SAT anomalies related to these three NPO indices are much weaker(Figs.3a,b and f;Fig.4d).In addition,the pronounced southerly wind anomalies related to F12,Y11 and L08(Figs.5c–e)around the Russian Far East carry warmer and moister air from lower latitudes,which contributes to the significant positive SAT anomalies there(Figs.3c–e).
In the Eurasian continent,significant northerly wind anomalies can be observed around Lake Baikal related to the W 81,G04,L08 and W 07 NPO indices(Figs.5a,b,e and f).In particular,the northerly wind anomalies related to the W 07 NPO index are stronger and extend more northward.By contrast,the wind anomalies around Lake Baikal related to F12 and Y11 are weak and insignificant.This is consistent with the fact that the positive SLP anomalies over the midlatitudes of the North Pacific related to W 81,G04,L08 and W 07 can extend into the Eurasian continent(Figs.2a,b,e and f).The significant northerly wind anomalies related to the W 81,G04,L08 and W 07 NPO indices around Lake Baikal bring colder air from high latitudes,leading to the significant negative SAT anomalies there.In comparison,the influenc of the F12 and Y11 NPO indices on the SAT anomalies over Eurasia is weak and insignificant due to the weak wind anoma-lies.Hence,the above analyses indicate that the influences of the winter NPO on the SAT over the Eurasian continent and North America are sensitive to the definition of the NPO index.Also,this sensitivity is likely attributable to the change in the structure of the atmospheric circulation anomalies related to the different indices.
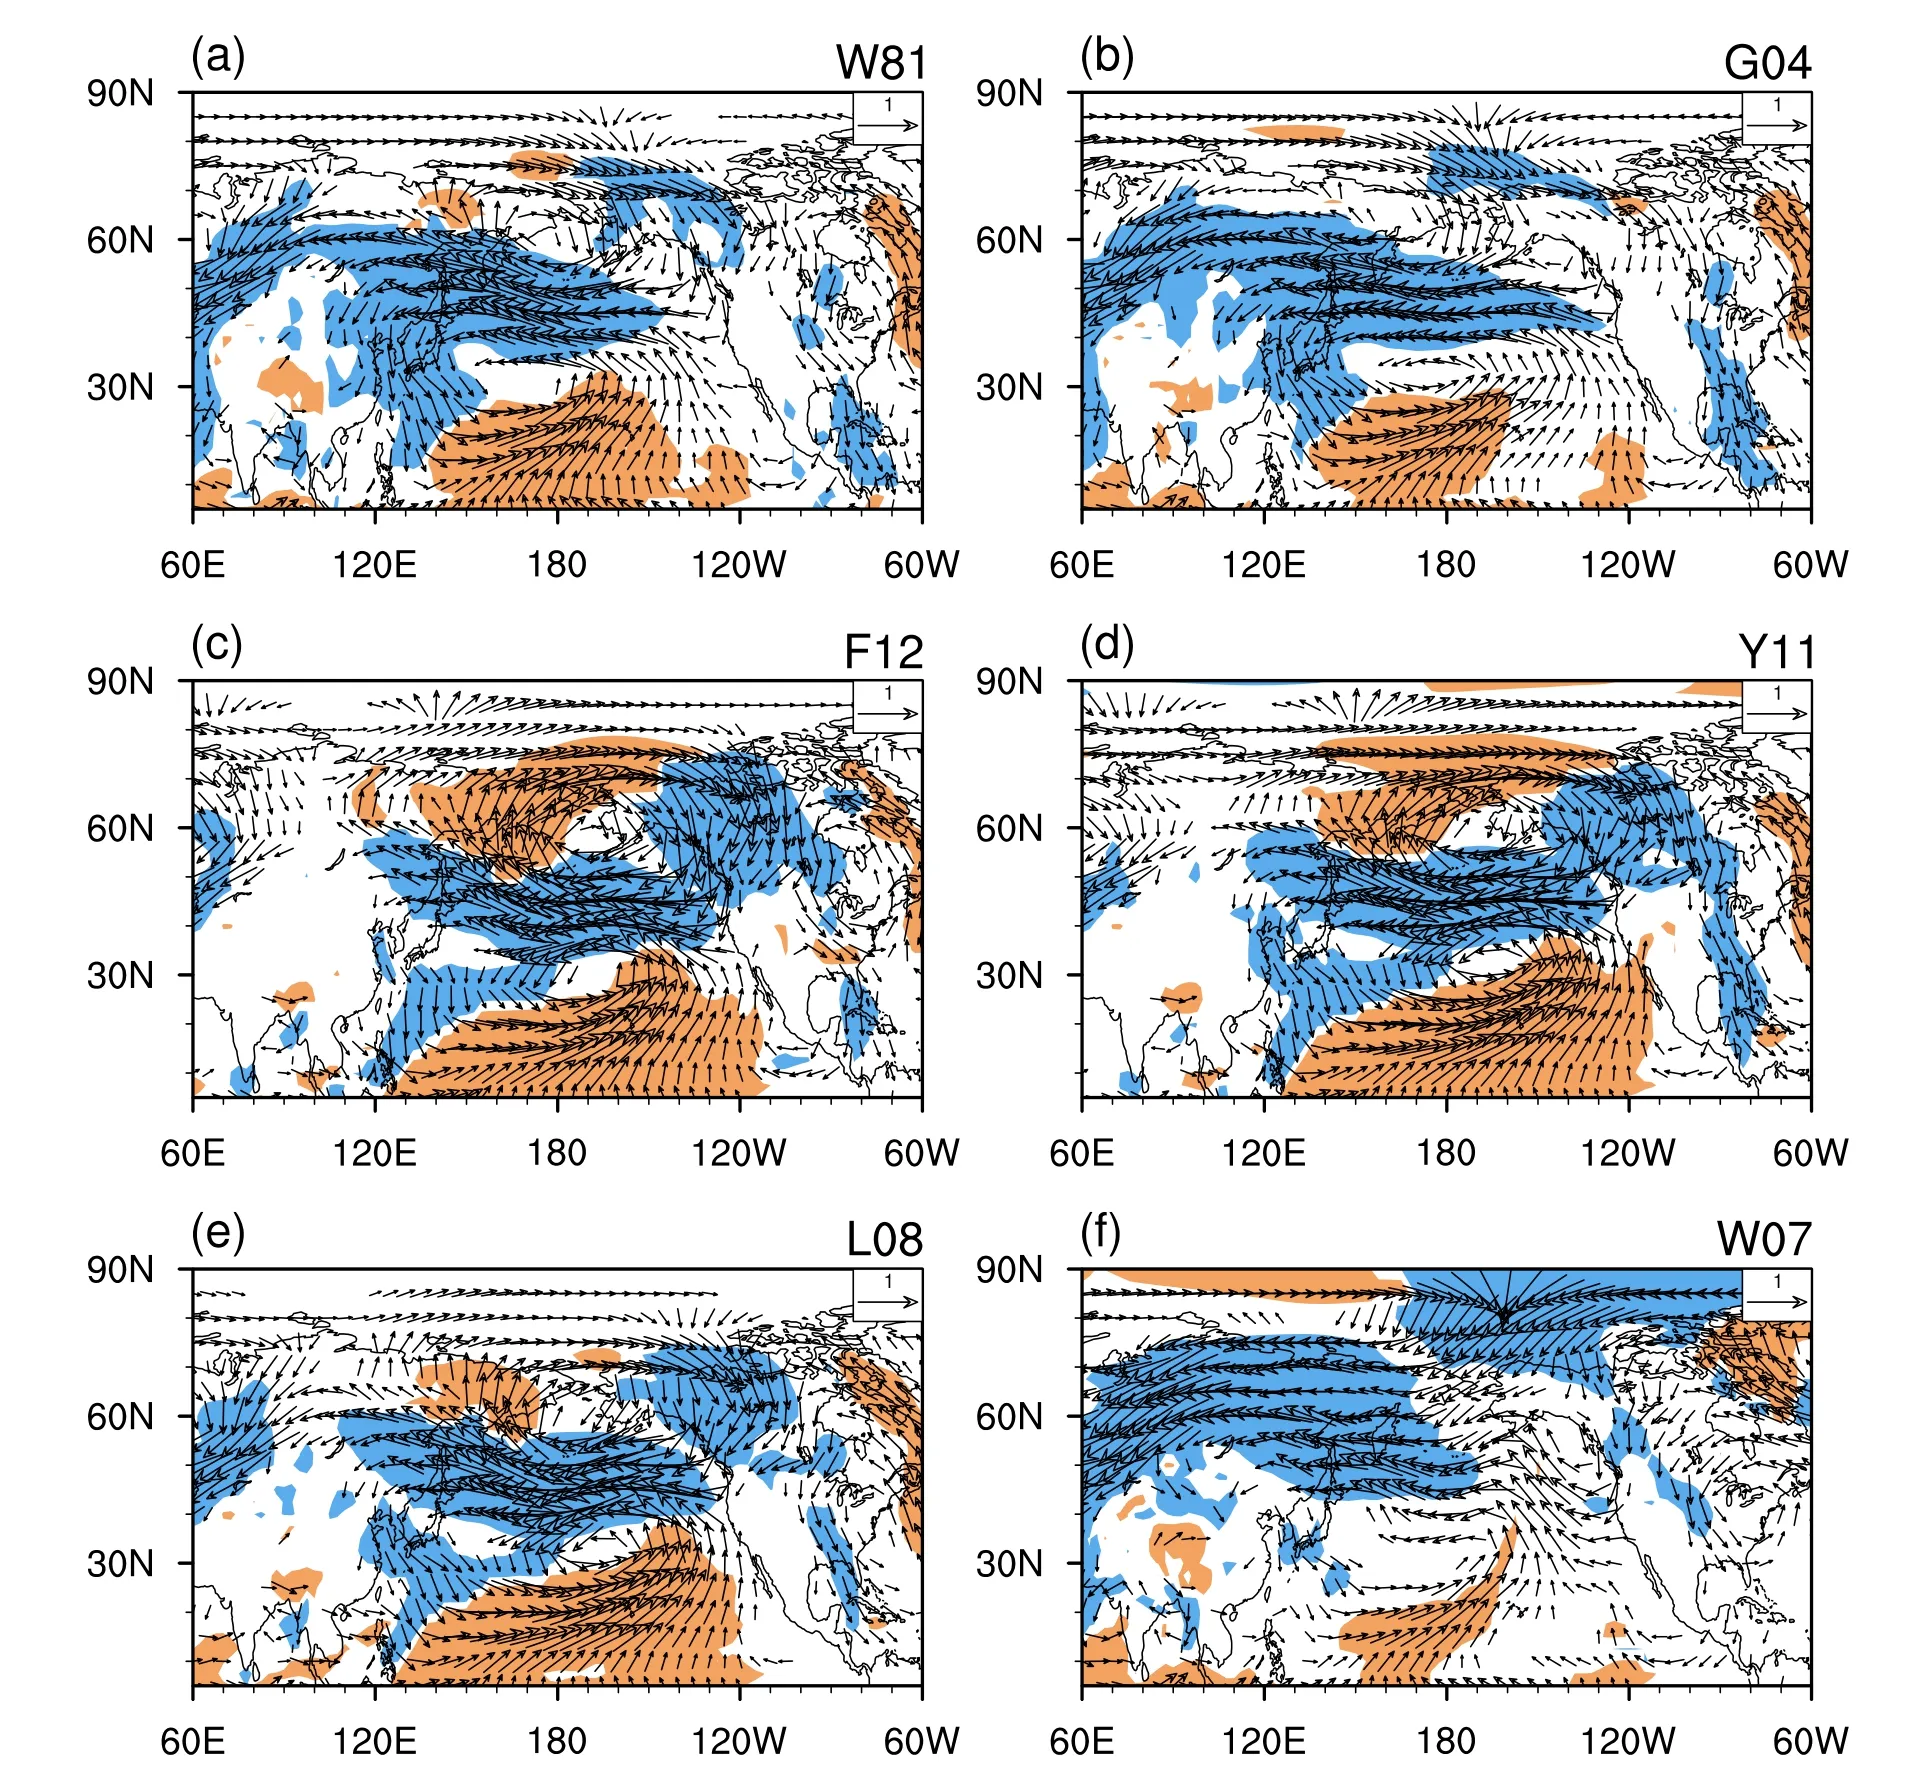
Fig.5. Anomalies of 850-hPa wind(units:m s?1)in DJF regressed on the normalized DJF indices for(a)W 81,(b)G04,(c)F12,(d)Y11,(e)L08 and(f)W 07.The red(blue)shading represents southerly or westerly(northerly or easterly)anomalies that are significantly different from zero at the 95%confidence level.
4. Discussion
As an important atmospheric internal variability over the North Pacific, the mechanisms underpinning the formation and maintenance of the NPO are not yet fully documented. Generally, previous studies indicate that the maintenance of the atmospheric circulation anomalies over the northern extratropics may be related to the wave-mean flow interaction and the associated eddy feedbacks—especially the synopticscale eddy feedback(e.g.,Hoskins et al.,1983;Lau,1988;Branstator,1995;Cai et al.,2007).Furthermore,studies have revealed that the NPO is closely associated with synopticscale eddy activity(storm tracks)(e.g.,Linkin and Nigam,2008;Pak et al.,2014).This suggests that the interaction between synoptic-scale eddy and low-frequency mean fl ow may play a crucial role in maintaining the NPO-related atmospheric circulation anomalies(Lau,1988;Cai et al.,2007).
The 300-hPa zonal wind anomalies in DJF related to the different NPO indices are compared in Fig.6.significant easterly wind anomalies appear over the midlatitudes of the North Pacific at around 40°–50°N,and pronounced westerly wind anomalies occur over the subtropics of the North Pacific(Fig.6).Marked anomalous westerly winds can also be found around the Bering Strait for the F12,Y11 and L08 NPO indices.Note that the spatial structures of the 300-hPa zonal wind anomalies related to the W 81,G04 and W 07 NPO indices shift northwestward compared to those related to F12,Y11 and L08(Fig.6),which is consistent with the differences in anomalous SLP(Fig.2).In particular,significant easterly wind anomalies are seen over Eurasia at around 60°N for the W 81,G04 and W 07 NPO indices(Fig.6).
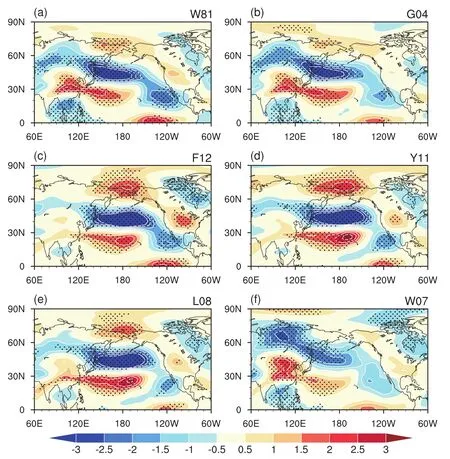
Fig.6. Anomalies of 300-hPa zonal wind(units:m s?1)in DJF regressed on the normalized DJF indices for(a)W 81,(b)G04,(c)F12,(d)Y11,(e)L08 and(f)W 07.Those anomalies in(a–f)that are significantly different from zero at the 95%confidence level are stippled.Units:m s?1.
Similar differences can be observed for the 300-hPa storm-track anomalies(Fig.7).Follow ing previous studies(Lee et al.,2012a;Chen et al.,2015b),the storm track(i.e.,synoptic-scale eddy)is defined as the root-mean-square of the 2–8-day band-pass fi ltered 300-hPa geopotential height.As demonstrated by previous studies(Lau,1988;Cai et al.,2007),a weakening(strengthening)of the westerly jet stream is accompanied by a weakened(enhanced)storm track.From Fig.7,significant negative storm-track anomalies can be observed over the midlatitudes of the North Pacific at around 40°–50°N,corresponding to the easterly wind anomalies there.Lau(1988)demonstrated that weakened synoptic-scale eddy activity is accompanied by a negative geopotential height tendency immediately to its south and a positive geopotential height tendency to its north.Hence,the above process may help in maintaining the NPO-related dipole structure.Note that the structures of the storm-track anomalies over the North Pacific shift northwestward for W 81,G04 and W 07 compared to those related to F12,Y11 and L08,which is consistent with the 300-hPa zonal wind anomalies and SLP anomalies(Figs.2,6 and 7).In particular,significant negative storm-track anomalies can be found over Eurasia at around 60°N for the W 81,G04 and W 07 NPO indices.Hence,the above analysis indicates that the differences in the NPO-related atmospheric circulation anomalies are closely related to the differences in the storm-track anomalies.
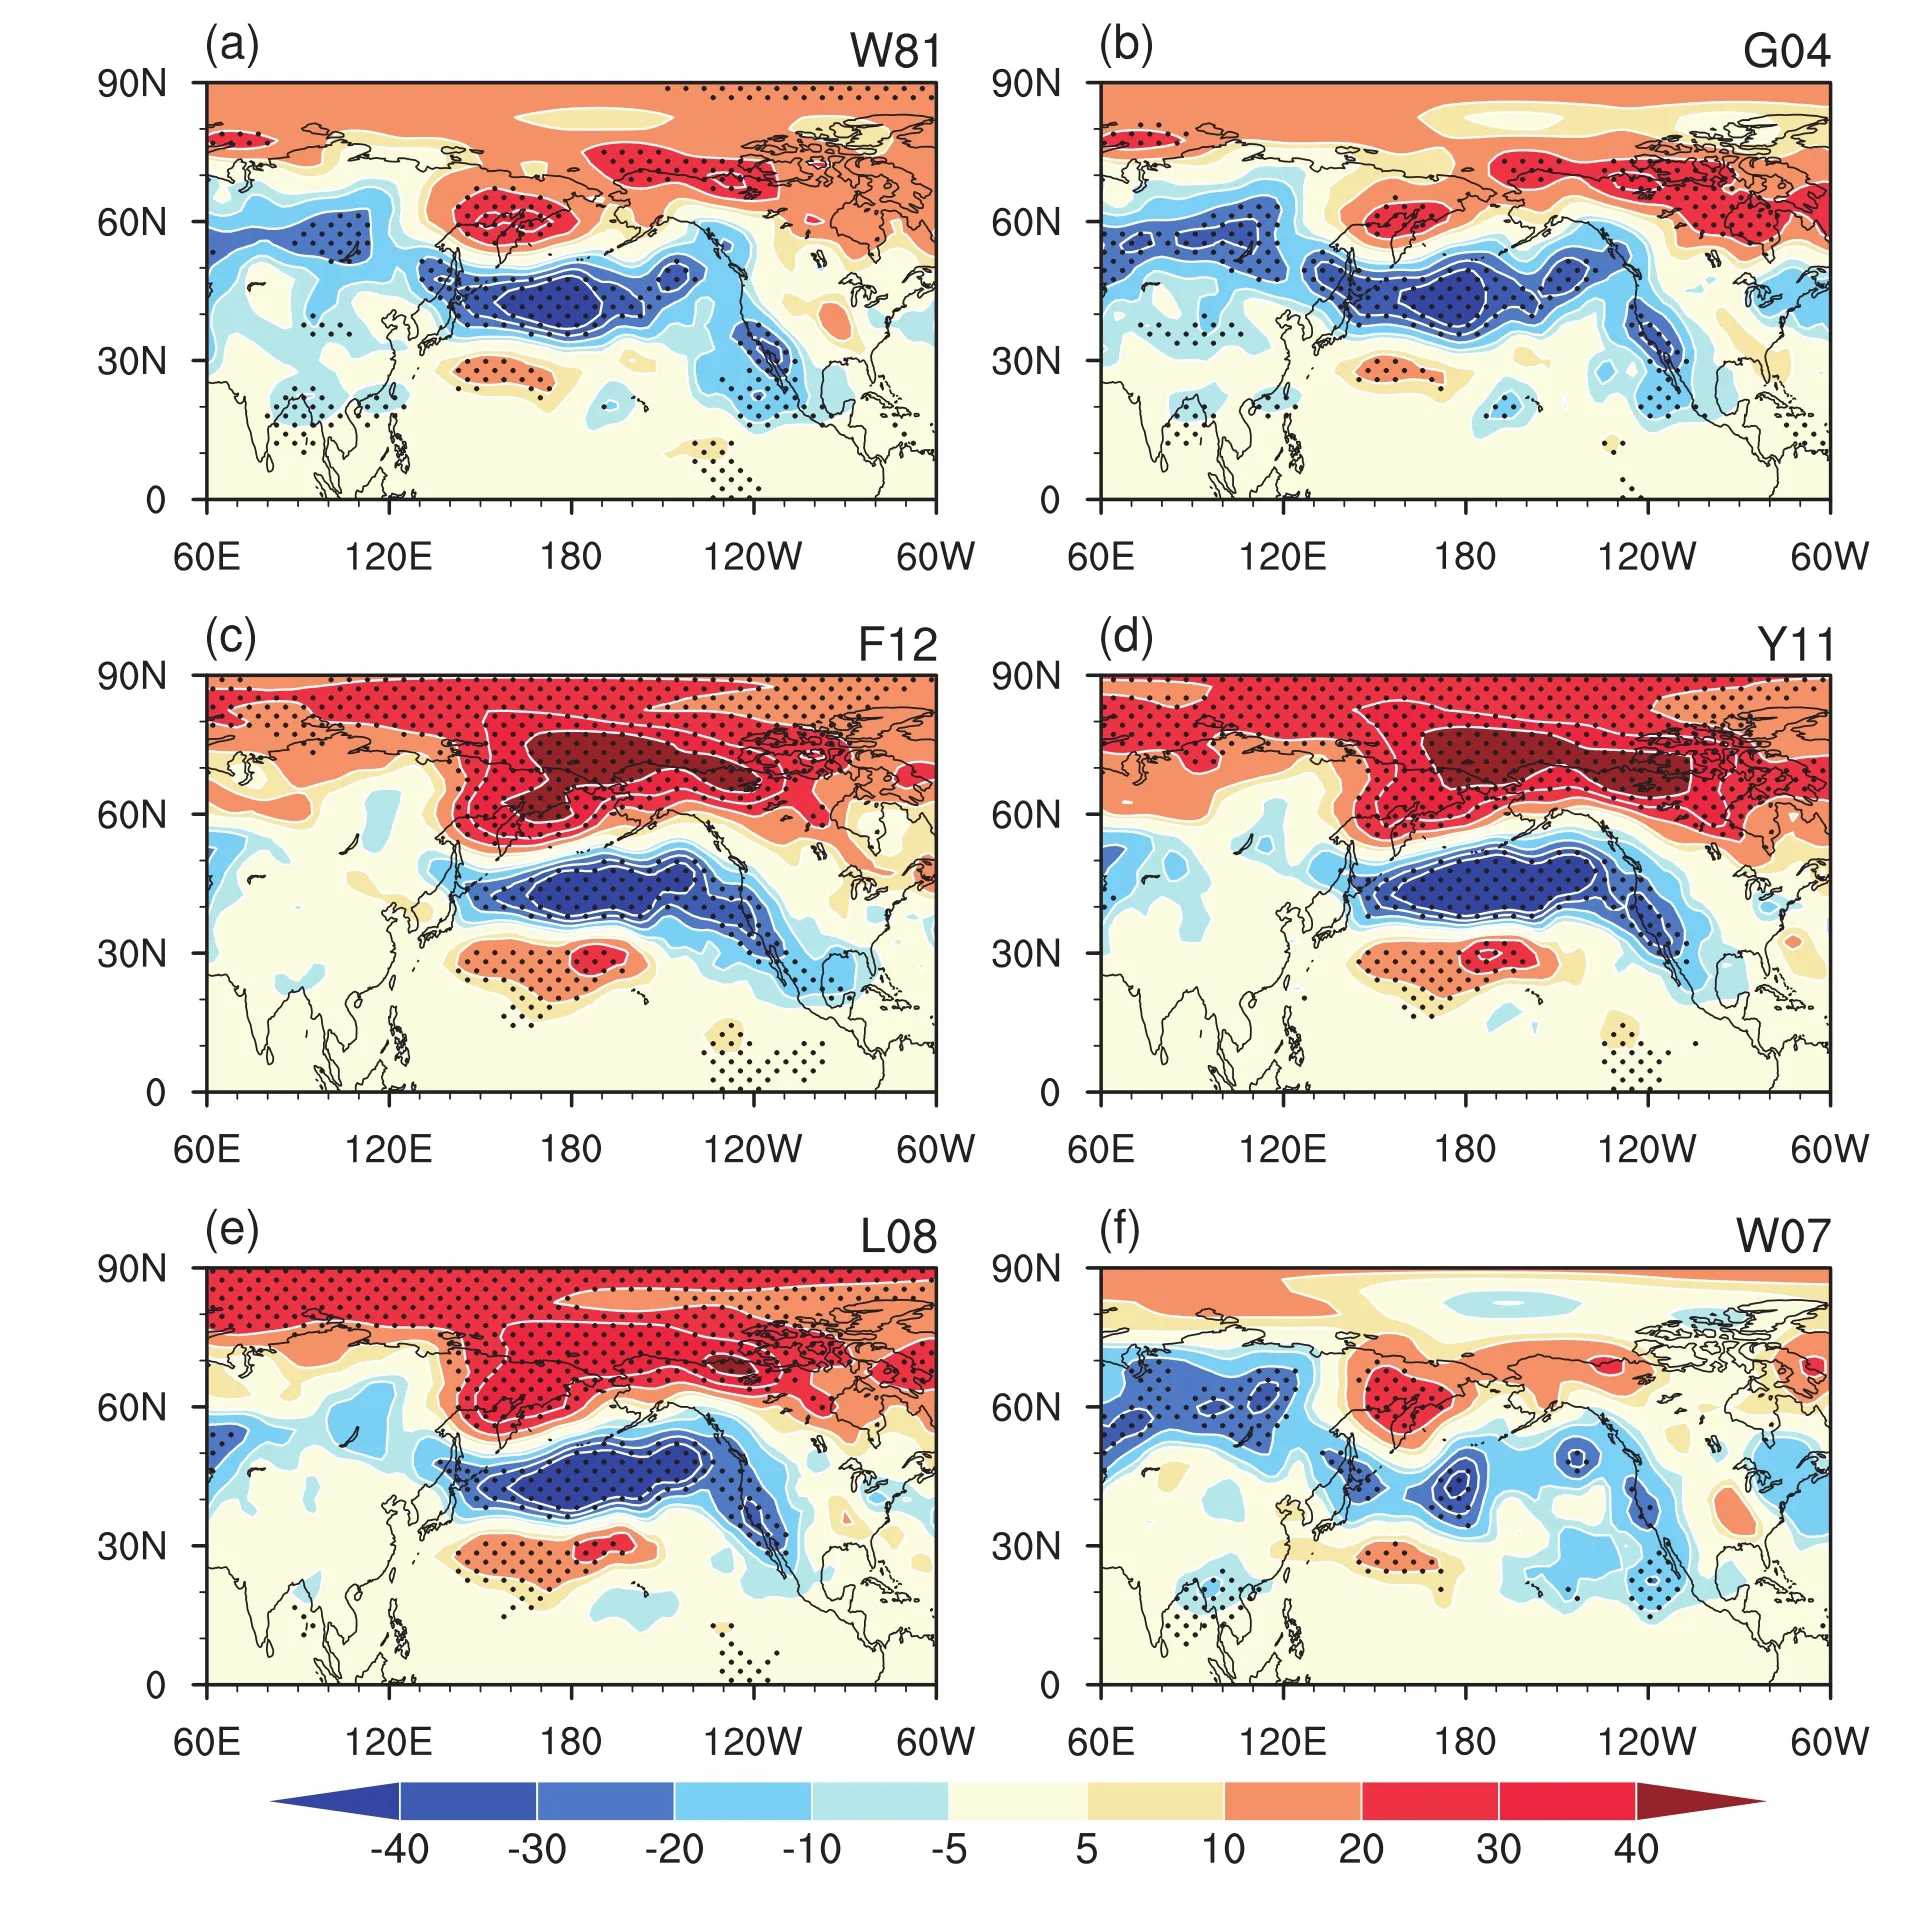
Fig.7. Anomalies of 300-hPa storm track anomalies in DJF regressed on the normalized DJF indices for(a)W 81,(b)G04,(c)F12,(d)Y11,(e)L08 and(f)W 07.Those anomalies in(a–f)that are significantly different from zero at the 95%confidence level are stippled.Units:m.
5. Summary
The present study investigates the impacts of the boreal winter NPO on the SAT variations over the Eurasian continent and North America based on six different NPO indices(W 81,G04,F12,Y11,L08 and W 07).W 81 is a grid-point SLP-based NPO index;G04 and F12 are area-mean SLP-based NPO indices;Y11,L08 and W 07 are SLP EOF-based NPO indices.It is found that the influences of the winter NPO on the simultaneous winter SAT over Eurasia and North America are sensitive to the definition of the NPO index.The impacts of F12,Y11 and L08(W 81,G04 and W 07)on the SAT variations over North America and the Chukotka peninsula are strong and significant(weak and insignificant).By contrast,the influences of W 81,G04,L08 and W 07 on the SAT variation over the southern part of East Siberia are notable.Only the W 07 NPO index can exert a significant influence on the SAT variation over the northern part of East Siberia.
The sensitivity of the effects of the NPO on the SAT over Eurasia and North America to the definition of the NPO index is related to the change in the structure of the atmospheric circulation anomalies.The anomalous cyclone and anticyclone over the North Pacific related to the F12,Y11 and L08 NPO indices are located more eastward and can extend into the North American region compared to those related to the W 81,G04 and W 07 NPO indices.The accompanying significant northerly wind anomalies related to the F12,Y11 and L08 NPO indices over North America bring colder air from high latitudes,resulting in the significant negative SAT anomalies there.In addition,the significant southerly wind anomalies related to the F12,Y11 and L08 NPO indices around the Russian Far East carry warmer and moister air from the lower latitudes,leading to the significant SAT anomalies there.By contrast,the meridional wind anomalies related to the W 81,G04 and W 07 NPO indices are weak over North America and around the Chukotka peninsula.As a result,the impacts of these three indices on the SAT anomalies over North America and the Chukotka peninsula are weak and insigni fi cant.
For the Eurasian continent,significant northerly wind anomalies can be observed around Lake Baikal related to the W 81,G04,L08 and W 07 NPO indices.As such,these four NPO indices can exert influences on the SAT variations over the southern part of East Siberia via wind-induced advection.In addition,W 07 can also exert substantial influences on the SAT variations over the northern part of East Siberia,because the anomalous northerly winds related to this index extend more northward compared to the others.
This study indicates that the definition of the NPO index should be taken into account when investigating the impacts of the winter NPO on the SAT variations over the Eurasian continent and North America.In addition,the results obtained in the present study may provide several suggestions as follows:
(1)Since the real nature of the NPO is unknown,it is hard to decide which definition is the best.Hence,it is suggested that multiple NPO indices are employed,rather than depending upon a single NPO index,when investigating the impact of the NPO on surface climate variations.
(2)When investigating the interdecadal change in the connection between the NPO and surface climate variations,we recommend that the grid-point SLP-based or area-mean SLP-based NPO indices are not used.This is because the structures and centers of the climate systems over the North Pacific may change over time(e.g.,Lee et al.,2012b).
(3)When investigating the impact of the NPO in numerical climate models,we suggest using an EOF-based method to define theNPO index(but the regions employed in theEOF analysis should not extend too far north).This is because the centers of the NPO may be different in different climate model outputs.
Acknowledgements.We thank the two anonymous reviewers for their constructive suggestions and comments,which helped to improve the paper.This study was supported by the National Natural Science Foundation of China(Grant Nos.41605050,41605031,41530425,41775080,and 41661144016),the Young Elite Scientists Sponsorship Program by the China Association for Science and Technology(Grant No.2016QNRC001),and the China Postdoctoral Science Foundation(Grant No.2017T100102).
Alexander,M.A.,D.J.Vimont,P.Chang,and J.D.Scott,2010:The impact of extratropical atmospheric variability on ENSO:Testing the seasonal foot printing mechanism using coupled model experiments.J.Climate,23,2885–2901,https://doi.org/10.1175/2010JCLI3205.1.
Baxter,S.,and S.Nigam,2015:Key role of the North Pacific Oscillation-West Pacific Pattern in generating the extreme 2013/14 North American winter.J.Climate,28,8109–8117,https://doi.org/10.1175/JCLI-D-14-00726.1.
Branstator,G.,1995:Organization of storm track anomalies by recurring low-frequency circulation anomalies.J.Atmos.Sci.,52,207–226,https://doi.org/10.1175/1520-0469(1995)052<0207:OOSTAB>2.0.CO;2.
Cai,M.,S.Yang,H.M.Van Den Dool,and V.E.Kousky,2007:Dynamical implications of the orientation of atmospheric eddies:A local energetics perspective.Tellus A:Dynamic Meteorology and Oceanography,59,127–140,https://doi.org/10.1111/j.1600-0870.2006.00213.x.
Chen,D.,H.J.Wang,J.P.Liu,and G.P.Li,2015a:Why the spring North Pacific Oscillation is a predictor of typhoon activity over the Western North Pacific.International Journal of Climatology,35,3353–3361,https://doi.org/10.1002/joc.4213.
Chen,S.F.,and R.G.Wu,2017:Impacts of winter NPO on subsequent winter ENSO:Sensitivity to the definition of NPO index.Climate Dyn.,https://doi.org/10.1007/s00382-017-3615-z.(in Press)
Chen,S.F.,B.Yu,and W.Chen,2014:An analysis on the physical process of the influenc of AO on ENSO.Climate Dyn.,42,973–989,https://doi.org/10.1007/s00382-012-1654-z.
Chen,S.F.,B.Yu,and W.Chen,2015b:An interdecadal change in the influenc of the spring Arctic Oscillation on the subsequent ENSO around the early 1970s.Climate Dyn.,44,1109–1126,https://doi.org/10.1007/s00382-014-2152-2.
Chen,S.F.,W.Chen,B.Yu,and H.F.Graf,2013:Modulation of the seasonal foot printing mechanism by the boreal spring Arctic Oscillation.Geophys.Res.Lett.,40,6384–6389,https://doi.org/10.1002/2013GL058628.
Dee,D.P.,and Coauthors,2011:The ERA-Interim reanalysis:Con fi guration and performance of the data assimilation system.Quart.J.Roy.Meteor.Soc.,137,553–597,https://doi.org/10.1002/qj.828.
Furtado,J.C.,E.Di Lorenzo,B.T.Anderson,and N.Schneider,2012:Linkages between the North Pacific Oscillation and central tropical Pacific SSTs at low frequencies.Climate Dyn.,39,2833–2846,https://doi.org/10.1007/s00382-011-1245-4.
Guo,D.,and Z.B.Sun,2004:Relationships of winter North Pacific Oscillation anomalies with the East Asian Winter Monsoon and the weather and climate in China.Journal of Nanjing Institute of Meteorology,27,461–470,https://doi.org/10.3969/j.issn.1674-7097.2004.04.004.(in Chinese)
Hameed,S.,and I.Pittalwala,1991:The North Pacific Oscillation:Observations compared with simulations in a general circulation model.Climate Dyn.,6,113–122,https://doi.org/10.1007/BF00209984.
Hoskins,B.J.,I.N.James,and G.H.White,1983:The shape,propagation and mean- fl ow interaction of large-scale weather systems.J.Atmos.Sci.,40,1595–1612,https://doi.org/10.1175/1520-0469(1983)040<1595:TSPAMF>2.0.CO;2.
Kutzbach,J.E.,1970:Large-scale features of monthly mean northern hemisphere anomaly maps of sea-level pressure.Mon.Wea.Rev.,98,708–716,https://doi.org/10.1175/1520-0493(1970)098<0708:LSFOMM>2.3.CO;2.
Lau,N.-C.,1988:Variability of the observed midlatitude storm tracks in relation to low-frequency changes in the circulation pattern.J.Atmos.Sci.,45,2718–2743,https://doi.org/10.1175/1520-0469(1988)045,2718:VOTOMS.2.0.CO;2.
Lee,S.-S.,J.Y.Lee,B.Wang,K.-J.Ha,K.Y.Heo,F.F.Jin,D.M.Straus,and J.Shukla,2012a:Interdecadal changes in the storm track activity over the North Pacific and North Atlantic.Climate Dyn.,39,313–327,https://doi.org/10.1007/s00382-011-1188-9.
Lee,Y.-Y.,J.-S.Kug,G.-H.Lim,and M.Watanabe,2012b:Eastward shift of the Pacific/North American pattern on an interdecadal time scale and an associated synoptic eddy feedback.International Journal of Climatology,32,1128–1134,https://doi.org/10.1002/joc.2329.
Li,C.Y.,and G.L.Li,2000:The NPO/NAO and interdecadal climate variation in China.Adv.Atmos.Sci.,17,555–561,https://doi.org/10.1007/s00376-000-0018-5.
Linkin,M.E.,and S.Nigam,2008:The north Pacific oscillation-West Pacific teleconnection pattern:Mature-phase structure and winter impacts.J.Climate,21,1979–1997,https://doi.org/10.1175/2007JCLI2048.1.
Willmott,C.J.,and K.Matsuura,2001:Terrestrial Air Temperature and Precipitation:Monthly and Annual Time Series(1950–1999),http://climate.geog.udel.edu/~climate/htm lpages/README.ghcn-ts2.htm l.
Pak,G.,Y.-H.Park,F.Vivier,Y.-O.Kwon,and K.-I.Chang,2014:Regime-dependent nonstationary relationship between the East Asian winter monsoon and North Pacific oscillation.J.Climate,27,8185–8204,https://doi.org/10.1175/JCLI-D-13-00500.1.
Rogers,J.C.,1981:The North Pacific oscillation.International Journal of Climatology,1,39–57,https://doi.org/10.1002/joc.3370010106.
Song,L.Y.,Y.Li,and W.S.Duan,2016:The influenc of boreal winter extratropical North Pacific Oscillation on Australian spring rainfall.Climate Dyn.,47,1181–1196,https://doi.org/10.1007/s00382-015-2895-4.
Thompson,D.W.J.,and J.M.Wallace,1998:The Arctic Oscillation signature in the wintertime geopotential height and temperature fields.Geophys.Res.Lett.,25,1297–1300,https://doi.org/10.1029/98GL00950.
Vimont,D.J.,D.S.Battisti,and A.C.Hirst,2001:Footprinting:A seasonal connection between the tropics and m id-latitudes.Geophys.Res.Lett.,28,3923–3926,https://doi.org/10.1029/2001GL013435.
Vimont,D.J.,D.S.Battisti,and A.C.Hirst,2003a:The seasonal foot printing mechanism in the CSIRO general circulation models.J.Climate,16,2653–2667,https://doi.org/10.1175/1520-0442(2003)016<2653:TSFM IT>2.0.CO;2.
Vimont,D.J.,J.M.Wallace,and D.S.Battisti,2003b:The seasonal foot printing mechanism in the Pacific:Implications for ENSO.J.Climate,16,2668–2675,https://doi.org/10.1175/1520-0442(2003)016<2668:TSFM IT>2.0.CO;2.
Walker,G.T.,and E.W.Bliss,1932:World weather V.Memoirs of the Royal Meteorological Society,4,53–84.
Wallace,J.M.,and D.S.Gutzler,1981:Teleconnections in the geopotential height field during the Northern Hem isphere winter.Mon.Wea.Rev.,109,784–812,https://doi.org/10.1175/1520-0493(1981)109<0784:TITGHF>2.0.CO;2.
Wang,H.J.,J.Q.Sun,and K.Fan,2007a:Relationships between the North Pacific Oscillation and the typhoon/hurricane frequencies.Science in China Series D:Earth Sciences,50,1409–1416,https://doi.org/10.1007/s11430-007-0097-6.
Wang,L.,W.Chen,and R.H.Huang,2007b:Changes in the variability of North Pacific Oscillation around 1975/1976 and its relationship with East Asian winter climate.J.Geophys.Res.,112,D11110,https://doi.org/10.1029/2006JD008054.
Yan,H.S.,Y.X.Wan,and J.G.Cheng,2005:Interannual and interdecadal variations in atmospheric circulation factors and rainfall in China and their relationship.Acta Meteorologica Sinica,19,253–261.
Yu,J.-Y.,and S.T.Kim,2011:Relationships between extratropical sea level pressure variations and the central Pacific and eastern Pacific types of ENSO.J.Climate,24,708–720,https://doi.org/10.1175/2010JCLI3688.1.
Zhou,B.T.,H.J.Wang,and X.Cui,2008:significant relationship between Hadley circulation and North Pacific Oscillation.Chinese Journal of Geophysics,51,999–1006,https://doi.org/10.3321/j.issn:0001-5733.2008.04.007.(in Chinese)
 Advances in Atmospheric Sciences2018年6期
- Advances in Atmospheric Sciences的其它文章
- Subseasonal Reversal of East Asian Surface Temperature Variability in winter 2014/15
- M odeling the warming Im pact of Urban Land Expansion on Hot Weather Using the Weather Research and Forecasting Model:A Case Study of Beijing,China
- Evaluating and Im proving wind Forecasts over South China:The Role of Orographic Parameterization in the GRAPES Model
- Regional Features and Seasonality of Land–Atmosphere Coup ling over Eastern China
- Simulating Eastern-and Central-Pacific Type ENSO Using a Sim p le Coup led M odel
- Evaluation of the New Dynamic Global Vegetation Model in CAS-ESM