
Nuclear magnetic resonance-based metabolomics and metabolic pathway networks from patient-matched esophageal carcinoma,adjacent noncancerous tissues and urine
2019-07-12 01:38:54JiaHaoLiangYanLinTingOuyangWanTangYaoHuangWeiYeJiaYunZhaoZheNingWangChangChunMa
World Journal of Gastroenterology 2019年25期
Jia-Hao Liang, Yan Lin, Ting Ouyang, Wan Tang, Yao Huang, Wei Ye, Jia-Yun Zhao, Zhe-Ning Wang,Chang-Chun Ma
AbstractBACKGROUND Several studies have demonstrated a correlation between esophageal cancer (EC)and perturbed urinary metabolomic profiles, but none has described the correlation between urine metabolite profiles and those of the tumor and adjacent esophageal mucosa in the same patient.AIM To investigate how urinary metabolic phenotypes were linked to the changes in the biochemical landscape of esophageal tumors.METHODS Nuclear magnetic resonance-based metabolomics were applied to esophageal tumor tissues and adjacent normal mucosal tissues alongside patient-matched urine samples.RESULTS Analysis revealed that specific metabolite changes overlapped across both metrics, including glucose, glutamate, citrate, glycine, creatinine and taurine,indicating that the networks for metabolic pathway perturbations in EC,potentially involved in but not limited to disruption of fatty acid metabolism,glucose and glycolytic metabolism, tricarboxylic acid cycle and glutaminolysis.Additionally, changes in most urinary biomarkers correlated with changes in biomarker candidates in EC tissues, implying enhanced energy production for rapid cell proliferation.reviewed and approved by the Second Affiliated Hospital,Shantou University Medical College Review Board (2018-44).Informed consent statement:Informed consent was obtained from each subject prior to participation in this study.Conflict-of-interest statement: The authors declare that they have no competing interests related to this study.Open-Access: This article is an open-access article which was selected by an in-house editor and fully peer-reviewed by external reviewers. It is distributed in accordance with the Creative Commons Attribution Non Commercial (CC BY-NC 4.0)license, which permits others to distribute, remix, adapt, build upon this work non-commercially,and license their derivative works on different terms, provided the original work is properly cited and the use is non-commercial. See:http://creativecommons.org/licen ses/by-nc/4.0/Manuscript source: Unsolicited manuscript Received: January 25, 2019 Peer-review started: January 25,2019 First decision: February 26, 2019 Revised: May 13, 2019 Accepted: May 31, 2019 Article in press: June 1, 2019 Published online: July 7, 2019 P-Reviewer: Hashimoto N, Luyer MDP S-Editor: Cui LJ L-Editor: Filipodia E-Editor: Ma YJ CONCLUSION Overall, these associations provide evidence for distinct metabolic signatures and pathway disturbances between the tumor tissues and urine of EC patients, and changes in urinary metabolic signature could reflect reprogramming of the aforementioned metabolic pathways in EC tissues. Further investigation is needed to validate these initial findings using larger samples and to establish the underlying mechanism of EC progression.
Key words: Esophageal cancer; Metabolites; Metabolic pathways; Nuclear magnetic resonance-based metabolomics; Tumor tissue; Urine
INTRODUCTION
Esophageal cancer (EC) is the eighth most common type of malignant tumor and the sixth leading cause of cancer-related death worldwide[1]. Identifying cancer-related biomarkers of EC is essential for its diagnosis and therapeutic intervention in the early stage, which in turn will significantly increase patient survival. While there are a few diagnostic/screening techniques, such as upper gastrointestinal endoscopy, endoscopy-based balloon cytology, and serum carcinoembryonic antigen (commonly known as CEA) test, high-throughput and sensitive molecular tools are required to elucidate specific disease biomarkers for optimal disease management. Metabolomics,in which the global changes of small molecular weight metabolites in a given biological specimen are investigated, has considerable potential to identify useful biomarkers, thereby stratifying subjects into disease or nondiseased categories[2,3].Proton nuclear magnetic resonance (1H-NMR) spectroscopy is a well-established,robust, noninvasive and reproducible method for quantifying metabolic profiles[4],and it has several advantages over other analytical techniques, such as liquid chromatography mass spectroscopy and gas chromatography mass spectroscopy,including nondestructive analysis of samples, minimal sample preparation, and the ability to detect multiple metabolites within a single experiment[5-8]. NMR data combined with multivariate statistical analysis, such as orthogonal partial least squares discriminant analysis (OPLS-DA), which can be utilized for disease cla-ssification(through the use of score plots) and biomarker detection (through the use of loading plots), allow for the identification of potential biomarkers in biological specimens and improve the ability to identify specific metabolic pathways and networks associated with the disease process.
Urine is a biological fluid commonly used by NMR-based metabolomics[9,10]because it is easily collected in large volumes with noninvasive procedures and may provide substantial diagnostic information for many cancer types[7,11-13]. Biomarkers in urine may be derived from cell apoptosis, glomerular filtration of blood plasma, cell sloughing, epithelial cell secretion of exosomes, and other processes[14]. Several NMR spectroscopy-based metabolomic studies have reported that metabolite compositions of urine samples from EC patients differ from those of healthy controls (HCs)[15,16].However, little is known about the systemic mechanistic link between esophageal tissues and urine, owing to the invasiveness of tissue sampling and sensitivity of the urinary metabolome to factors such as environment, food and genetic composition.
The aim of this research was to profile parallel metabolites of EC tissues and adjacent noncancerous tissues alongside urine samples from the same patients, to investigate how urinary metabolomic phenotypes associate with tumor tissue, and to identify specific disturbed metabolic pathways in esophageal tissues and urine. Such information would be vital to bridge the gap between the systemic metabolic characteristics of EC tissues and the corresponding samples of urine and may help advance the utility of urinary-based metabolites as relevant indicators of EC tissue microenvironment.
MATERIALS AND METHODS
Patient recruitment and sample collection
This study was approved by the Ethics Committee of Shantou University Medical College. Written informed consent was obtained from each subject prior to participation. Early-morning midstream urine samples were collected preoperatively from 41 EC patients and 40 HCs between August 2015 and October 2016 at the Second Affiliated Hospital of Shantou University Medical College. EC patients were diagnosed by microscopy, biopsy, or surgical resection, and the disease stage was determined according to the American Joint Committee on Cancer (AJCC) staging system for esophageal tumors: Stage I/II, 15 patients; stage III, 11 patients; stage IV,15 patients. Each urine sample was mixed with 50 μL sodium azide preservative and stored at -80 °C until further analysis. Patient-matched EC tissues and their corresponding adjacent noncancerous tissues (~5 cm away from the tumor margin) were collected from 20 EC patients and immediately stored at -80 °C until NMR analysis.Exclusion criteria for all participants included use of antibiotics, nonsteroidal antiinflammatory drugs, statins, or probiotics within 2 mo of study participation.Additional exclusion criteria for EC patients included chemotherapy or radiotherapy prior to surgery. The demographic and clinical characteristics of the EC patients and con-trols are summarized in Table 1.
Urine sample preparation
Frozen urine samples were thawed at room temperature and mixed to suspend any settled precipitate. After adding 300 μL PBS/D2O buffer (0.1 M, pH 7.4) to 600 μL of each urine sample, the mixture was homogenized by vortexing for 60 s and then centrifuged at 8000 rpm for 10 min. Subsequently, a volume of 500 μL of the supernatant was transferred into an Eppendorf vial, to which 50 μL of a stock solution of sodium (3-trimethylsilyl)-2, 2, 3, 3-tetradeuteriopropionate (TSP)/D2O was added,using a chemical shift reference (0.0 ppm) for spectral alignment. Finally, the resulting mixture was centrifuged at 10000 rpm for 5 min, and 500 μL of the prepared sample was transferred into a 5-mm high-resolution NMR tube for1H-NMR analysis.
Tissue sample preparation
The frozen tissue samples weighed ~300 mg and were thawed and cut into small pieces at room temperature. After adding 1.8 mL mixture containing 0.6 mL distilled water (2 mL/g tissue) and 1.2 mL methanol (4 mL/g tissue), the resulting mixture was homogenized at 16000 rpm for 80 s. After homogenization, the mixture was added to chloroform (4 mL/g tissue) and distilled water (4 mL/g tissue) and vortexed for 60 s. The suspension was then left on ice for 15 min and centrifuged at 2000 rpm for 5 min to facilitate separation of the liquid layers. The resulting supernatant was evaporated under a stream of nitrogen and then dried under vacuum for a minimum of 18 h. Subsequently, the lyophilized powder was redissolved with 550 μL PBS/D2O buffer (0.1 mol/L, pH 7.4), to which 50 μL of a stock solution of TSP/D2O was added.After homogenization and centrifugation at 10000 rpm for 5 min, 500 μL supernatant was transferred into a 5-mm high-resolution NMR tube for1H-NMR analysis.
1H-NMR analysis
All samples were detected by a Bruker AVII 400 MHz NMR spectrometer (Bruker Biospin, Germany) operating at a1H frequency of 400.13 MHz. Magnetic field homogeneity was optimized by gradient or manual shimming prior to acquisition.The temperature was maintained at 298 K and lock performed on the D2O signal.1H NMR spectra of urine samples were obtained using a 1D nuclear Overhauser enhancement spectroscopy pulse sequence [RD-90°-t1-90°-tm-90°- ACQ], with the following acquisition parameters: Recycle delay (RD) 1.5 s; t1 3 μs; mixing time, tm 100 ms; 90° pulse width 7.3 μs; number of scans (NS) 256; number of points, TD 32768;spectral width (SW) 8012.82 Hz; acquisition time (AQ) 2.04 s. Water suppression was achieved by irradiation of the water peak during RD and tm. Esophageal tissue1H NMR spectra were recorded using a standard (1D) Carr-Purcell-Meiboom-Gill pulse sequence with the following acquisition parameters: number of dummy scans 4; RD 70 ms; 90° pulse width 10 μs; NS 64; TD 65536; SW 8012 Hz; AQ 4.09 s.
Table 1 Summary of clinical and demographic features for study subjects and tumor characteristics
1H NMR spectral data processing
All free induction decays from 1D1H-NMR of the tissues and urine samples were multiplied by a 0.3 Hz exponential line broadening prior to Fourier transformation.1H-NMR spectra were then corrected for phase and baseline distortion and calibrated to TSP at 0.0 ppm by using MestReNova software (version 8.1.0, Mestrelab Research,Santiagode Compostella, Spain). To reduce the complexity of the NMR data, the spectral range from 0.8 to 9.0 ppm was segmented into buckets with the equal width of 0.004 ppm. The region of 5.5-4.5 ppm was discarded to eliminate imperfect water suppression. Each bucket was internally normalized to the total integral of the spectrum prior to pattern recognition analysis, to eliminate the dilution or bulk mass differences among samples due to the different sample weight.
Pattern recognition analysis and cross validation
To maximize class discrimination between EC patient and HC urine samples, as well as between EC tissues and their corresponding noncancerous tissues, multivariate data analysis was applied to the1H-NMR spectral data according to previously published and accepted methods[6,7]. The normalized NMR spectral data sets were unit variance scaled and analyzed using the SIMCA-P+ program (version 14.1, Umetrics AB; Umea, Sweden). OPLS-DA was applied to the analysis of1H-NMR spectral data to optimize the separation between experimental groups. The model quality was evaluated with the R2Y and Q2values, reflecting the explained fraction of variance and the model predictability. R2Y scores ranged between 0 and 1 and Q2scores between negative and 1, where a R2Y score of 1 demonstrated that the model explained 100% of variance, and a Q2score closer to 1 indicated higher reliability of the prediction in the cross-validation procedure. Validation of the OPLS-DA model was also performed by means of a permutation test (400 times). The R2Y in the permutated plot described
how well the data fitted with the derived model, whereas Q2described the predictive ability of the derived model (Q2> 0.5 considered as good and Q2> 0.9 as excellent). To further evaluate the predictive power of the robust OPLS-DA model, 80% of samples were applied to construct a model, which was used to predict the remaining 20% of samples. The variable importance in the projection (VIP) values of all peaks from OPLS-DA models was taken as a coefficient for peak selection. The VIP value was represented by a unitless number, where higher values suggested greater discriminatory power of the metabolite. Those variables with VIP > 1 were considered potential biomarker candidates for group discrimination.
Statistical analysis
The relative concentrations of those metabolites with VIP > 1 were calculated by integrating the signals in the spectra. Statistical significance was assessed using the Mann-Whitney U test, and P < 0.05 was considered statistically significant. The relative concentrations of those metabolites with VIP > 1 were calculated by integrating the signals in the spectra, and data are presented as the mean fold difference in EC metabolite abundance compared to controls. To further evaluate the diagnostic power of the potential biomarkers whose levels significantly differed between experimental groups, receiver operating characteristic (ROC) analysis in SPSS version 16.0 was performed, and the optimal area under the ROC curve(AUROC), specificity and sensitivity of the metabolites were calculated, where AUROC > 0.8 indicated excellent diagnostic ability. Pearson correlation analysis was used to assess the association of biomarker candidates between urine and tumor tissues of EC patients with an OPLS-DA model using a correlation coefficient cut-off of |r| and correlation significance of P < 0.05. Correlation coefficients ranged from 1.0(maximum positive correlation) to -1.0 (maximum anticorrelation), with a value of 0 representing no correlation. Correspondingly, |r| > 0.44 (calculated for the sample size of 20) was considered to be a statistically significant relationship between the two metabolites.
All right, said the fox, only don t be in such a hurry; let s wait till night, when the little birds have gone to roost, then I ll climb up and catch them all for you
RESULTS
Metabolic profiles of esophageal tissues and urine samples
Representative 1D1H-NMR spectra of urine specimens acquired from EC patients,HCs and patient-matched esophageal tissue extracts are shown in Figure 1A and B.The standard 1D spectrum gave an overview of all metabolites. The major metabolites in the spectra were identified according to previous studies[17,18]and the Human Metabolome Database (http://www.hmdb.ca/). In all urine and esophageal tissue spectra, the aliphatic region at 0.8-4.2 ppm included numerous signals from the following water-soluble metabolites: Glutamate, glutamine, acetoacetate, citrate,cisaconitate, choline, creatine, creatinine and glycine, which are known to be involved in many biochemical processes, especially in energy metabolism.
Good discrimination between EC patients and HCs was achieved by an OPLS-DA scores plot generated from1H-NMR spectra of urine specimens (Figure 2A-a). The predictive ability of the model was calculated by internal validation (R2Y = 0.902, Q2=0.682, CV-ANONA P < 0.01), suggesting that the model possessed a satisfactory fit with good predictive power. In order to evaluate the robustness of the OPLS-DA model described above, a random permutation test was performed 400 times to further evaluate the robustness of this model, as exhibited by the steep R2and Q2regression lines and difference between R2and Q2(R2Y = 0.886 and Q2= 0.660),indicating that this was an excellent model suitable for data analysis (Figure 2A-b). To further assess the predictive ability of the model for unknown samples, we randomly selected 80% of urine samples (“training set”, 33 EC patients and 32 HCs) to construct an OPLS-DA model, which was then used to predict the remaining 20% of samples(“testing set”, 8 EC patients and 8 HCs). As can be seen in Figure 2A-c, the testing sets of EC patients and HCs were correctly located in their corresponding region of the training sets. Urine metabolites that met the following conditions were considered potential metabolite biomarkers for EC detection: Levels of metabolites with VIP > 1 and the presence of a significant difference (P < 0.01) between metabolite levels of EC patients and HCs according to the Mann-Whitney U test. A total of ten urine metabolites were found to be significantly changed in EC patients compared to HCs (Table 2), including higher levels of acetoacetate, cis-aconitate, citrate and glutamate,together with lower amounts of glycine, taurine, creatinine, ethanolamine, glucose and hippurate.
Tissue profiles from EC tumor tissues and their corresponding adjacent noncancerous tissues were clearly separated using the OPLS-DA scores plot (Figure 2B-a). Model parameters of the 400 times permutation test generated R2Y = 0.908 and Q2= 0.842 (Figure 2B-b). Moreover, the OPLS-DA model showed good performance for predicting the unknown samples (Figure 2B-c). Using these criteria (VIP > 1 and P< 0.05), the 15 metabolites listed in Table 3 were found to be significantly changed in EC tissues compared to their corresponding noncancerous tissues, including elevated levels of valine, leucine, alanine, acetate, citrate, succinate, choline and glutamate, as well as depleted levels of creatinine and creatine, glycine, threonine, taurine, glucose,and glutamine.
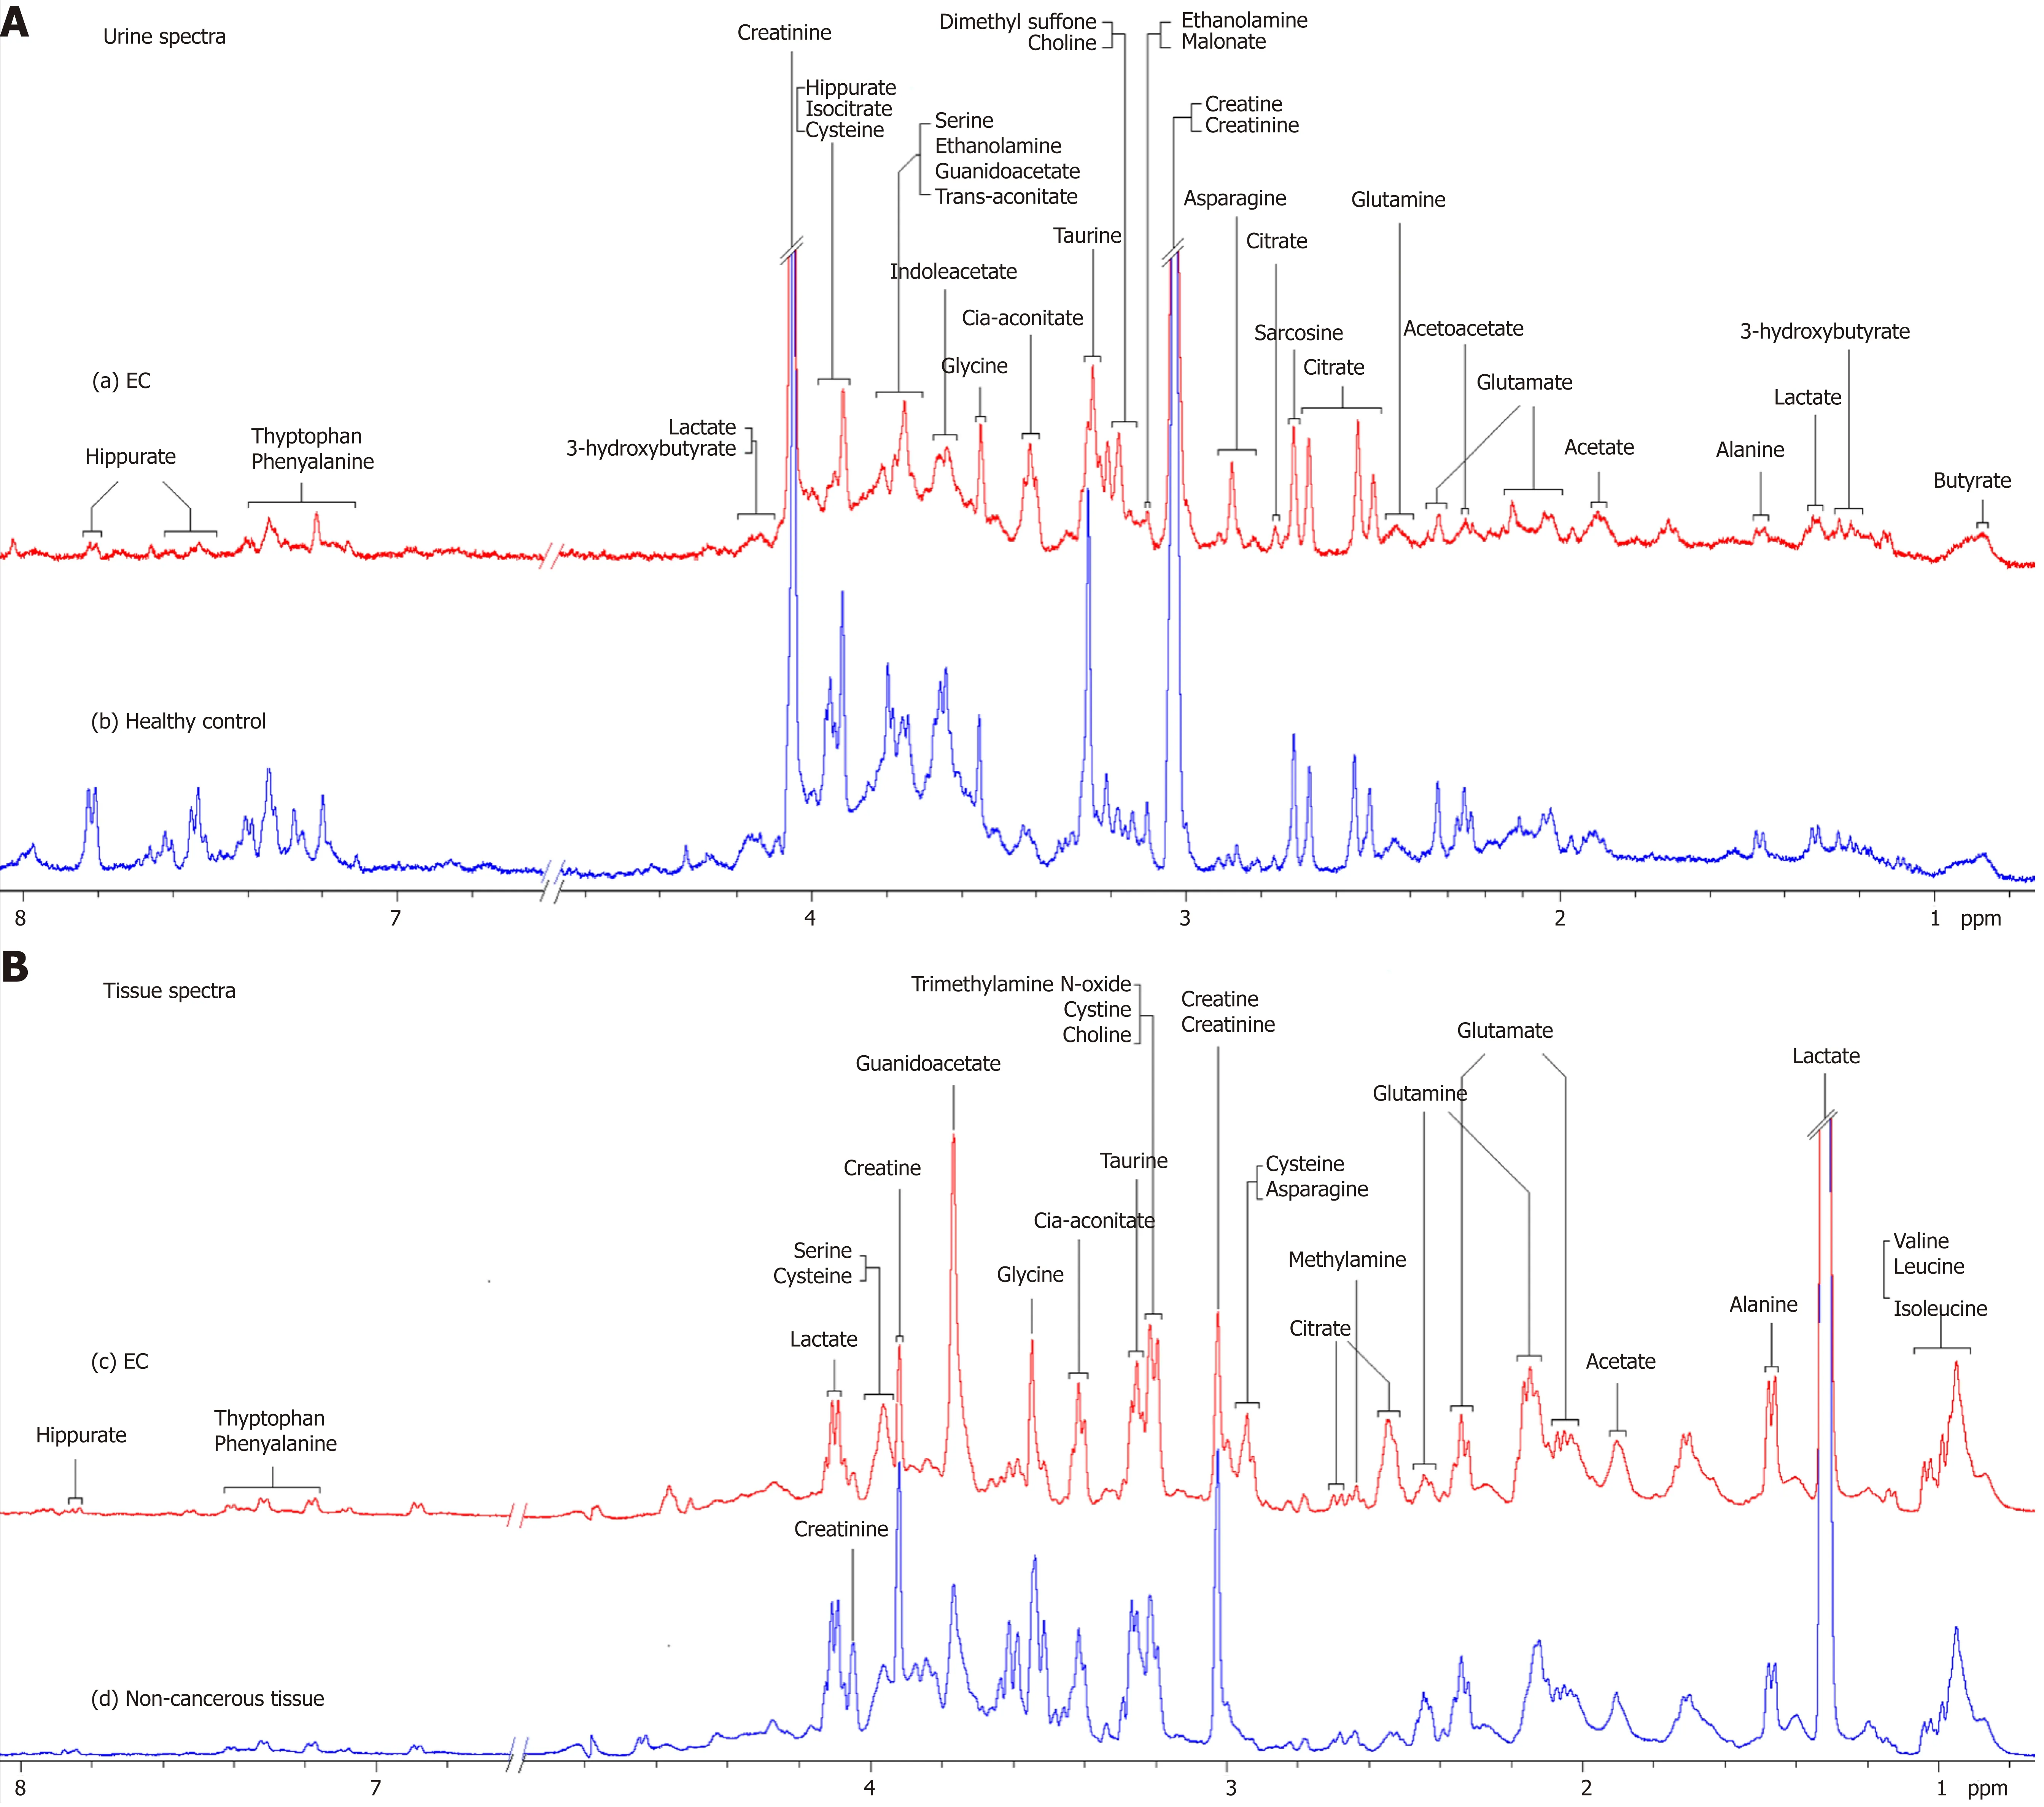
Figure 1 Proton nuclear magnetic resonance spectra. A: 400 MHz representative urine proton nuclear magnetic resonance (1H-NMR) spectra obtained from esophageal cancer (EC) patient (a) and healthy control (b); B: Tissue 1H-NMR spectra obtained from EC tissue (c) and adjacent noncancerous tissue (d) referenced to tetradeuteriopropionate (0.0 ppm).
Metabolic changes that overlap across urine and EC tissues
Our parallel investigations revealed a few distinct and overlapping discriminatory metabolites between cancer tissues and urine of EC patients, including decreased levels of glucose, glycine, creatinine and taurine, together with increased levels of glutamate and citrate, as compared to their respective controls. Metabolic profiling associations between potential urine and tissue biomarkers were further analyzed,plotted as correlation heat maps color-coded by the strength of Spearman correlation coefficients (Figure 3). Changes in most potential urinary biomarkers (except for glutamate, citrate and glucose) were found to be correlated with changes in most biomarker candidates in EC tissues (except for glycine and acetate) (|r| > 0.44, P <0.05).
Comparison of diagnostic performance of potential urinary biomarkers for
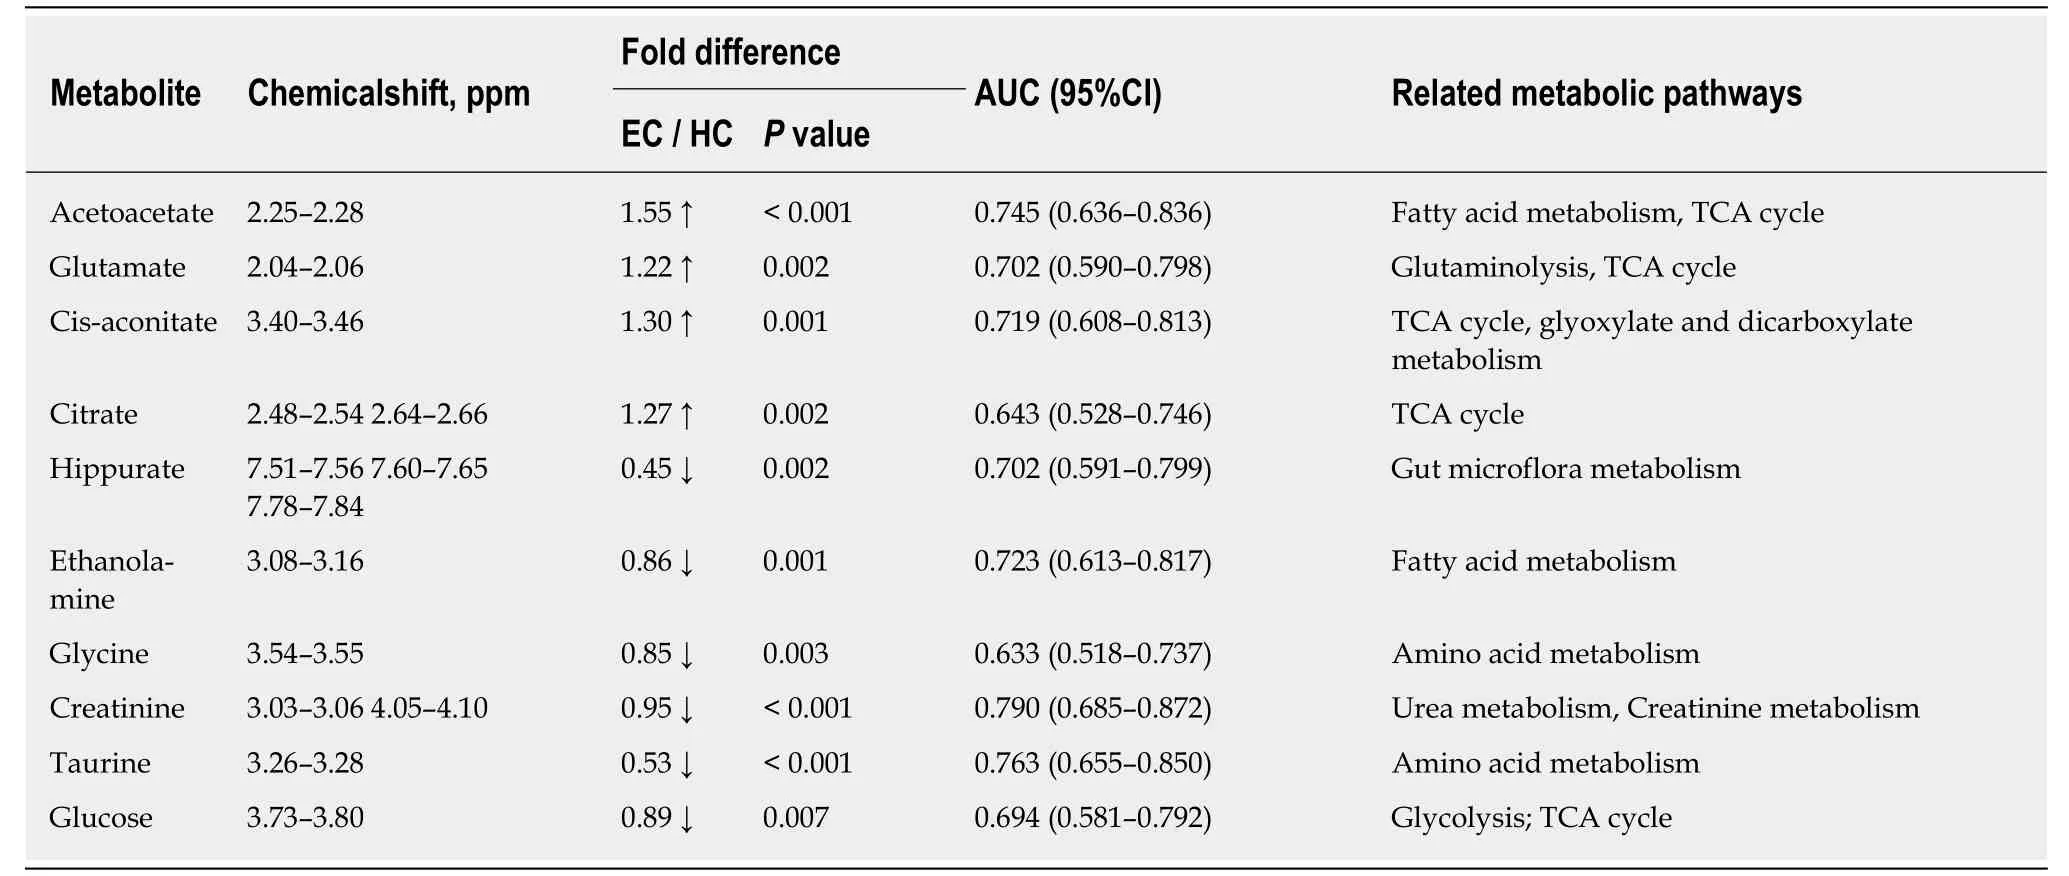
Table 2 Potential urine biomarkers for discriminating esophageal cancer patients from healthy controls
distinguishing EC
Given that urinary glutamate, citrate and glucose in EC patients did not show correlation with esophageal tissue biomarkers, a panel of urinary metabolite markers composed of acetoacetate, cis-aconitate, hippurate, ethanolamine, glycine, creatinine and taurine was selected to compare their diagnostic performance for distinguishing EC patients from HCs. ROC analysis of the comparison of single urinary biomarkers and their combination showed that combined metabolites of the aforementioned metabolites had better diagnostic performance than any single metabolite alone in discriminating EC patients from HCs, with sensitivity, specificity and area under the curve values of 92.68%, 92.50% and 0.971, respectively (Figure 4).
DISCUSSION
The current study performed parallel investigations of EC tissues and adjacent noncancerous mucosal tissues alongside patient-matched urine samples to investigate how changes of the urine metabolome were linked to the changes of EC tissues metabolic phenotypes. Our study showed significant metabolic alterations in both urine and tumor tissues of EC patients compared to their respective HCs. Correlative analysis of the altered metabolites across both matrices revealed a few distinct and overlapping discriminatory metabolites, such as glucose, glycine, creatinine and taurine (decreased levels) together with glutamate and citrate (increased amounts),suggesting that EC is associated with the following dysregulated metabolic pathway perturbations, including but not limited to fatty acid metabolism, glucose and glycolytic activity, tricarboxylic acid (TCA) cycle and glutaminolysis. Metabolic profiling correlations between esophageal tissues and urine showed that most potential urine biomarkers were correlated with most of the discriminating metabolites in EC tissues, indicating that changes in urine metabolic signature could reflect reprogramming of metabolic pathways in tumor tissues, highlighting the significance of the distinct urinary metabolic profiles as potential novel and nonin-vasive indicators for EC detection.
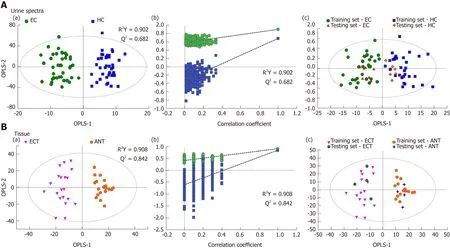
Figure 2 Pattern recognitions. A: Pattern recognition of urine metabolomic profiles analyzed by proton nuclear magnetic resonance (1H-NMR) spectroscopy. (a)orthogonal partial least squares discriminant analysis (OPLS-DA) scatter plot of urine samples based on esophageal cancer (EC) patients (green dots) and healthy controls (HCs) (blue squares); (b) Statistical validation of the corresponding OPLS-DA model by permutation analysis (400 times); (c) Score plots of OPLS-DA prediction model. 80% of samples were applied to construct the model, which was used to predict the remaining 20% of samples [testing set, 8 HCs (gold diamonds);8 EC patients (red triangles)]; B: Pattern recognition of tissue metabolomic profiles analyzed by 1H-NMR spectroscopy. (a) OPLS-DA scatter plot of EC tissue samples obtained (purple inverted triangles) and adjacent noncancerous tissue (orange pentagons); (b) Statistical validation of the corresponding OPLS-DA model by permutation analysis (400 times); (c) Score plots of OPLS-DA prediction model, with 80% of the samples applied to construct the model, which was used to predict the remaining 20% of samples [testing set, 4 EC tissues (green hexagons); 4 adjacent non-cancerous tissues (blue crosses)].
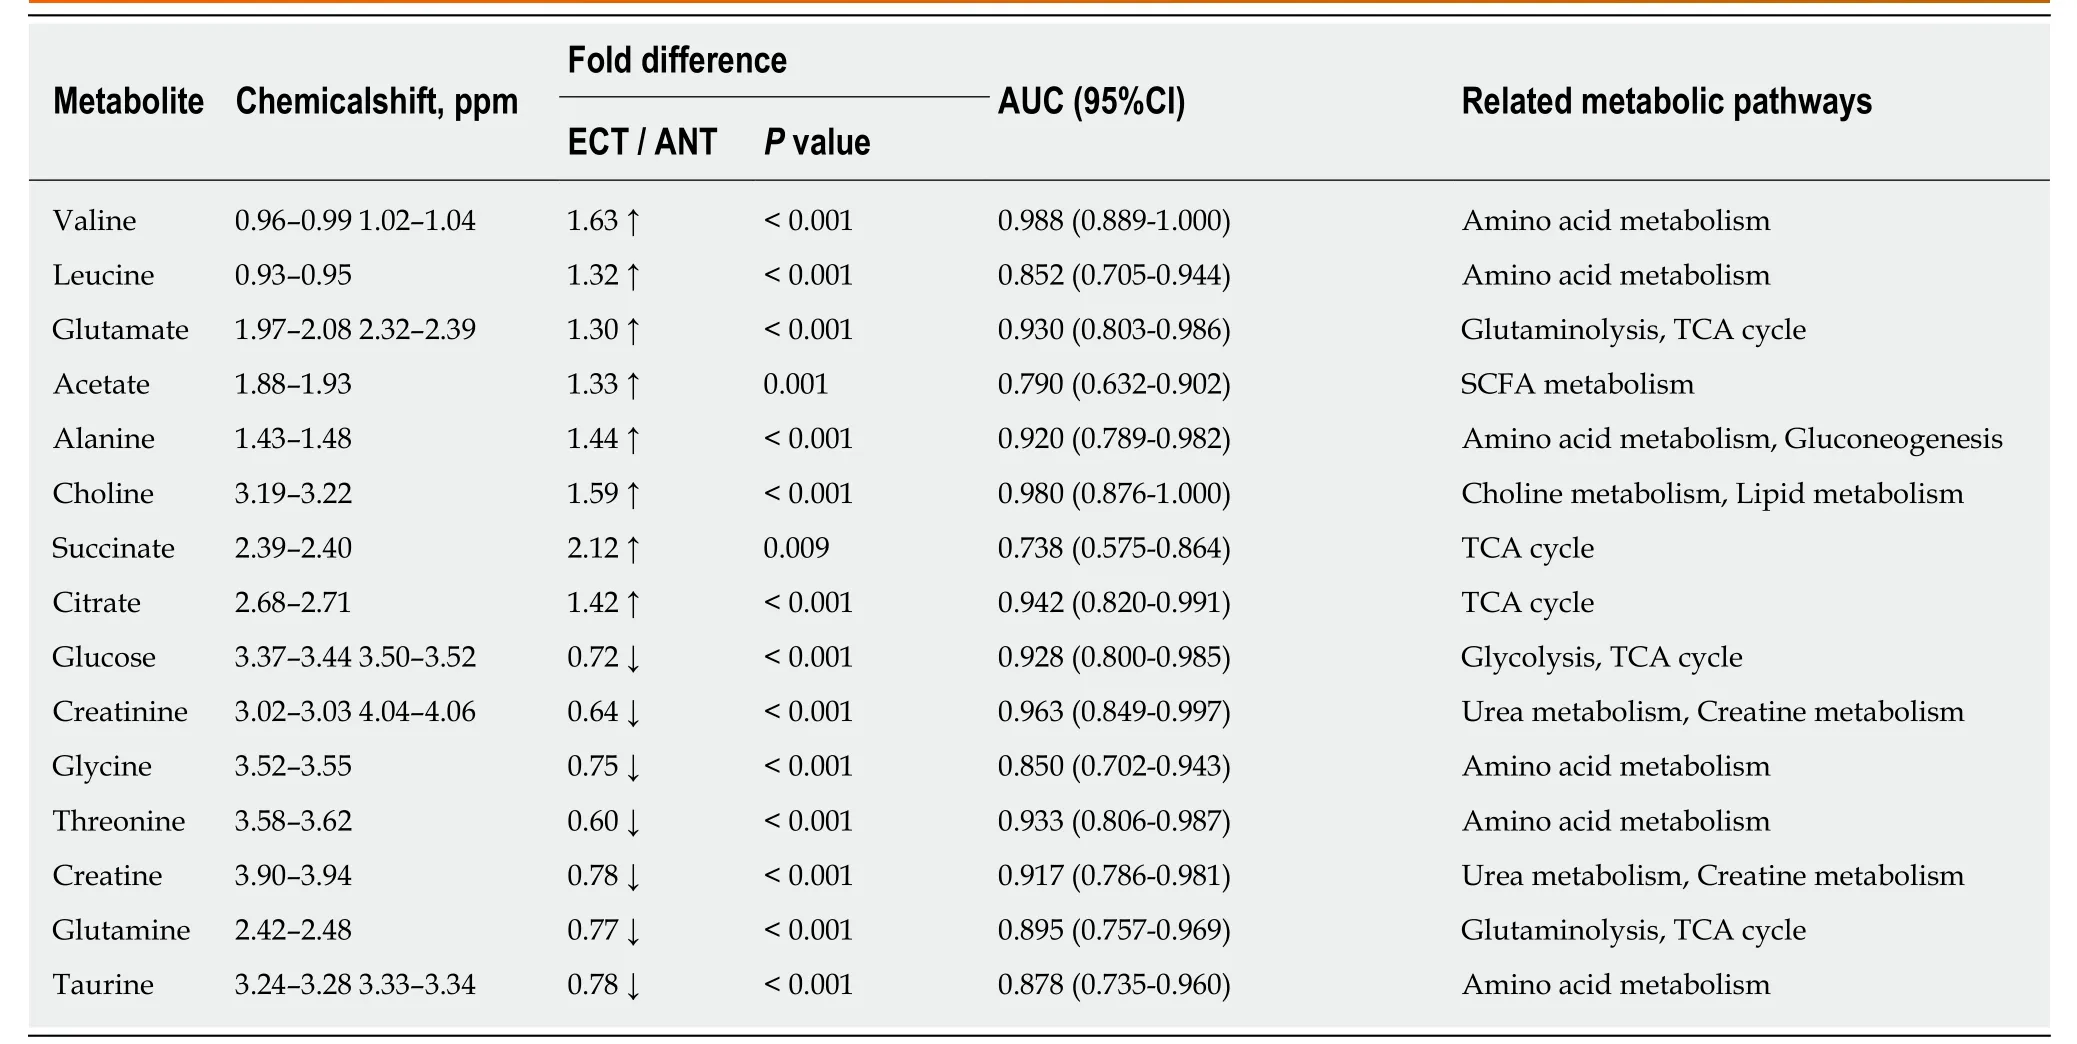
Table 3 Potential tissue biomarkers for discriminating esophageal cancer tissue from adjacent noncancerous tissue
In addition to specific metabolite differences between tumor tissues and urine in EC patients and HCs, we also evaluated the relationships between the metabolic networks in both tissues and urine. Decreased metabolite levels of glucose, glycine,creatinine and taurine, as well as increased citrate and glutamate in EC tissues, were also detectable in the urine of EC patients. These distinct and overlapping metabolites may reflect tumor cell shedding and represent metabolic pathway aberrations across both matrices. This potentially reveals linkages to disturbances of fatty acid metabolism, glucose and glycolytic activity, TCA cycle and glutaminolysis associated with tumor proliferation. Correlative analysis of metabolic profiling between EC tissues and urine showed that changes in most potential urinary biomarkers were correlated with changes in most biomarker candidates in EC tissues, implying enhanced energy production required for rapid cell proliferation. Creatinine was found to be the most sensitive predictor of EC in urine metabolite, with an AUC of 0.790. Overall, these associations provide evidence of distinct metabolic signatures and pathway disturbances across both matrices, and changes in urinary metabolic signature could reflect the EC tissue microenvironment.
In conclusion, our parallel investigations of EC patients through1H-NMR metabolomics revealed a great number of altered metabolites and metabolic pathway networks in EC patient urine and tumor tissues compared with HCs. We identified a few overlapping discriminatory metabolites across both matrices, derived from fatty acid metabolism (taurine and glycine), as well as metabolites (e.g., glucose, glutamate,citrate and creatinine) involved in glucose and glycolytic metabolism, the TCA cycle and glutaminolysis. Correlative analysis of metabolic profiling across tumor tissues and urine in EC patients showed that changes in most potential urinary biomarkers were correlated with changes in most candidate biomarkers in EC tissues, implying enhanced energy production required for rapid cell proliferation. In summary, these associations provide clear evidence of different metabolic signatures and metabolic pathway disturbances between EC tissues and urine, and changes in urinary metabolic signatures could reflect the EC tissue microenvironment. Our study highlighted the significance of the distinct urinary metabolic profile as a potential noninvasive indicator of EC detection. Further investigation is needed to validate these initial findings using larger samples and to establish the mechanism underlying EC progression.
ACKNOWLEDGMENTS
The authors thank Ju-Rong Yang for kindly providing us with the NMR experimental setting and Dr. Hong-Jun Luo for handling of tissue samples.

Figure 4 Comparison of single and combined metabolites receiver operating characteristic curves for distinguishing esophageal cancer patients from healthy controls.
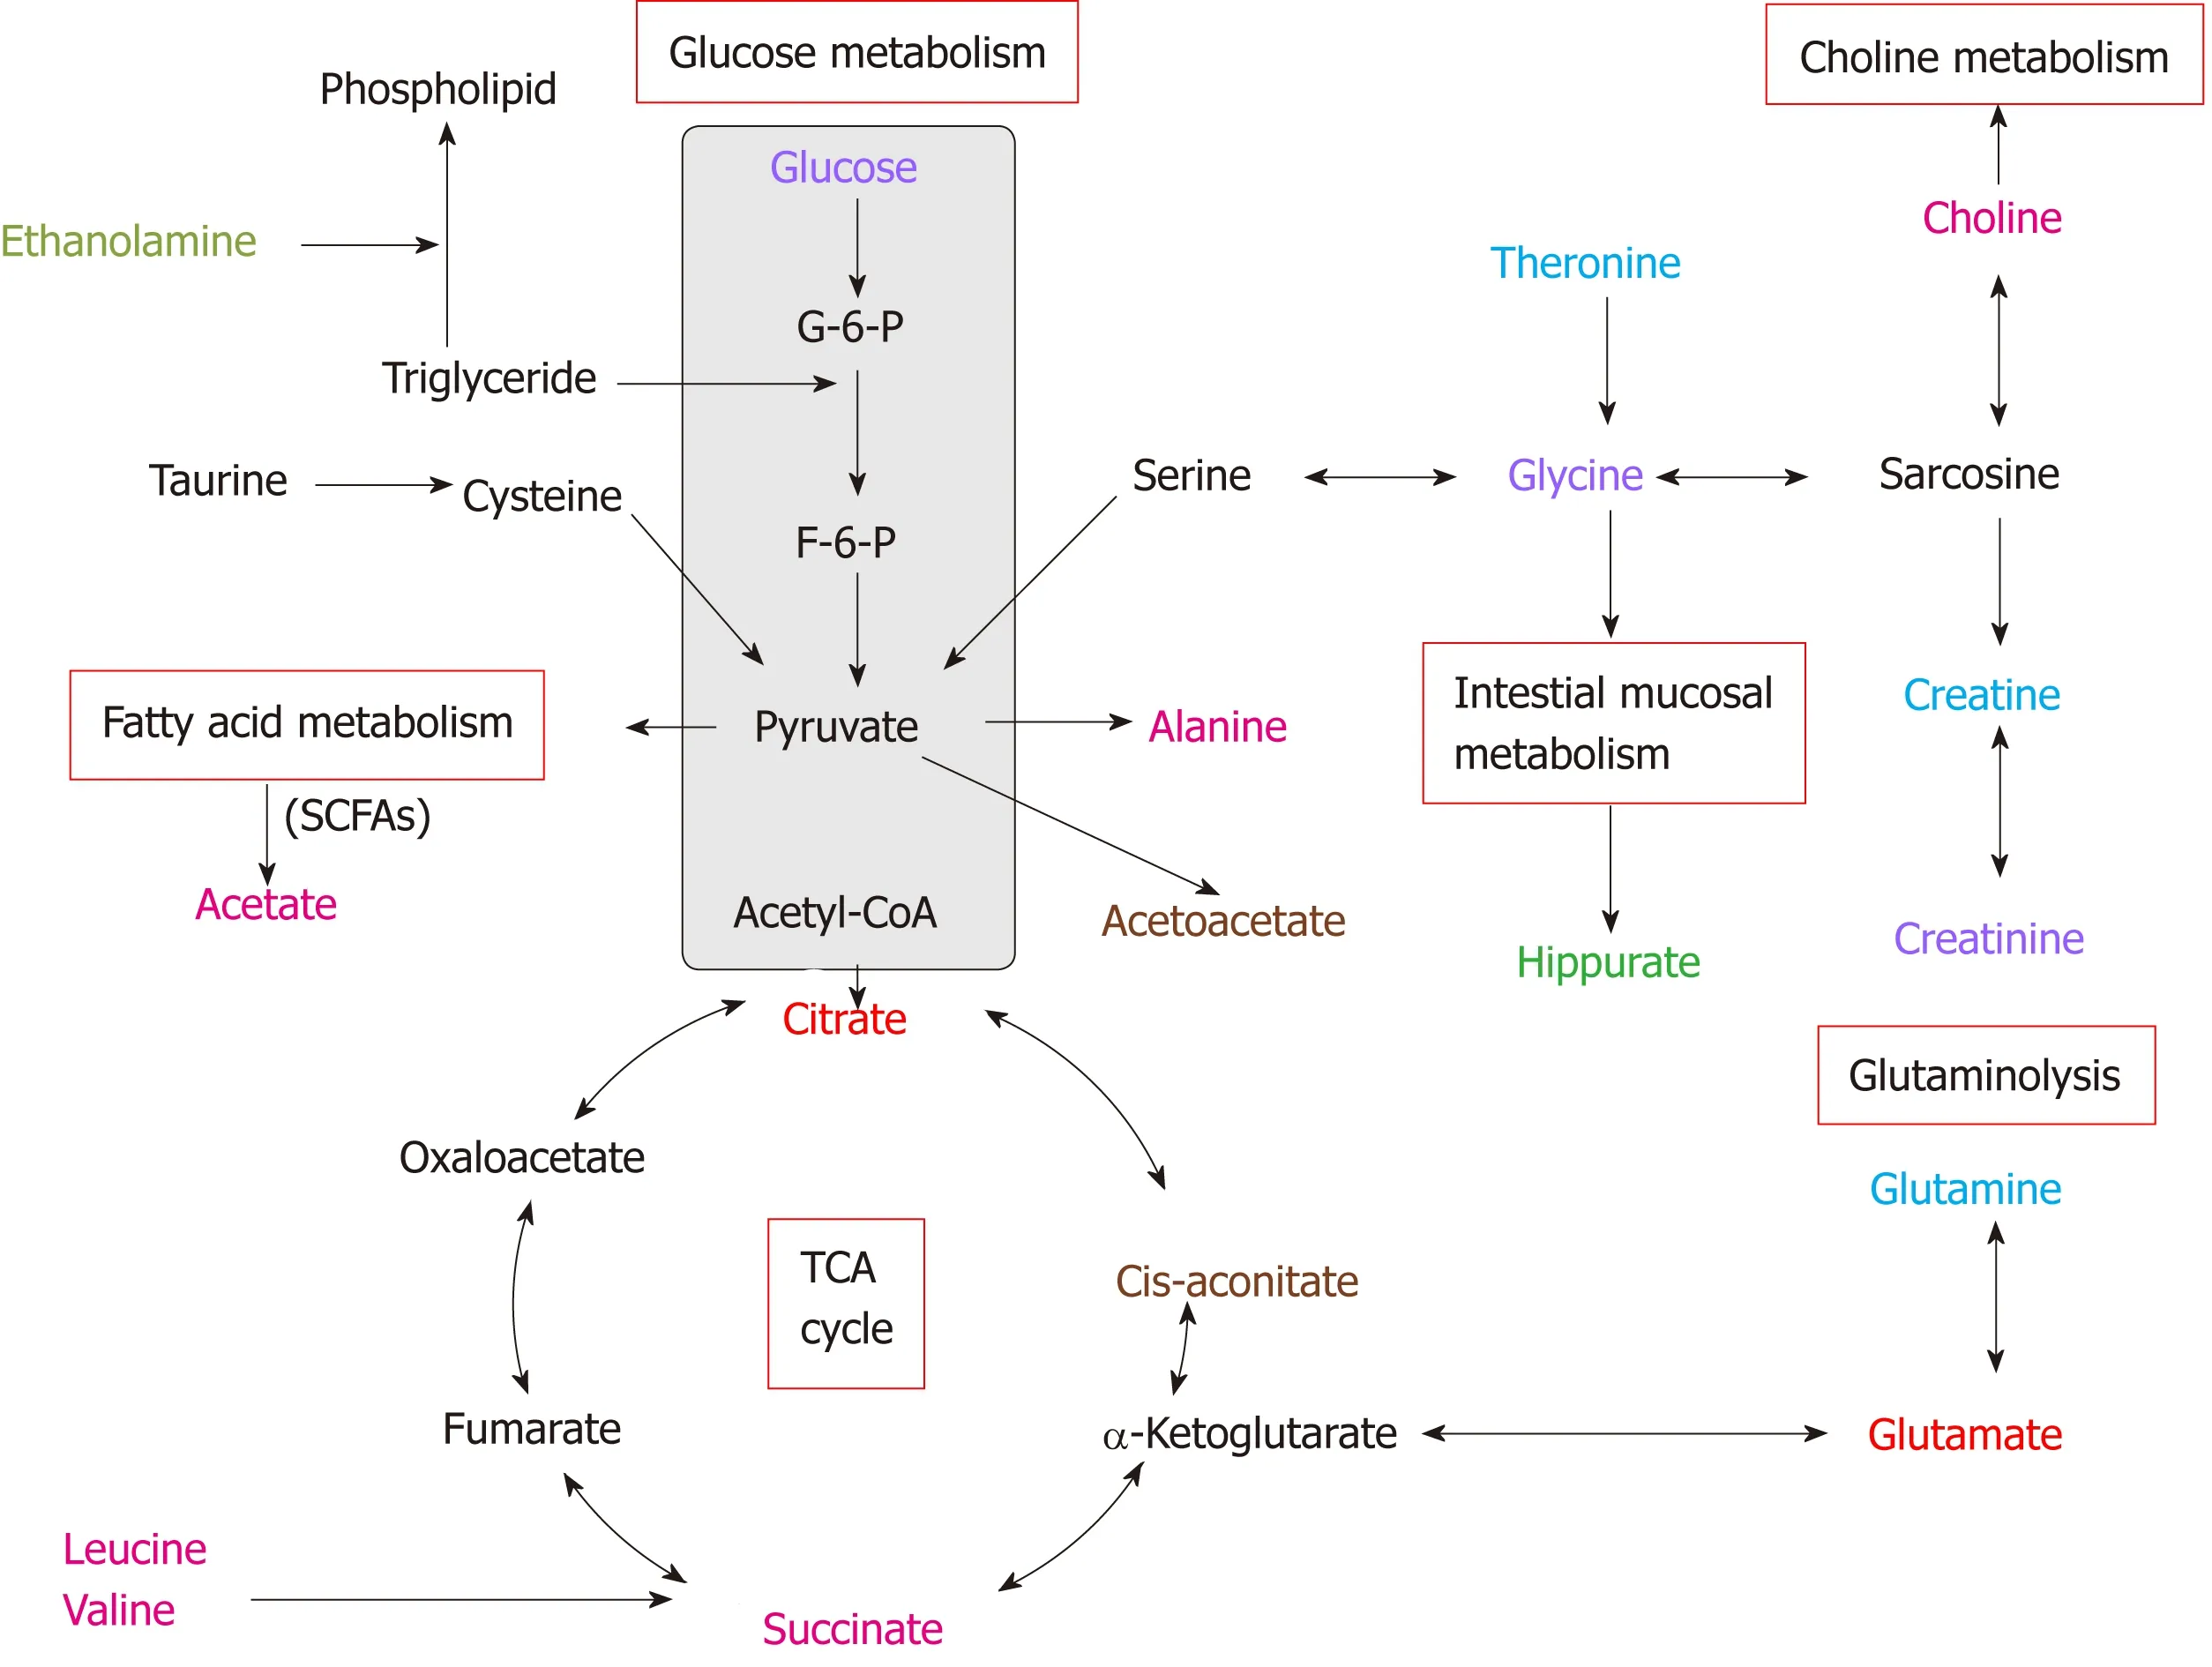
Figure 5 Altered metabolic pathways for the most relevant distinguishing metabolites (potential biomarkers) in urine and tissue samples between esophageal cancer patients and healthy controls. Red text: Increased with respect to control in both esophageal cancer (EC) patient tissue and urine; pink text:Increased with respect to control in EC tissue; orange text: Increased with respect to control in EC patient urine; purple text: Decreased with respect to control in both EC patient tissue and urine; blue text: Decreased with respect to control in EC tissue; green text: Decreased with respect to control in EC patient urine.
ARTICLE HIGHLIGHTS
Research background
A large number of studies have revealed changes of urinary metabolites between esophageal cancer (EC) and healthy controls (HCs), and some studies have demonstrated a correlation between EC and perturbed urinary metabolomic profiles.
Research motivation
However, none of the previous studies has described the correlation between urine metabolite profiles and those of the tumor and adjacent colonic mucosa in the same patient. Our study revealed a significant number of altered metabolites and metabolic pathway networks in EC patient urine and tumor tissues compared with HCs.
Research objectives
Our work is the first parallel investigation of esophageal tumor tissues and adjacent normal mucosal tissues alongside patient-matched urine samples to investigate how urinary metabolic phenotypes were linked to changes in the biochemical landscape of esophageal tumors.
Research methods
All samples were detected by a Bruker AVII 400 MHz nuclear magnetic resonance spectrometer,and all spectral data were applied to pattern recognition analysis and cross-validation by SIMCA-P software. Then, statistical significance was assessed using the Mann-Whitney U test and receiver operating characteristic analysis to calculate biomarker metabolites. Finally, we employed Pearson Correlation Analysis to assess the associations of biomarker candidates between urine and tumor tissues of EC patients.
Research results
Our study revealed metabolite changes that overlapped across both metrics, including glucose,glutamate, citrate, glycine, creatinine and taurine, indicating the networks for metabolic pathway perturbations in EC. Additionally, changes in most urinary biomarkers were correlated with changes in biomarker candidates in EC tissues.
Research conclusions
Our research is the first parallel investigation to investigate how urinary metabolic phenotypes were linked to the changes in the biochemical landscape of esophageal tumors. Our study showed significant metabolic alterations in both urine and tumor tissues of EC patients compared to their respective HCs. Our research revealed a few distinct and overlapping discriminatory metabolites, suggesting that EC is associated with the following dysregulated metabolic pathway perturbations. Furthermore, the metabolic profiling correlations between esophageal tissues and urine showed that most urine potential biomarkers were correlated with most of the discriminating metabolites in EC tissues, indicating that changes in the urine metabolic signature could reflect reprogramming of metabolic pathways in tumor tissue, highlighting the significance of the distinct urinary metabolic profiles as potential novel and noninvasive indicators for EC detection.
Research perspectives
With experiences in our study, we realized that many metabolites have associations in samples of cancer patients. In our same group, we are now investigating the serum samples of EC patients to see whether the same pattern of serum levels of amino acids can be found in EC patients.
 World Journal of Gastroenterology2019年25期
- World Journal of Gastroenterology的其它文章
- Retraction Note: Construction of Gpm6a/ReelinGFPCreERT2 by BAC recombination using a specific gene in hepatic mesothelial or stellate cells
- Botulinum toxin injections after surgery for Hirschsprung disease:Systematic review and meta-analysis
- Assessing significant fibrosis using imaging-based elastography in chronic hepatitis B patients: Pilot study
- Gut microbiota contributes to the distinction between two traditional Chinese medicine syndromes of ulcerative colitis
- Silicone-covered biodegradable magnesium stent for treating benign esophageal stricture in a rabbit model
- Sporamin suppresses growth of xenografted colorectal carcinoma in athymic BALB/c mice by inhibiting liver β-catenin and vascular endothelial growth factor expression