
Arterial traffic signal coordination modelconsidering buses and social vehicles
2020-07-20 09:20:30ZhangWeihuaLiJunDingHeng
Zhang Weihua Li Jun Ding Heng
(School of Automotive and Transportation Engineering, Hefei University of Technology, Hefei 230009, China)
Abstract:Considering the difference in driving parameters of buses and social vehicles on the arterial, an arterial traffic signal coordination model that takes into account social vehicles and buses on the basis of the maximum bandwidth is proposed. By using the pre-set parameters of a common cycle, green/red duration and known parameters of bus dwell time distribution, link length and vehicle speed and solving the mixed-integer-linear programming and optimizing the signal offsets, the model obtains the signal control parameters of the green bands both of social vehicles and buses. Finally, taking Wangjiang Road in Hefei as an example, simulation and evaluation are carried out by VISSIM. The results show that the new model has 15.2% and 13.2% reduction in average person delay and number of stops, respectively, compared with the traditional coordinated control method.
Key words:arterial coordination control; buses coordination; maximum bandwidth; mixed-integer-linear programming
The arterial of the city bears the traffic demand between the main areas, and its traffic efficiency status affects the traffic condition of the whole road network. Therefore, improving the traffic efficiency of arterial is of great significance. The existing theoretical and practical results show that by coordinating and optimizing the signal control of adjacent intersections on an arterial, the stopping time of vehicles can be reduced, and the traffic on the main road can be more efficient.
At present,the most common method to coordinate urban arterial signals is the least delay method or the maximal progression bandwidth. Closely spaced traffic signals along an arterial are typically coordinated by a typical cycle length and appropriate offsets to minimize the delay and reduce the number of stops. Such platoons of vehicles can travel along the entire arterial without stopping. The width of the band is called bandwidth. By maximizing the inbound and outbound bandwidths along an arterial, the total delay and the number of stops can usually be minimized. Many engineers favored maximizing the progression band method, which allows us to know the quality of coordination control from the space-time diagram. Several researchers have conducted some studies on bandwidth optimization for traffic progression. Little et al.[1]first proposed the MAXBAND model using the mixed-integer-linear programming model for arterial signals control. Gartner et al.[2]proposed a multi-band approach to generate a variable bandwidth progression considering the actual traffic volumes and flow capacities on each link. Li[3]proposed a two-stage method that solves the MAXBAND model controlled by a parameter and generates multiple optimal, and then the generated scenarios are evaluated and ranked according to their reliability. Moreover, some researchers[4-5]improved the classical algebraic method to adapt to different traffic scenarios. Tang et al.[6]proposed an improved multiband model, which enhanced the green band flexibility that can be adapted to the arterials with more intersections. To deal with the arterial with variable lanes, Gao et al.[7]proposed a coordinated control method of signals.
Public transportation plays an important role in improving traffic conditions due to the significant advantage of transport capacity. Although some researchers have conducted some studies on signal controls for bus priority, these studies always focused on isolated signalized intersections[8-9]. Li et al.[10]proposed a comprehensive benefit optimization model which comprehensively considers cars and buses. Wang et al.[11]proposed a two-layer optimization method for bus priority without destroying the progression band. Dai et al.[12-14]proposed the bandwidth optimization models. Xu et al.[15]proposed algorithms for signal priority treatment and recovery to meet vertical equity requirements. The algorithms based on three types of traffic detectors and time windows for the green extension, phase insertion, and early green were defined to generate and cancel priority requests conditionally. Li et al.[16]proposed a method to predict bus travel times dynamically based on the Chongqing RFID electronic license plate data.
Bandwidth-based approaches are primarily designed for fixed-time signalized arterials. Considering that the trajectory of buses is different from that of social vehicles, and passenger cars are the main components of social vehicles, this paper divided them into different progression bands according to the model. This paper uses classical MAXBAND to implement bus-relevant improvements, and proposes a new progression model for cars and buses to coordinate traffic signals along urban arterials.
1 Model Formulations
1.1 Control objective
There are many traffic parameters with a mix of buses and social vehicles along an arterial. Differently from the driving state of social vehicles alone on the main road, the bus has to dwell based on the need for passengers to get on or off the bus. The operation parameters (speed, acceleration) of the bus are also different from those of the social vehicle due to the different functions of the vehicle and its performance. Therefore, the bus trajectory is significantly different from that of social vehicles.
Considering the diversion of buses and social vehicles at links, this study develops a progression model with the major inputs of pre-set cycle length, green splits, bus dwell time, link length, and vehicle speed. The proposed model is formulated with a mixed-integer-linear programming method, which optimizes the signal offsets to yield the maximal bandwidths for both buses and social vehicles. Following the same notion as the MAXBAND signal progression model, one can formulate the objective function as follows:
(1)

1.2 Bandwidth constraints
To ensure that the green bandwidth does not exceed the available green time, the first interference constraints are
wc,i+bc≤gi,wb,i+bb≤gi
(3)

Fig.1 Space-time diagram showing green bands

The second set of constraints, the progression constraints, are specified to ensure that the signals do not stop the buses and cars during the green bands. Each constraint aims to limit the differences between the centers of the inbound or outbound bands in each pair of neighboring intersections. As shown in Fig.1, the progression constraints for the links of cars can be expressed as follows:
θi+wc,i+tc,i=θi+1+wc,i+1+nC
(4)
(5)
Differently from the design of progression for cars, a bus may need to dwell at a bus stop for a short time when traveling between intersections. Hence, a green band designed for buses should fully reflect the impact of its dwelling time. The progression constraints for the links can be written using similar expressions:
θi+wb,i+tb,i+τi=θi+1+wb,i+1+nC
(6)
(7)
Also, we constrain changes of speed by putting upper and lower limits on changes in reciprocal speed.
(8)

(9)

In brief, the optimization model is summarized as follows:
s.t. Eqs.(2) to (9)
(10)
Note that the proposed model is formulated with mixed-integer-linear-programming formulations. It can be solved by existing algorithms, such as the Branch-and-band technique, or solved with software directly (such as LINGO, CPLEX).
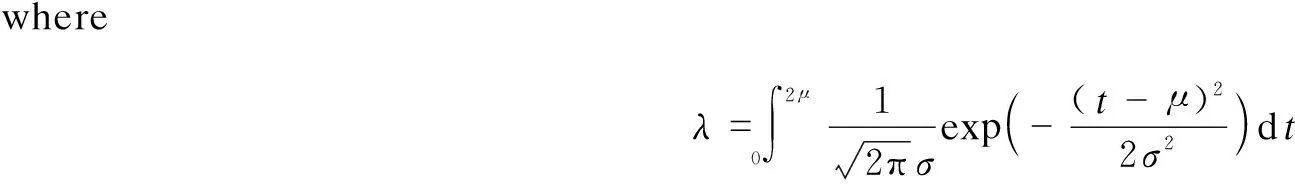
In the model,buses’ dwelling time at a stop is a fixed value, which does not conform to the actual traffic conditions. Assuming that the dwelling time of buses at a stop follows a normal distribution, the probability of dwelling time can be expressed as
(11)
whereμandσare the average value and variance of buses’ dwelling time at a stop, which can be obtained by field investigation. Then, considering that the bus’ dwelling time is greater than zero, as shown in Fig.2(a), the probability of dwelling time can be expressed as follows:
(12)
(13)
As shown in Fig.2(b), when the actual dwelling time of a bus is less than the design time, the bus will reach a downstream intersection earlier than the end of green time. The delay caused by signal control isτ-t. When the actual dwelling time of a bus is greater than the design time, the bus will miss the green time at the next intersection. The delay caused by signal control isri+1-t+τ. Then, the average delay of buses is
(14)

(a)
whereτis an independent variable andDis a dependent variable. WhenDreaches the minimum value,τis the dwelling time of the buses, which is used to design the green band. It can be solved as ?D/?τ=0, and the solution is
(15)
As shown in Fig.3, cars and buses pass the upstream intersection at the green time. The cars will follow their normal speed along with the link to the next intersection, but the buses will decelerate, dwell, and accelerate at the bus stop. Therefore, there will be two schemes when splitting the green progression band, as shown in Fig.4. In Scheme A, cars and buses are released at the same green time at the upstream intersection, but buses will pass the downstream intersection one cycle later than cars. The scheme is suitable for the case where the link is long or the bus dwelling time is long. In Scheme B, cars and buses pass the two intersections at the green time of the same cycle. The scheme is suitable for the case where the link is short or the bus dwelling time is short.

Fig.3 The difference between buses and cars in the link

(a)
The choice of the two schemes is determined by many factors such as the length of the link, buses’ dwelling time at the stop, the speed difference between cars and buses, etc. The selection factor can be expressed as follows:
(16)
whereηis the selection factor of two schemes;vc,i(vb,i) is the average speed of cars (buses) from intersectionito intersectioni+1;εis the other’s delay caused by other factors.
The traffic control engineer selects a scheme of a link that should be based on the actual traffic conditions. According to Eq.(16), the value of the scheme selection coefficient in the link can be obtained. The value ofηbeing smaller indicates that the time difference between the two vehicles arriving at the next intersection is smaller than the period. The delay caused by the adoption of Scheme B on the road section is shorter.
The selection of a scheme should provide a basis for the limits of the two-vehicle speeds in the model. Generally, Scheme A is adopted whenηis greater than 0.5, and the limits of the speeds should be satisfied:
(17)
Scheme B is adopted whenηis less than 0.5, and the limits of the speeds should be satisfied:
(18)
2 Numerical Examples
To illustrate the efficiency of the proposed model, this study takes an arterial segment, named as Wangjiang Road, in Hefei, for the case study. As shown in Fig.5, the experimental system for performance evaluation consists of six intersections, five connecting links, and ten bus stops. Geometry features are shown in Tab.2, and the traffic volumes at intersections of cars and buses are listed in Tabs.3 and 4.

Fig.5 Scene of Wangjiang Road

Tab.2 Parameters of the studied arterial segment

Tab.3 Traffic volumes of the car at intersections along Wangjiang Road pcu/

pcu/h
The Webster signal equation is used to calculate the signal timing of a single intersection and the common cycle length of the six intersections is 132 s. The critical traffic patterns and critical parameters are shown in Tab.5.
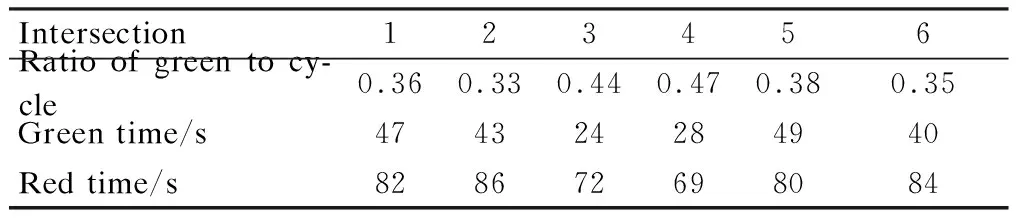
Tab.5 The key parameters used in the signal control
The hourly traffic volumes are obtained through the investigation, but how many passengers are in every vehicle is not clear. Therefore, the loading factors of passenger cars and buses are assumed to beρc=2 andρb=20 persons. This study conducts comparisons for the following three models, Webster, MAXBAND, and the proposed model, to evaluate the progression model’s effectiveness.
According to the survey data, the simulation sets the expected speed of cars and buses to be 40 and 35 km/h. After the selection of schemes for links, it is confirmed that links 2 and 5 adopt Scheme A; links 1, 3 and 4 adopt Scheme B. LINGO was used to solve the model, and the parameter values are shown in Tab.6.

Tab.6 The key parameters used in the signal control
The diagrams of the proposed model and MAXBAND are shown in Fig.6. To further illustrate the applicability and efficiency of the proposed model, a one-hour length and four measures of effectiveness are selected for model assessment. The average number of bus stops, average number of car stops, average bus delay, and average car delay are analyzed by using VISSIM software. The results are shown in Fig.7 and Tab.7.

(a)

Tab.7 The summary of performance under different models.

(a)
The simulation results show that the delay and number of stops of the vehicles will be significantly reduced after coordinated arterial control. For single intersection control, a smaller cycle length will have a lower delay for the vehicles at the intersection, but there is no significant change in the number of stops. Compared with the single intersection control, the proposed model reduces the number of stops and delay by 34.3% and 36.9%, respectively. Compared with the MAXBAND control model, the proposed model has lost the traffic efficiency of social vehicles and obviously improves the buses’ efficiency. Overall, the number of stops and per person delay in an arterial are decreased by 15.2% and 13.2%, respectively.

Fig.8 The reduction of average person delay by the proposed model compared to MAXBAND
To test the benefits of the proposed model over MAXBAND with respect to different values of the ratio (ρb/ρc), Fig.8 shows the reduction of average per person delay under different scenarios. Based on the data, we know that the target arterial can benefit from the proposed progression model in terms of reducing the average person delay when the ratioρb/ρcis larger than 4. Based on the results, we can conclude that the proposed model has more advantages with the increase in the proportion of bus passengers.
3 Conclusions
1) Considering that the driving trajectory of buses is quite different from the social vehicles, this paper proposed a mixed-integer-linear programming model for arterial traffic signal coordination to obtain the green bands of the car and bus.
2) This paper takes an arterial with six intersections and ten bus stops as an example, and employs VISSIM as an unbiased tool for model evaluation. The simulation results indicate that the public transportation system can benefit significantly from this signal model. Compared to the conventional progression model for cars (MAXBAND), the proposed model can significantly reduce the number of stops and per person delay by 15.2% and 13.2%, respectively.
3) Assuming thatρcandρbare 2 and 20, respectively, the proposed model is superior to MAXBAND.By testing different values ofρb/ρc, the results show that the target arterial can benefit from the proposed progression model in terms of reducing the average person delay when the ratioρb/ρcis larger than 4. We can conclude that the proposed model has more advantages with the increase in the proportion of bus passengers.
 Journal of Southeast University(English Edition)2020年2期
- Journal of Southeast University(English Edition)的其它文章
- Online SOC estimation based on modified covariance extended Kalman filter for lithium batteries of electric vehicles
- Diagonal crossed product of multiplier Hopf algebras
- Consumers’ privacy data sharing between the seller and the e-commerce platform
- Influence evaluation of titania nanotube surface morphology on the performance of bioelectrochemical systems
- A customized extended warranty policy with heterogeneous usage rate and purchasing date
- Prediction method of restoring force based on online AdaBoost regression tree algorithm in hybrid test