
Arctic multiyear sea ice variability observed from satellites: a review*
2020-07-31 07:09:36BIHaiboLIANGYuWANGYunheLIANGXiZHANGZehuaDUTingqinYUQinglongHUANGJueKONGMeiHUANGHaijun
BI Haibo , LIANG Yu WANG Yunhe , LIANG Xi , ZHANG Zehua DU Tingqin , YU Qinglong , HUANG Jue , KONG Mei , HUANG Haijun
1 CAS Key Laboratory of Marine Geology and Environment, Institute of Oceanology, Chinese Academy of Sciences, Qingdao 266071, China
2 Laboratory for Marine Geology, Qingdao National Laboratory for Marine Science and Technology, Qingdao 266200, China
3 Center for Ocean Mega-Science, Chinese Academy of Sciences, Qingdao 266071, China
4 University of Chinese Academy of Sciences, Beijing 100049, China
5 Shandong Academy of Environmental Science Co., Ltd., Jinan 250013, China
6 National Marine Environmental Forecasting Center, Beijing 100081, China
7 Shandong University of Science and Technology, Qingdao 266590, China
8 Shandong Provincial Eco-environment Monitoring Center, Jinan 250101, China
Abstract In comparison with seasonal sea ice (fi rst-year ice, FY ice), multiyear (MY) sea ice is thicker and has more opportunity to survive through the summer melting seasons. Therefore, the variability of wintertime MY ice plays a vital role in modulating the variations in the Arctic sea ice minimum extent during the following summer. As a response, the ice-ocean-atmosphere interactions may be signifi cantly affected by the variations in the MY ice cover. Satellite observations are characterized by their capability to capture the spatiotemporal changes of Arctic sea ice. During the recent decades, many active and passive sensors onboard a variety of satellites (QuikSCAT, ASCAT, SSMIS, ICESat, CryoSat-2, etc.) have been used to monitor the dramatic loss of Arctic MY ice. The main objective of this study is to outline the advances and remaining challenges in monitoring the MY ice changes through the utilization of multiple satellite observations. We summarize the primary satellite data sources that are used to identify MY ice. The methodology to classify MY ice and derive MY ice concentration is reviewed. The interannual variability and trends in the MY ice time series in terms of coverage, thickness, volume, and age composition are evaluated. The potential causes associated with the observed Arctic MY ice loss are outlined, which are primarily related to the export and melting mechanisms. In addition, the causes to the MY ice depletion from the perspective of the oceanic water inflow from Pacifi c and Atlantic Oceans and the water vapor intrusion, as well as the roles of synoptic weather, are analyzed. The remaining challenges and possible upcoming research subjects in detecting the rapidly changing Arctic MY ice using the combined application of multisource remote sensing techniques are discussed. Moreover, some suggestions for the future application of satellite observations on the investigations of MY ice cover changes are proposed.
Keyword: multiyear sea ice; Arctic Ocean; satellite observation
1 INTRODUCTION
Sea ice is generally featured with a high albedo (Robock, 1980; Allison et al., 1993; Curry et al., 1995; Perovich, 2018; Thackeray and Hall, 2019), reflecting most of the solar energy back to space. The insulating properties of sea ice affect the energy exchange between ocean and atmosphere (Ledley, 1985; Orsolini et al., 2012; Deser et al., 2015, 2016; Smith et al., 2017; Wang et al., 2019a). The reduction of sea ice leads to the increased heat and moisture fluxes between the ocean and the atmosphere and enhanced absorption of solar radiation toward the ocean. When MY ice melts, more freshwater is released to alter the ocean stratifi cation. Furthermore, the changes in the Arctic sea ice impose the effects on the polar ecosystems (Thomas and Dieckmann, 2002; Smetacek and Nicol, 2005; Schofi eld et al., 2010), navigation routes (Ho, 2010; Khon et al., 2010; Lei et al., 2015; Pizzolato et al., 2016), coastal erosion (Jones et al., 2009; Overeem et al., 2011), hunting life of indigenous people (Alexander et al., 2011).
The Arctic sea ice is generally comprised of the two components: the fi rst-year (FY) ice and the multiyear (MY) ice (Massom and Comiso, 1994; Lindell and Long, 2016b). Normally, the MY ice is referred to as the sea ice that survives at least one summer melt season. Compared with the FY ice, the MY ice shows a higher reflectance (Perovich et al., 2002), making it a climatically more influential factor (Vincent, 2010; Comiso, 2012; Overland et al., 2014, 2019). Besides, the MY ice with a greater thickness tends to be more mechanically stable, and sea vessels will take more risks when it floats through the MY ice pack than the FY ice. As the MY ice in the Arctic Ocean is declining at a signifi cant rate, approximately -9%– -15%/decade in the past three decades (Comiso, 2012; Polyakov et al., 2012; Kwok, 2018), the MY ice area has declined from about two-thirds of the Arctic basin area to less than one third (Galley et al., 2016). Along with the signifi cant decrease in the MY coverage and extent, there is also a clear transitioning trend in MY composition toward the thinner and younger components (Rigor and Wallace, 2004; Maslanik et al., 2007, 2011; Tschudi et al., 2016).
The melting of the MY ice, compared to the melting of FY ice with the same coverage, may release more freshwater to the ocean and affects the ocean stratifi cation more substantially (Perovich et al., 2008; Toole et al., 2010; Jackson et al., 2012). In addition, the vast retreat of MY ice leads to greater ice mobility in the Arctic Ocean (Spreen et al., 2011; Zhang et al., 2012; Kwok et al., 2013; Olason and Notz, 2014; Durner et al., 2017). Overall, the fluctuations in the Arctic MY ice cover are suggestive of a signifi cant influence on the regional and global climate changes (Meier et al., 2014). With the rapid depletion of the MY ice, the Arctic Ocean is expected to experience ice-free summers soon (Wang and Overland, 2012). The area loss of the Arctic sea ice will have profound consequences on the climate and weather changes in the Northern Hemisphere (Overland and Wang, 2010; Liu et al., 2012a, b; Francis, 2013, 2015; Screen et al., 2013, 2014; Tang et al., 2013; Peings and Magnusdottir, 2014; Francis and Vavrus, 2015; Gao et al., 2015; Luo et al., 2016; Overland et al., 2016; Screen and Francis, 2016; Screen, 2017).
Normally, the sea ice evolves with the year of age, and the FY and MY ice packs are generally characterized with unique physical properties, as revealed from the differences in surface roughness (Ackley et al., 1974), salinity (Cox and Weeks, 1974), and porosity (Kovacs and Morey, 1986; Tucker et al., 1992). Therefore, an accurate record of the MY ice variations is crucial in understanding the relationship between the overall Arctic sea ice mass balance and climate changes (Kwok, 2004, 2007b, 2018). Satellite observations from the microwave instruments, such as radiometer (passive) and scatterometer (active), have been widely used to inspect the spatiotemporal variations of the MY ice cover (Kwok, 2004, 2007b, 2018; Kwok and Cunningham, 2010; Comiso, 2012; Swan and Long, 2012; Lindell and Long, 2016a, b; Ressel and Singha, 2016; Ye et al., 2016; Lee et al., 2017b; Dabboor et al., 2018). In contrast, the optical satellite image, such as MODIS and Landsat series, has a high spatial resolution up to meters (Griffin et al., 2018; Ji et al., 2018). However, the overlaid snow cover can mask the surface reflectance differences between the FY and MY ice types in the optical imagery (Trepte et al., 2003; Lindsay et al., 2015).
Since the late 1970s, a suite of satellite missions has been launched to operationally inspect the polar MY ice changes from different perspectives (Kwok and Rothrock, 2009; Abdalati et al., 2010; Comiso, 2012; Laxon et al., 2013; Ivanova et al., 2014; Lindsay and Schweiger, 2015; Serreze and Stroeve, 2015; Lindell and Long, 2016a, b). Recently, the combined usage of multisource satellite observations to detect the Arctic MY ice tends to be a new trend since the characteristics of the MY ice floe cannot be fully captured by a sole satellite sensor (Shokr and Agnew, 2013a; Lindell and Long, 2016a, b; Ye et al., 2016). The primary objective of this study is to outline the updated advances and the remaining challenges in monitoring the Arctic MY ice from the satellite measurements. To comprehensively understand the interannual variability and trends of the MY ice cover, the underlying causes associated with the MY ice changes in the Arctic Ocean are reiterated in this review, and some suggestions for the future research subjects are proposed.
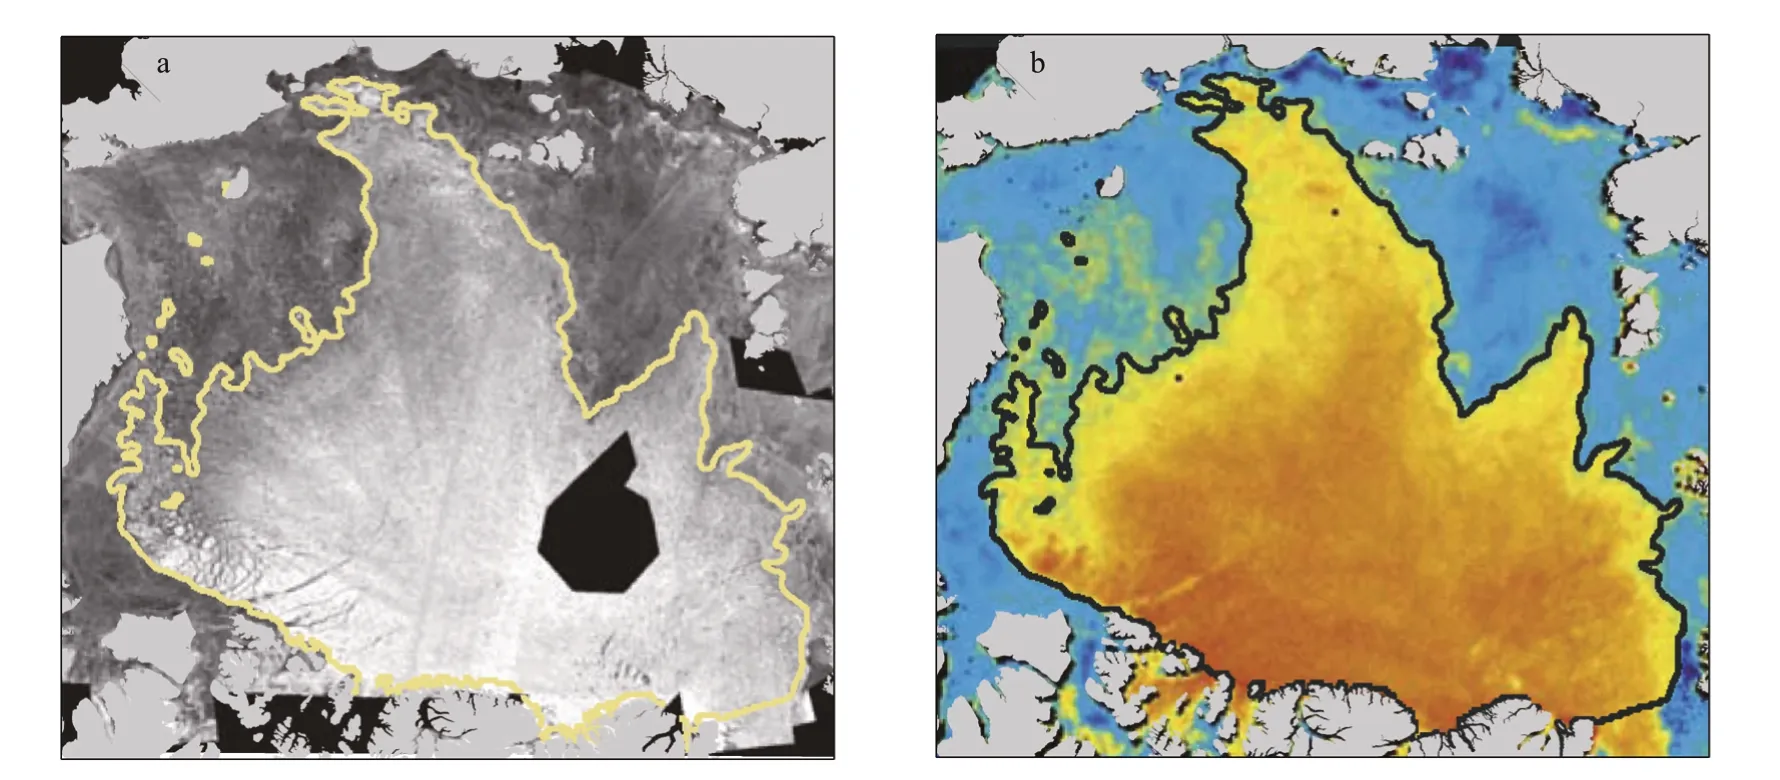
Fig.1 An exemplary map for MY ice classifi cation results overlaid on RARDARSAT (a) and QuikSCAT imagery (b)
In this review, the sources of satellite observations for MY ice are summarized. The methods to identify the MY ice cover and the algorithms to derive MY ice concentration are described in Section 2. The interannual variability and long-term trends for the observed MY ice variables are presented, including MY ice concentration, extent, and area (Section 3), thickness and volume, and age (Section 4). The mechanisms in association with the MY ice variations are outlined from different perspectives (Section 5). Concluding remarks and suggestions are given in the fi nal section.
2 DATA AND METHOD
2.1 Satellite observation
Satellite observations from the active microwave sensors have been broadly used to identify the MY ice in the Arctic Ocean. Among the active sensors, scatterometer (for example, QuikSCAT and ASCAT) is conventional equipment to detect the MY ice (Onstott, 1992; Swan and Long, 2012; Lindell and Long, 2016a, b; Ye et al., 2016). In general, the prominent advantage of these scatterometers is their ability to provide the sea ice backscatter measurements for the whole Arctic daily with a spatial resolution of tens of kilometers.
In the earlier period, the Ku-band SeaWinds scatterometer instrument onboard the QuikSCAT and the Indian Space Research Organization Oceansat-2 (OSCAT) were the common tools to supervise MY ice changes (Lindell and Long, 2016b). The operational mission of the QuikSCAT and OSCAT ceased in 2009 and 2014, respectively. Subsequently, the C-band Advanced Scatterometer (ASCAT) carried by MetOp-A continued to provide the message of Arctic MY ice since 2006 (Lindell and Long, 2016a; Kwok, 2018).
Synthetic aperture radar (SAR) onboard some satellite missions, such as RADARSAT and ENVISAT, serve as an important complementary data source to the medium-resolution observations from scatterometers. The SAR measurements provide more ice details with a fi ner spatial resolution up to several hundred meters, although it has a medium temporal resolution (three days to a week). Based on the SAR observations, the loss of MY ice area due to lateral melting can be determined by tracing the MY ice motion (Kwok and Cunningham, 2010).
Passive microwave (PMW) measurements have also been applied to distinguish the MY ice (Comiso, 2012). However, some assessments demonstrated that the PMW signals from MY ice are not readily stable over time and show a relatively low quality in the classifi cation of MY ice (Thomas, 1993). As a result, the usage of PMW data to detect the MY ice variations is limited among scientifi c communities. Despite this shortcoming, the combined application of the active and passive microwave observations has the potential to reduce the spurious classifi cation of MY ice (Yu et al., 2009; Shokr and Agnew, 2013a; Lindell and Long, 2016a).
2.2 MY classifi cation technique
Figure 1 shows that the MY ice exhibits a brighter backscatter than FY ice since MY ice has a lower brine content in association with reduced electromagnetic absorption and enhanced backscatter. Simply, a threshold-based procedure can be applied to the radar backscatter coefficient ( σ0) to identify the MY ice cover (Swan and Long, 2012). The large contrast of backscatter between FY and MY ice is the physical basis for the application of the simple threshold technique to separate the MY ice from FY ice. In a study by Kwok (2004) MY ice is picked out using a fi xed threshold on QuikSCAT backscatter values. Through the visual inspection of collocated high-resolution RADARSAT imagery, an optimal threshold is determined (-14.5 dB, Fig.1). Similarly, Nghiem et al. (2006) classifi ed the Arctic sea ice by setting fi xed backscatter values for different ice types. However, if sea ice is covered by snow, scattering tends to increase (Hallikainen and Winebrenner, 1992). Therefore, a seasonal adjustment of the threshold value is needed to reduce the effects of snow.
To reduce the influences of the seasonally varied backscatters, Swan and Long (2012) use a timedependent threshold to obtain the classifi cation of MY ice from QuikSCAT data. Validation suggests the classifi cation accuracy is improved, with only a difference of approximately 6% in winters compared with ice charts from the Canadian Ice Service. Similarly, a temporally-adjusted threshold on backscatter values is also applied to OSCAT data. Moreover, the sea ice extent retrieved from passive microwave brightness temperatures is used to eliminate the error classifi cation that appears out of the sea ice cover boundary. Together, a consistent and continued 15-year record of MY ice classifi cation from QuikSCAT and OSCAT extending from 1999 to 2014 is available in the Brigham Young University.
A modifi ed classifi cation method based on a probabilistic model derived with a multivariate Gaussian distribution is proposed by Lindell and Long (2016a). With this method, the C-band backscatter measurements from ASCAT and Special Sensor Microwave Imager/Sounder (SSMIS) brightness temperature at 37-GHz are used to obtain the classifi cation results (Fig.2). It is reported that the use of SSMIS data can further refi ne the classifi cation results in that the misclassifi cations due to the ASCAT’s high sensitivity to rough sea ice patches is reduced. Despite the different sensitivity to sea ice surface physical properties at C-band, the ASCAT classifi cation agrees well with the previous results from Ku-band QuikSCAT and OSCAT data (Lindell and Long, 2016b). Therefore, this further extends the MY ice record to the present (i.e. a time series of MY record from 1999 to 2018). This two-decade record of MY classifi cation helps deepen the interpretation of recent rapid MY decline and the associated climatic responses.
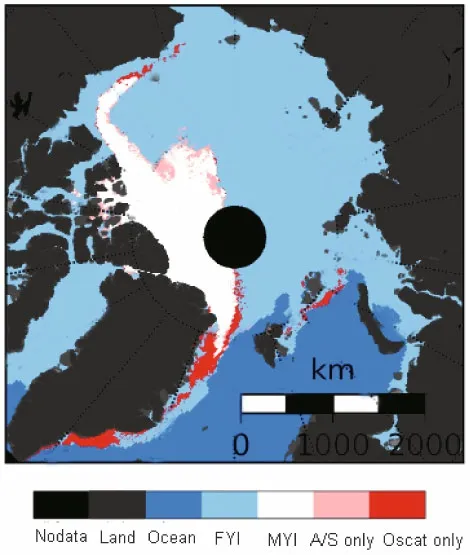
Fig.2 An example of MY ice classifi cation from ASCAT/SSMIS on March 1, 2012
Lee et al. (2017b) made use of the vertically polarized emissivity difference between 10.6 and 18.7 GHz to classify the Arctic MY ice. The great advantage of this method is to obtain the instantaneous and pixel-level ice type information from spaceborne passive microwave measurements. In addition, Rodriguez-Alvarez et al. (2019) employed the bistatic radar reflections from the Global Navigation Satellite System (GNSS) to investigate the Arctic MY ice changes. A strong sensitivity of the L-band GNSS radar signals was found reliable to discriminate the MY ice in Arctic with a daily repeating cycle. Recently, a machine learning approach (Zhang et al., 2019) is established to produce daily sea ice classifi cation of FY and MY ice during winter (November–April) based on QuikSCAT, ASCAT, SSMIS, and Advanced Microwave Scanning Radiometer-2 (AMSR-2). The resulting classifi cations are in good agreement with the results from visual interpretation.
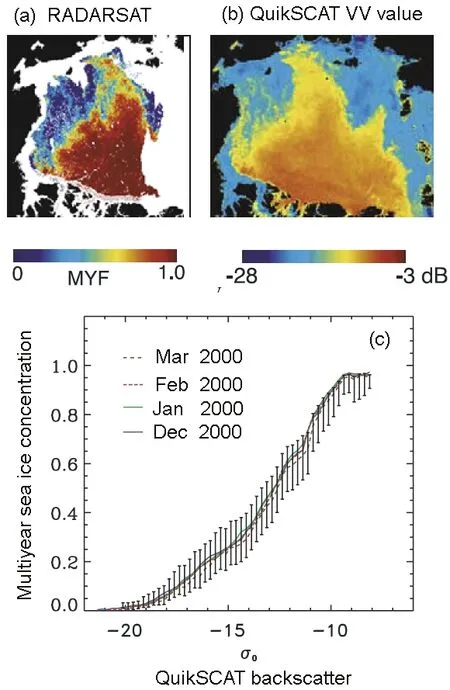
Fig.3 The statistical relationship between the RADARSAT SAR-derived MY concentration and the QuikSCAT VV-backscatter values
2.3 Algorithms to retrieve MY concentration
2.3.1 MY ice concentration derived from passive microwave measurements
Even though the classifi cation of MY ice type has been direct and straightforward, the estimates of MY ice concentration and area are not easy to realize. Before the appearance of QuikSCAT, the MY ice concentration was mostly derived from the passive microwave bright temperatures using the NASA Team (NT) algorithm (Comiso et al., 1997). However, a comparison with the SAR data appears to suggest that the estimate of NT is unreliable (Thomas, 1993). In addition, another year-long comparison with the SAR estimate indicated that the NT-derived MY ice concentrations exhibit a lower and temporally more variable estimate (Kwok et al., 1996). Other studies point to the underestimate from passive microwave data in relative to that from QuikSCAT measurements (Kwok, 2004).
Recently, a series of passive microwave observations (such as EMSR, SSM/I and AMSR-E, AMSR-2, and SSMIS) is explored to derive the MY ice concentration (Comiso, 2012). Through the adoption of seasonally-adjusted tie points of brightness temperature for different surface objects (FY ice, MY ice, and open water), the temporal variability of the satellite observations is minimized. The observed brightness temperature corresponds to the mixture of the three surface objects and thus can be depicted using a linear mixing algorithm (Eq.1).
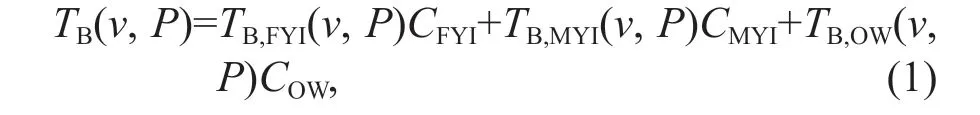
where TB( v, P) denotes the brightness temperature observed by the radiometer at frequency v and polarization P. TB,FYI( v, P), TB,MYI( v, P), and TB,OW( v, P), are the brightness temperature tie points at the similar frequency and polarization for pure FY ice, MY ice, and open water, respectively. CFYI, CMYI, and COWrepresent the concentrations of FY ice, MY ice, and open water, respectively. For each grid, only the three surface types are assumed to exist within it. Accordingly,

Finally, a threshold of 30% is used to reduce the contamination of other undetermined types. Note that the accuracy of the MY fraction estimate is partly related to the tie points selected in the analysis. Comparative results reveal an underestimate of the MY ice concentration derived from the brightness temperatures relative to that retrieved from the scatterometer observations (Thomas, 1993; Kwok et al., 1996).
2.3.2 MY ice fraction derived from scatterometer
An earlier record of the daily MY ice coverage was obtained from QuikSCAT by Kwok (2004). The algorithm was established through the collocated data pairs between the RADARSAT-derived high-resolution MY ice concentration (Fig.3a) and the QuikSCAT backscatter (Fig.3b). The statistical relationship between the two data is illustrated in Fig.3c. The fi tted polynomial algorithm to derive the MY ice concentration from the QuikSCAT backscatter is exhibited in Fig.4. The equation differs depending on backscatter ranges (Eq.3). The algorithm can be formulated as:
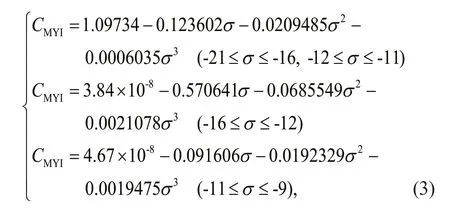
where CMYIis the MY ice concentration, σ is backscatter value. The uncertainty is ±10% in coverage for regimes with a near-even mixture of MY and FY ice, while better quality is found in regions with pure ice, i.e., either FY or MY ice (Kwok, 2004). Based on a similar relationship, the ASCAT acquisitions are further used to obtain the MY ice coverage onward 2006 (Kwok, 2018). However, the contrast between the same MY ice signals collected by QuikSCAT Ku-band and that observed by ASCAT C-band is large. To be specifi c, a lower backscatter value is identifi ed in ASCAT backscatter compared with that of the QuikSCAT data. A particularly evident difference exists for the two backscatters is found over the MY ice concentration range of 0.3–1.0. In contrast, the ASCAT backscatter is greater than the QuikSCAT data within the range of less than 0.3 (not shown). These differences likely lead to an erroneous estimate from the ASCAT-derived MY ice concentration based on the relationship as inferred from the QuikSCAT data (Eq.3). Therefore, the algorithm, as shown in Eq.3 needs to be reformulated to maintain the consistency between the MY ice concentration time series acquired from the QuikSCAT and the ASCAT observations.
3 SATELLITE-OBSERVED CHANGES IN ARCTIC MULTIYEAR SEA ICE COVERAGE
3.1 Passive microwave observation
PMW observations have shown that the Arctic sea ice has been shrinking rapidly (Comiso, 2012), which is particularly signifi cant in MY coverage during the past decades. During the winters of 1979–2011, PMW measurements from SMMR, SSM/I, and AMSR-E reveal that the MY ice area and extent were declining at a rapid rate of -15.1%/decade and -17.1%/decade, respectively. The percentage is calculated as the ratio of the trend relative to the mean of the corresponding period. In the Arctic Ocean, good consistency was found between the areas with large MY ice area reduction and the areas with enhanced surface temperature. A typical cycle of 8-9 years overlaid on the decreasing trend is identifi able in the time series of MY ice area. To mitigate the effects of snow-cover on both FY and MY ice, a dynamically adjusted tie point is applied to derive MY ice concentration in Comiso (2012).
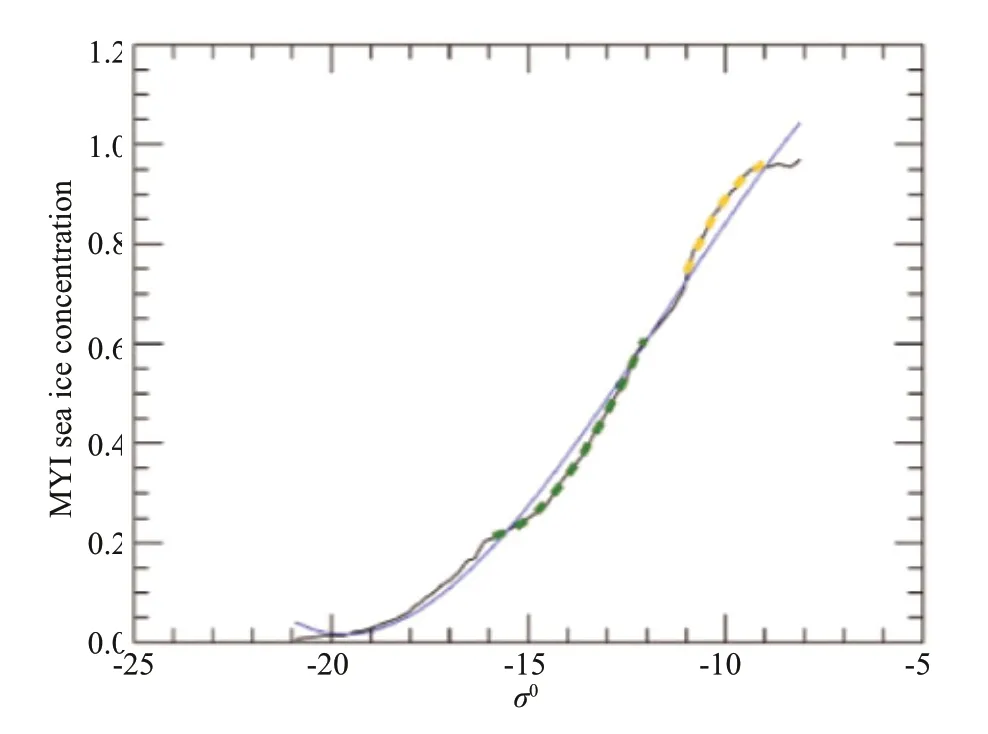
Fig.4 Fitted polynomial relationship between SAR-derived MY ice fraction and QuikSCAT VV σ 0 values
3.2 Scatterometer measurement
3.2.1 Trends and variability in MY concentration and area
Over the past two decades, the satellite observations revealed that the average negative trend of the MY ice fraction fi elds in January reaches up to -45%/decade (Fig.5a) in some regions (Kwok, 2018). Compared to the trends of 1979–2011, the recent decreases of the MY area has been even more rapid, with a rate of -1.46×10⁶km2/decade (i.e., -50.3%/decade, Fig.5b). This rate is about a factor of two times of that estimated by Comiso (2012). The percentage corresponds to the ratio between the trend and the mean of the MY ice area over the period 1979–2011. Also noteworthy is the recovery of the MY ice coverage emerging in 2013 and 2014. The explanation of the underlining mechanism for these recoveries is outlined in the next section.
The distribution of MY cover derived from QuikSCAT and ASCAT is illustrated in Fig.6. From 2000 to 2005, about two-thirds of the Arctic Ocean were occupied by the MY ice. A large drop of the MY ice cover then prevailed through the following years. Compared to the peak MY ice coverage in 2002, the Arctic had lost more than 2×10⁶km2in MY ice area, or a decrease of larger than 50%, leaving less than one-third of the Arctic with the MY ice in 2017 which covers the north coast of Greenland and the Canadian Arctic Archipelago (CAA). This transformation of the dominant ice type from the MY ice to the FY ice explains why the new research subjects, in association with the coupled variability between the sea ice, atmosphere, and ocean in the Arctic, is of greater interest in the upcoming decades.
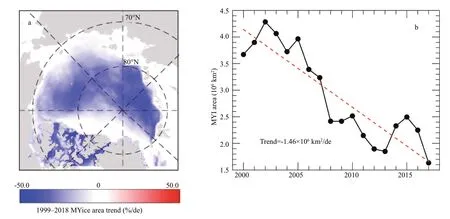
Fig.5 The trends of MY ice concentration and area over the period 1999–2018 as observed from satellite scatterometers (QuikSCAT: 1999–2009; ASCAT: 2010–2018)
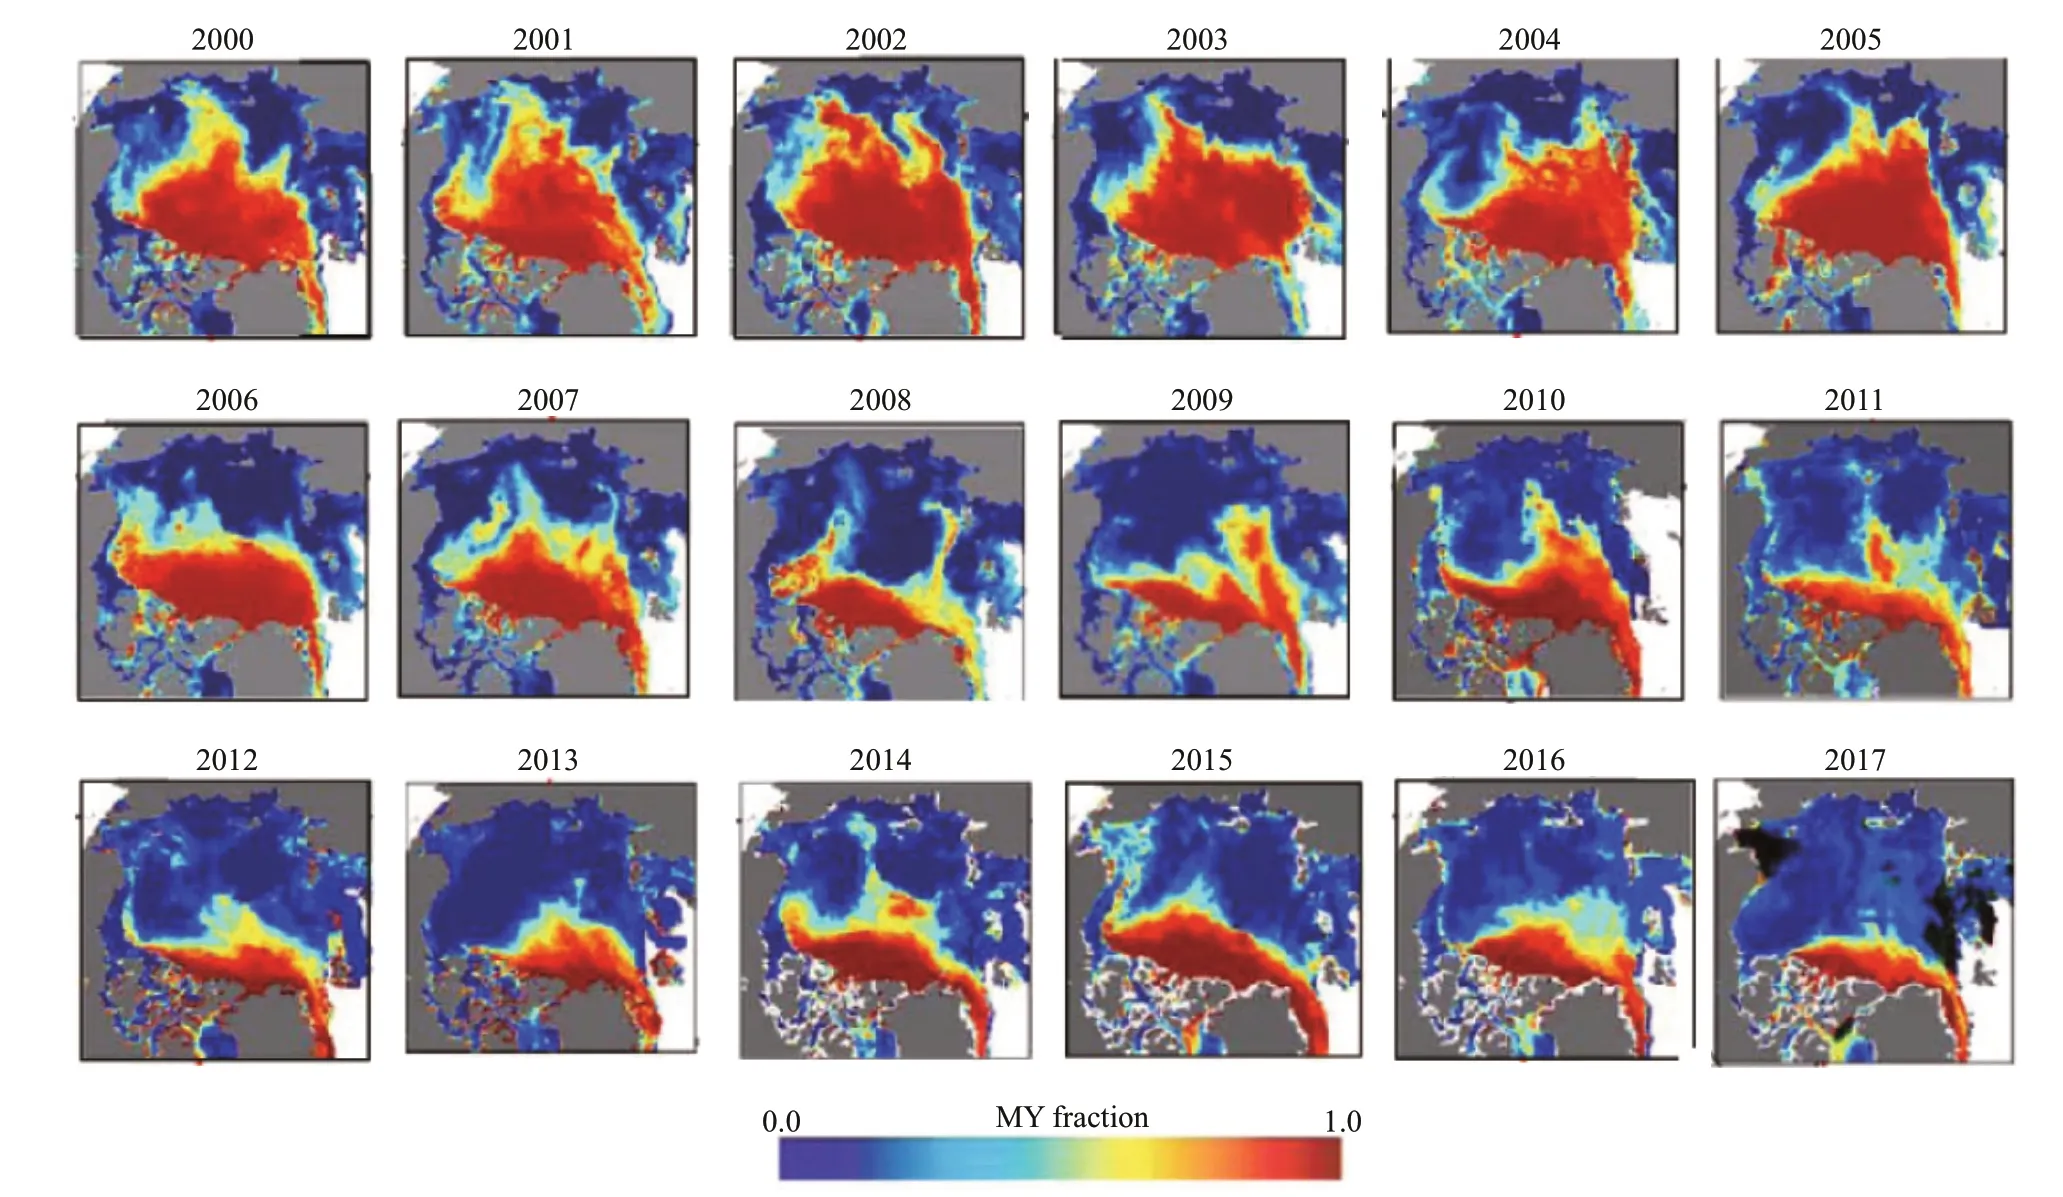
Fig.6 Time series for MY ice concentrations as derived from QuikSCAT (2000–2009) and ASCAT (2010–2017) records
3.2.2 Variability and trends in MY extent
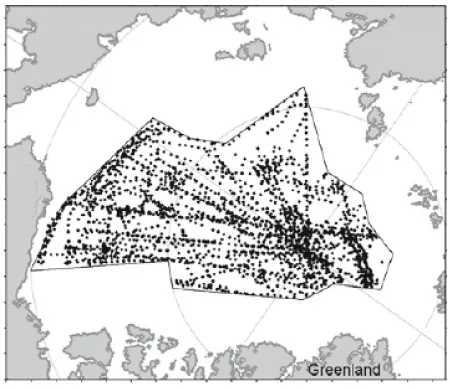
Fig.7 Locations for the submarine records of sea ice draft over the period from 1958 to mid-1990s
QuikSCAT and OSCAT measurements are applied in the Arctic sea ice classifi cations, resulting in a nearly continuous record of MY ice extent from 2000 to 2014. Because of some high backscatter values near sea ice edge with an appearance similar to MY ice (but indeed not), some marginal ice correction (MIC) techniques are explored to exclude these spurious pixels, which is mostly observed in the domain close to Nordic and Greenland seas.
It shows that the largest MY ice extent stands out in 2002, following a declining trend until 2013, when a record low is observed. The average winter (October to May) MY ice extent is approximately 0.84×10⁶km2. For the MY ice extent, the largest decline of 0.85×10⁶km2occurred in the winters of 2006/2007 and 2007/2008, while the largest increase of 1.26×10⁶km2emerged in the winters of 2012/2013 and 2013/2014. Overall, the winter MY ice extent over the period 2000–2014 shows a decreasing trend (-1.93×10⁶km2/de (decade)) with a transient recovery in 2013/2014. In particular, the restoration in 2013/2014 restored the MY ice extent to a level comparable to those noted in 2005/2006. The total sea ice extent (defi ned by the sea ice concentration threshold of 30% from the NASA Team algorithm) exhibits a slight downward trend compared with the robust trend of MY ice. The total trend is mainly attributed to the increasing trend of the FY ice area, which partly compensated the negative trend of MY ice and results in a relatively stable total sea ice extent in winter.
To obtain a longer time series of the MY ice extent, the reliability of the ASCAT observations since 2007 on the determination of the MY classifi cation is assessed by several studies. For instance, Lindell and Long (2016a) concluded that the performance of ASCAT could be further reinforced with the additional usage of the SSMIS data. Overall, ASCAT can produce a relative consistent results in MY ice classifi cation and extent with the previous estimates from OSCAT and SSMIS. However, the ASCAT retrievals are comparably smaller than the MY ice extent defi ned by sea ice age product provided by NSIDC. Usually, the MY ice is referred to as the sea ice with an age of at least two years.
4 VARIATIONS IN ARCTIC SEA ICE THICKNESS AND VOLUME, AND THE COUPLED VARIABILITY WITH MY ICE CHANGES
4.1 Changes in the Arctic sea ice thickness and volume
4.1.1 A glimpse from fi eld observations
Many studies report a basin-wide thinner of Arctic sea ice as suggested in different data sources (Kwok and Rothrock, 2009; Johnson et al., 2012; Zhang et al., 2016; Bi et al., 2018). A previous analysis of submarine observations (Fig.7) indicated that the mean ice draft at the end of the melt season decreased throughout most of the Arctic Basin over the past decades, from roughly 3.1 m in 1958–1970 to 1.8 m in 1993–1997 (Rothrock et al., 1999). A refi ned analysis points to a decline of annual mean ice draft from 3.42 m in 1980 to 2.29 m in 2000, a decrease by 1.13 m in the draft in 2008 (or 1.25 m in thickness) (Kwok and Rothrock, 2009). The signifi cant reduction in thickness is in part attributable to the depletion of the older and thicker MY ice components (Kwok and Rothrock, 2009; Bi et al., 2018).
Other investigations are also aware of thinner sea ice in the critical regions of the Arctic Ocean. For instance, observations of the second-year ice acquired by helicopter-borne electromagnetic equipment (Fig.8a) indicate a reduction of 30% in mean thickness from 1.81 m in 2001 to 1.27 m in 2007 over the Transpolar Drift (TD) region in later summer (Haas et al., 2008). In Fram Strait, upward sonar data shows that the mode of sea ice thickness for the old ice is featured with an even more signifi cant negative trend, about -0.86 m/decade during the period 2003–2012 (Fig.8b) (Hansen et al., 2013). This change implies a thinner MY ice, by 38% (from about 2.9 m to 1.1 m) at the end of the melt season over the period. Additional fi eld measurements showing variations in Arctic sea ice thickness can be found in other relevant studies, such as Johnson et al. (2012) and Zhang et al. (2016).
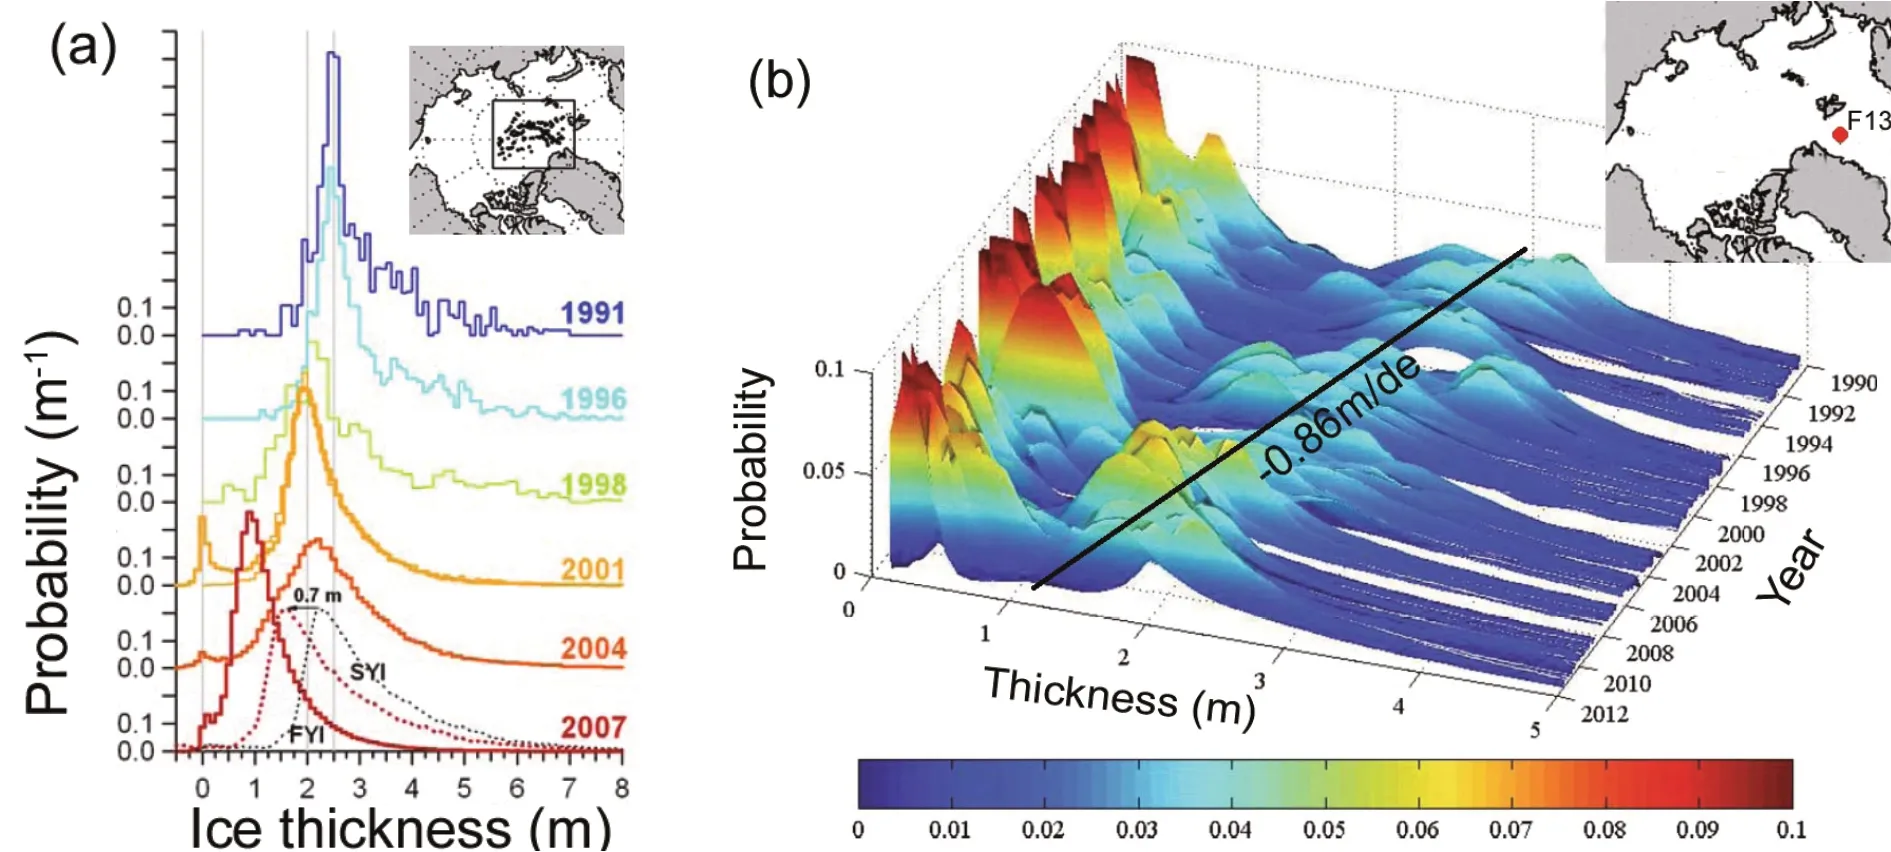
Fig.8 Field measurements of the sea ice thickness changes in transpolar drift region (a) (adapted from Haas et al. (2008)) and Fram Strait (b) (adapted from Hansen et al. (2013))
4.1.2 Results from satellite measurement s
A synoptic view of the spatial and temporal information for sea ice thickness is difficult to collect from the fi eld measurements. To obtain the information of the basin-wide ice thickness, the measurements from laser and radar altimeters onboard the satellite platforms are necessary. The satellite-observed knowledge of the Arctic sea ice thickness variability is critical for the prediction of the changes in the highlatitude climates of the Northern Hemisphere. Moreover, the continuous record of the Arctic sea ice thickness is a crucial time series to determine whether the observed Arctic sea ice changes are natural or anthropogenic.
In a prior study, Laxon et al. (2003) used the ERS radar altimeter measurements to assess the sea ice thickness variability. High interannual variability of the Arctic ice thickness was unveiled, which is primarily related to the length of the melt season. The prominent shortcoming of the early ERS altimeter is its low spatial resolution and the large data gap north of 81.5°N. To overcome this weakness, the advanced laser altimeter onboard the ICESat (Kwok et al., 2007) and ICESat-2 (Abdalati et al., 2010; Kwok et al., 2019), as well as the radar altimeter onboard the CryoSat-2 (Kwok and Cunningham, 2015), were launched. The new sensors represent a new generation of instruments with a more extensive ice coverage (up to 86°N by ICESat and ICESat-2, and to 88°N by CryoSat-2) and higher spatial resolution. Also, a merged product of the thickness from the CryoSat-2 and SMOS observations (a passive microwave sensor) is expected to improve the temporal resolution of the gridded product from a monthly to a weekly average.
Extending the submarine measurements to the recent satellite altimeter observations, Kwok and Rothrock (2009) reported a signifi cant decline in the mean thickness in Arctic. Their results suggest that the overall mean winter thickness of 3.64 m in 1980 is much larger than a 1.89-m mean in 2008 of the ICESat record, an astonishing decrease by 1.75 m. In comparison with the ICESat observations (2003–2008), CryoSat-2-derived thickness (2010–2017) shows a further decline by 0.4 m in winter. The reason for this remarkable thinning in the earlier years before the 2000s, when MY ice covered most of the Arctic Ocean, is associated with the dramatic loss of the oldest MY ice as observed since the 1990s (Maslanik et al., 2011). The relatively small changes in sea ice thickness between the ICESat and CryoSat-2 periods is explained by the predominance of seasonal ice within the Arctic Ocean, which reduces the contrast in ice thickness of the two periods.
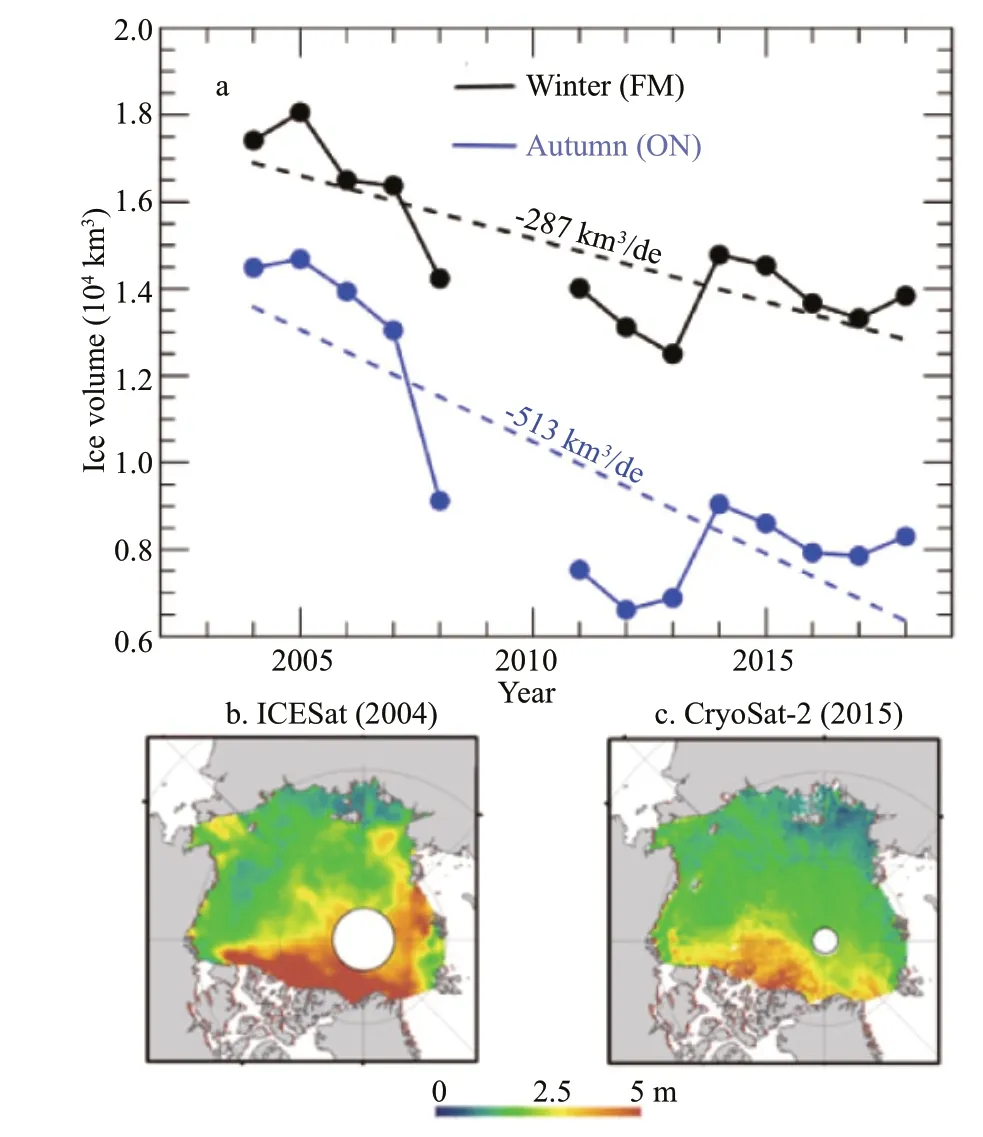
Fig.9 Arctic sea ice volume changes in winter and autumn over the ICESat (2003–2008) and CryoSat-2 periods (2011–2018)
It is worth noting that a substantial decline is found in the ice volume fi elds between the ICESat and CryoSat-2 records, approximately -287 km3/de in winter and -513 km3/de in autumn (Fig.9a) (Kwok, 2018). In addition, Bi et al. (2018) found a net depletion of Arctic ice volume by 4.68×10³km3in autumn and 1.46×10³km3in winter. The major loss is caused by the MY volume depletion, which amounts to 4.11×10³km3in autumn (October–November, ON) and 3.74×10³km3in winter (February–March, FM). The noticeable decrease in ice thickness over the Arctic basin is further depicted between examples in the two winter, one in 2004 (Fig.9b) and the other in 2015 (Fig.9c). Despite the contribution of thinner ice to the MY volume decline, there is one fact we should bear in mind is that the variability in MY ice volume co-varies mainly with the changes in MY ice coverage. Indeed, analysis by Kwok (2018) implies that MY ice area anomalies can explain about 85% of the variance MY ice volume anomalies in the Arctic.
4.2 Associations with the changes in MY ice agecomposition
In addition to the dramatic loss in MY ice area and extent, the changes within the interior of the MY ice is also an essential factor leading to the decrease in Arctic sea thickness and volume. The older ice may have experienced more ridging processes related to storms, and therefore tends to present a greater thickness along with the increases of the sea ice age (Maslanik et al., 2007; Bi et al., 2014; Tschudi et al., 2016). Many studies suggest that the observed thinner Arctic Ocean sea ice is mainly due to the reduction of the oldest components (Maslanik et al., 2011; Bi et al., 2016a; Kwok, 2018). In other words, the MY ice in the Arctic is becoming younger and thinner (as suggested in Figs.10 & 11). The less the remaining of older MY ice, as observed in the fi rst two decades of 21st century, the higher the probability of the occurrence of a low ice extent in September. The frequent emergence of the record low after the turn of the new century, such as those in 2007 (Zhang et al., 2008a) and 2012 (Parkinson and Comiso, 2013), just followed the signifi cant trend toward a thinner and younger composition in Arctic sea ice cover.
The recent MY ice loss has extended into the area adjacent to the CAA, where most of the MY ice can survive through the entire summer before 2007 (Fig.10). The ongoing signifi cant sea ice thickness and volume loss is again reflected in the large loss of the oldest ice coverage between the two altimeter observational periods (panels 2003–2008 versus 2011–2018, Fig.10). In contrast, MY ice in the Arctic was replenished by seasonal ice and partially recovered in coverage, as observed in 2014 and 2018 (Fig.10).
With the drifting buoy track, Rigor and Wallace (2004) reported that the thick MY ice decreased precipitously during the late 1980s. Then, Maslanik et al. (2011) used satellite-derived sea ice age and thickness to document a signifi cant loss of the older and thicker MY ice for the period of 1984–2011. Moreover, based on the longer-term NSIDC ice age product, we quantifi ed the extent of MY ice (sea ice that has an age of at least two years). We verifi ed that the fraction of the MY extent in March relative to the Arctic basin area has decreased from 50% in 1984 to about 32% in 2018, despite the transient rebound to approximately 38% in 2014 and 2015 (Fig.11). A record low in the MY ice extent fraction of nearly 30% occurred in 2008 (Fig.11). Moreover, the oldest MY ice with the age of no less than fi ve years dropped from 30% in 1979 to less than 5% in 2018. In contrast, the fi rst-year and second-year ice increased at 7 %/de and 2%/de, respectively. However, the 3–5+ ice decreases at rates of -0.3%, -1%, and -8%/de, respectively. All these rates are signifi cant at the 95% confi dence level (Fig.11).
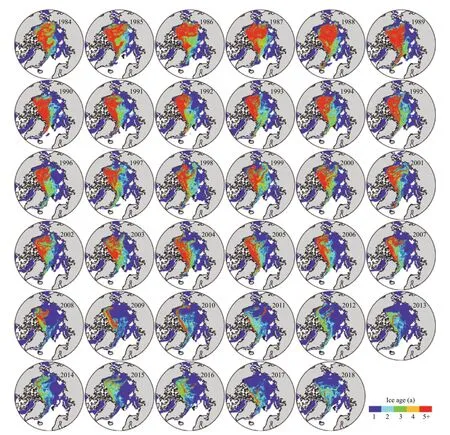
Fig.10 Sea ice age from NSIDC distribution in March over the period 1984–2018
Regionally, a younger trend of the ice age in the Canadian Basin (CB), about -1.6 year/de, is identifi able over the period from 1984 to 2018 (Fig.12a). The interdecadal changes in the sea ice age trend are also distinct (Fig.12b & c). In the earlier period, the sea ice age in the CB region had a slightly older tendency, about 0.2 year/de over 1984–2001 (signifi cant at the 95% confi dence level, Fig.12b). The considerable trend toward younger ice appears over the latter period, at a rate of -2.7 year/de for the period 2002–2018 (signifi cant at the 99% confi dence level, Fig.12c). Overall, the younger ice in the CB region facilitates the extensive melting there in the following melting season.
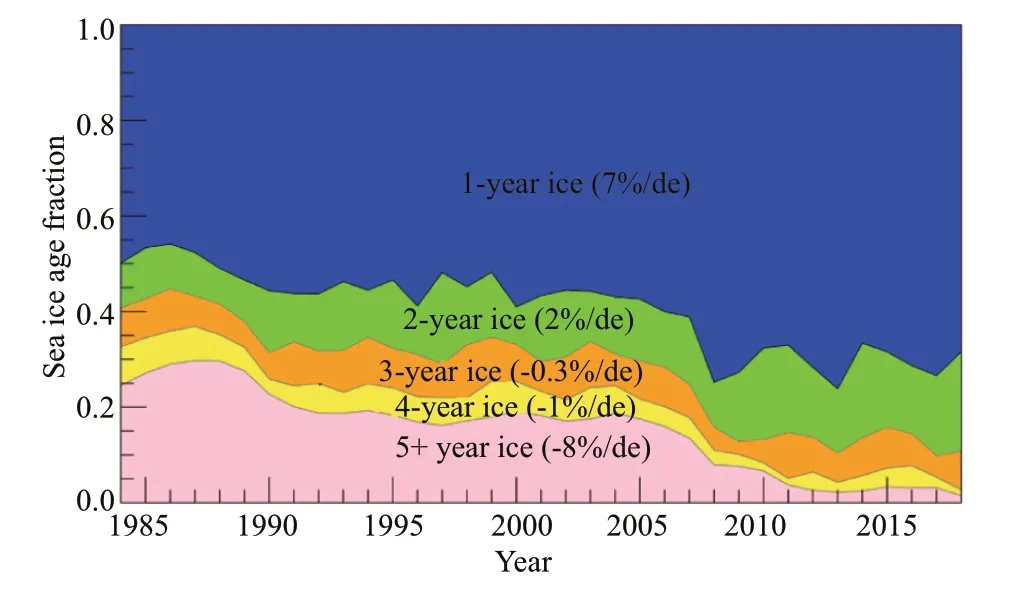
Fig.11 Estimated Arctic sea ice age fraction in March over the Arctic Ocean for the period 1984–2018
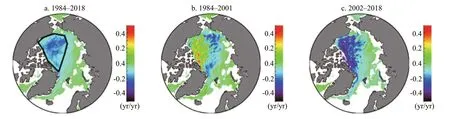
Fig.12 The trend of the sea ice age in March over the three periods, 1984–2018 (a), 1984–2001 (b), and 2002–2018 (c)
Together with a higher recirculation speed of ice in the Beaufort Sea, the extensive MY ice loss in the Pacifi c sector of the Arctic Ocean allows the sea ice to experience a shorter period of ridging before returning for another melt season. Therefore, when the younger and thinner MY ice is advected to the Alaskan coastal waters, more depletion in MY cover is expected during summer. Correlation analysis even demonstrates that the variations in MY ice age in spring can explain more than 50% of the variance in the September minimum ice extent.
5 MECHANISMS LINKED TO THE MY ICE SHRINKAGE AND RECOVERY
Both thermodynamic and dynamic mechanisms can play a role in modulating the variability and/or trends in MY ice cover (Zhang et al., 2012). MY ice coverage fluctuations in the Arctic basin are primarily determined by sea ice export (dynamics) and melting (thermodynamics) processes (Kwok, 2004; Kwok, 2007b; Kwok and Cunningham, 2010). The additional change is related to the convergence/divergence process (Kwok, 2015). However, Kwok (2004) inferred that the convergence mechanism only contributed to a very small fraction (approximately 2%–5%) of overall MY ice coverage variations in winter. In the following, we focus on the discussion about the MY ice variability in terms of the sea ice export (dynamic) and melting (thermodynamic) processes. Additional insights to the MY ice variability are given from other important causes, including the inflow of ocean water and water vapor from midlatitudes, and the surge of synoptic weather (cyclones and anticyclones).
5.1 Processes associated with MY ice loss
5.1.1 Sea ice export (dynamics)
The Fram Strait is the primary gateway for the Arctic sea ice export (Kwok et al., 2004; Ricker et al., 2018). Each year, sea ice of about 10% of the area of the Arctic basin is transported via the strait. The major ice outflow is composed of MY ice. Additional export of MY ice is observed in other passages, such as the Svalbard/Franz Josef Land (S-FJL) (Kwok, 2009), and Nares Strait (Kwok et al., 2010). S-FJL is the gate connecting Arctic Basin and the Barents Sea, while Nares Strait is a narrow channel linking the Arctic Ocean to the Baffin Bay. Regional exchange of sea ice is responsible for the MY ice area variability within the Arctic Basin (Kwok, 2008; Bi et al., 2019a). Potentially, the increased sea ice outflow via the Baffin Bay may also be conducive to the MY input to the bay through the Canadian Arctic Archipelago (Kwok, 2007a; Bi et al., 2019b).
Concerning the Fram Strait sea ice export, many studies have examined its interannual variability and trends. Based on different satellite data sources, some argued for an observable trend in the past three decades in sea ice area flux via the strait (Krumpen et al., 2016; Smedsrud et al., 2017; Zamani et al., 2019) while others did not reveal a clear trend (Kwok, 2009; Kwok et al., 2013; Bi et al., 2016b). However, there is a general agreement about a clear increasing trend in the winter sea ice outflow via Fram Strait in 2010s (Kwok et al., 2013; Smedsrud et al., 2017) and summer fluxes over the period since 1979 (Kwok et al., 2013; Bi et al., 2016b; Krumpen et al., 2016). These identifi able trends in sea ice area flux are mainly attributable to the positive trend in winds and thus sea ice motion over the strait (Zamani et al., 2019). The thinner trend of sea ice may also have contributed to the increase of ice motion and thus area export (Hansen et al., 2013).
The interannual variability is high in the accumulated sea ice export via Fram Strait. The record high of roughly 1.0×10⁶km2occurred in winter (October–May) of 1994/1995, which is nearly a factor of two times compared to the record winter low approximately 0.52×10⁶km2in 1984/1985. The large wintertime sea ice outflow in the mid-1990s lay a basis for the following decades to observe a relatively low MY ice coverage. Arctic Oscillation (AO) was documented to be associated with this anomalous sea ice export via the strait in the mid-1990s (Rigor et al., 2002). Since around 2000, the dipole anomaly is widely recognized as the large-scale atmospheric circulation mode that explains much of the variance in the sea ice export via Fram Strait (Watanabe et al., 2006; Wu et al., 2006; Wang et al., 2009; Bi et al., 2016b). Indeed, the robust increasing trend of the Fram Strait sea ice export in summer months (June–September, but mainly from August) is strongly related to the positive trend in dipole anomaly ( R=0.6). In contrast to the sea ice outflow in winter, the increasing summer export of 1.81×10³km2/a, as observed over 1988–2012, is more detrimental to the MY ice replenishment. New ice will grow in the exported area in winter and likely grows to a thickness surviving through the following summer. In contrast, no new ice will be produced in summer to compensate for the MY ice loss owing to the sea ice outflow. Additionally, sea ice export may be associated with synoptic weather such as anticyclone (Ionita et al., 2016) and cyclones (Wei et al., 2019). Modulated by the large-scale atmospheric circulation pattern, the contribution of the extreme synoptic atmospheric activity also plays an important role in modulating the sea ice export via Fram Strait (Brümmer et al., 2001; Smedsrud et al., 2011) and thus MY ice cover variability within the Arctic Ocean.
With an average ice export of 20×103km2of each winter (October–May) (Kwok, 2009), sea ice outflow through S-FJL is small compared to the mean of 706×103km2via Fram Strait. However, the interannual variations in sea ice flux of this gate are great. For example, in 2002/2003 winter, a large sea ice area flux across the S-FJL of 110×103km2stands out (Kwok et al., 2005), which is approximate of 23% relative to that through Fram Strait in the same period. More importantly, about 70% of exported ice, in this case, consists of MY ice. Another gateway that consistently contributed to the thick MY ice export is Nares Strait (Kwok et al., 2010). With satellite SAR observations, Kwok et al. (2010) estimated a mean area flux of 42×103km2(1997–2009) through this gate, which is comparable to the average inflow to the Baffin Bay (33×103km2) for the period 1979–2018 as estimated by Bi et al. (2019b). In particular, there was an unprecedented outflow of sea ice in 2007 when ice arches in the strait failed to form. In that year, the annual export of 84×103km2via Nare Strait is about 10% of the Fram Strait export. The large outflow passing the Nares Strait favors for the recent MY ice loss in the Arctic Ocean. On the other hand, the exchange between the Arctic Ocean and CAA in the narrow western channels seems to be a source to compensate the MY ice loss in the Arctic Ocean (i.e., inflow from CAA to the Arctic Ocean), with an average of -85×103km2, -20×103km2, and 8×10³km2for the Amundsen Gulf (AG), M’Clure Strait (MS), and Queen Elizabeth Islands (QEI) over the period 1997–2002 (Kwok, 2006). Given the importance of sea ice export in understanding the Arctic MY area balance, it is crucial to quantify the MY ice area flux via the key fluxgates of the Arctic over a longer time series. However, the inconsistency among the MY ice concentrations from different satellite measurements hamper the work to achieve such a record.
5.1.2 Sea ice melting (thermodynamics)
The melting at the top and bottom surfaces of sea ice is difficult to retrieve from the current satellite observations directly. Instead, some studies attempted to obtain the sea ice area loss due to lateral ice melting (Kwok and Cunningham, 2010; Bi et al., 2019a). With satellite-derived sea ice drift and concentration data, Bi et al. (2019a) inferred a lateral melting of sea ice area of 94%, on average, in the Pacifi c sector of the Arctic basin. The remaining 6% is due to the advection process from the Pacifi c side to the Atlantic side.
To quantify the melting area of MY ice, Kwok and Cunningham (2010) made use of multiple satellite observations, including ERS and QuikSCAT scatterometer measurements. Over 1993–2009, an average of 53×103km2of MY ice area was lost to melt in the Beaufort Sea. Moreover, much of the melt of MY ice cover occurred after 2000. In particular, about 32% of the net cumulative area loss (490×103km2) of MY ice in the Arctic Ocean emerged over the period 2005–2008. The peak melt of 213×103km2in 2008 even amounts to approximately two times of the summer outflow via Fram Strait in that year.
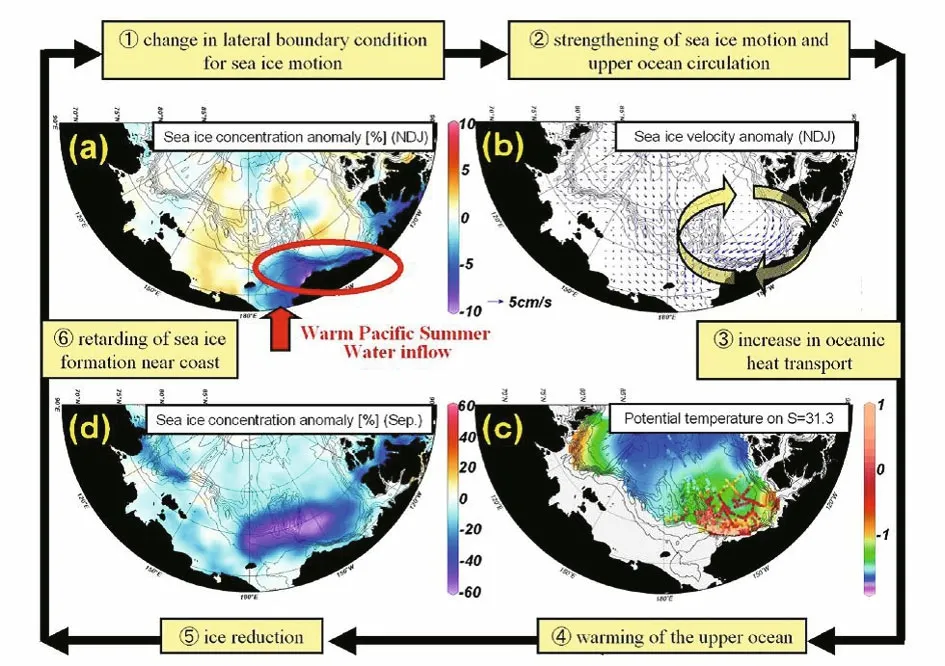
Fig.13 Feedback system about the Pacifi c water inflow and sea ice decline
The increased melt of sea ice in the Pacifi c-Arctic sector (PAS) is largely related to the lengthened melting period linked to a warmer Arctic atmosphere and Ocean. Stroeve et al. (2014) found that the trends of the longer melting of sea ice in summer. The summer melting length over the marginal seas within the Arctic Basin has been increasing, approximately 11.8, 8.6, 9.7, 13.2, and 9.2 days/de, in Kara, Laptev, East Siberian, Chukchi, and Beaufort Seas, respectively. This revealed an increase in the days of ice-melting over these seas. Therefore, the cumulative anomalies in the absorption of solar radiation from May to September exceed 300–400 J/m2over the Beaufort and Chukchi seas, which could result in an extra melt of the sea ice with the thicknesses of 0.9–1.3 m.
As Arctic MY ice is becoming thinner, the coverage loss associated with the lateral melting is more prone to the present warmer ocean and/or atmospheric conditions. The extensive melting of sea ice may leave fewer amounts of seasonal ice to survive the summer and replenish the MY loss due to melting, export, and convergence. For example, Kwok (2007b) found that the near-zero replenishment in summer 2005 is associated with the sharp drop of the MY ice area between 2005 and 2008. In the upcoming studies, a further analysis of the very low MY ice replenishment occurred after 2008 is intriguing under the context of such a rapid climate change over the Arctic.
5.1.3 Effects of oceanic inflow
The presently decline in the Arctic sea ice extent is more rapid than expected (Stroeve et al., 2012). The oceanic heat transport serves as an important component of the surface heat balance in the area covered by sea ice (Rudels et al., 1999). There are studies that reported that the ocean inflow from the Pacifi c Ocean through the Bering Strait contributes to the reduction of sea ice cover in PAS (Shimada et al., 2006; Zhang et al., 2008b). A positive mechanism amplifying the effects of the warm Pacifi c Ocean water on the September sea ice decline in PAS, as shown in Fig.13, was proposed by Shimada et al. (2006). They assumed that the delayed sea ice formation over the PAS in early winter, which began in 1997/1998, caused a reduction in the internal ice stress. They allowed a more efficient transferring of the anticyclonic wind forcing to the upper ocean (Fig.13a–b). As a result, the anomalous heat flux from the warm PAS water was transported into the central Arctic basin, where a catastrophic change in the sea ice cover was observed (Fig.13c–d). The impacts of the anticyclonic winds on the sea ice retreat in PAS was also reflected in the summer months of 2007 (Ogi et al., 2008). Moreover, the anticyclonic winds tend to be stronger during recent summers (Ding et al., 2017), which would further enhance the sea ice shrinkage and the decline in the MY extent.
Regarding the Atlantic inflow, Rudels et al. (2015) examined the ocean branches through the Fram Strait and Barents Seas. However, the role of the Atlantic inflow on the sea ice cover changes is still in controversy. One view argued that the Atlantic inflow is not important because of the transformation into a less saline surface layer, as observed in the north of Svalbard due to mixing with fresh water. This layer could protect the sea ice by preventing the heat stored in the warm, subsurface core from reaching the ice. Moreover, the warmer climate likely provides more liquid freshwater to enhance the stability of the water column further and cause less loss of sea ice. In contrast, other studies suggested that the thinner and lesser sea ice cover are in line with the period of the anomalous advection of the warm Atlantic water into the Arctic Ocean (Polyakov et al., 2005, 2011, 2012; Carmack and Melling, 2011). In addition, the increases in open water due to the sea ice loss in the Barents Sea allow an enhanced wind-driven mixing process and leads to the more Atlantic water inflow into the upper Arctic Ocean layer. This positive feedback mechanism could further reduce the thickness of the Arctic sea ice.
5.1.4 Role of poleward water vapor intrusion
Arctic Amplifi cation is a well-documented scenario in the Northern Hemisphere over the past decades. Various underlying causes have been investigated. Among them, the effects of the snow-ice albedo feedback mechanism on the Arctic Amplifi cation has been widely examined (Serreze et al., 2009; Screen and Simmonds, 2010; Serreze and Barry, 2011). However, recent studies suggested that the downwelling radiation (DWR) plays a leading role in modulating the warming trends in the Arctic (Gong et al., 2017; Lee et al., 2017a). The poleward moisture transport is, in turn, identifi ed as the main contributor to the trends in the DWR (Gong et al., 2017). In particular, Johansson et al. (2017) estimated that the poleward moisture transport would have produced an increase in the surface air temperature in the Arctic of 5.3 K in winter and 2.3 K in summer. The enhancement in the DWR is conducive to thinner sea ice in winter and preconditions for an accelerated loss of sea ice in the following summer.
Kapsch et al. (2013) found that the enhanced transport of moisture in spring could cause the most signifi cant influences on the Arctic sea ice melting in summer. Gong et al. (2017) confi rmed that the increased moisture transport is the main cause of the warmer Arctic surface over the regime north of 70°N. Over the Atlantic side, the winter moisture intrusion was found to be related to the warmer air temperature and sea ice loss in the Barents Sea (Luo et al., 2019). Over the Pacifi c side, Lee et al. (2017b) demonstrated that the reinforcement in moisture transport in 2002–2014, compared with 1979–2001, gives rise to the increase in water vapor and DWR in the Arctic, resulting in the decline in sea ice cover in PAS. Compared to the moisture from the local water vaporization (35%), the poleward moisture transport accounts for the primary fraction (67%) of the Arctic water vapor content (Zhong et al., 2018). In addition to the enhancement in the DWR, the larger moisture transport is also helpful for the formation of low-level clouds (Wang et al., 2019b) and the increase in liquid precipitation. The increases in the cloud fraction and precipitation favor the warming over the Arctic surface and thereby the loss in the MY cover.
5.1.5 Linkage with synoptic weather
The linkage of sea ice melting with the synoptic weather conditions (such as cyclone and anticyclone) is an interesting subject of the recent studies (Wernli and Papritz, 2018; Lei et al., 2020; Liang et al., 2020). For instance, the extraordinary effects on the sea ice depletion of an intense summer cyclone passing over the PAS were investigated by Zhang et al. (2013) using the PIOMAS model. When the storm past, an enhanced vertical ocean mixing and the companying upward ocean heat transport occurred in the marine boundary layer. This distinguished August cyclone took place in the context of thin sea ice. It warmed near-surface temperature over the PAS, which created the conditions that produce sea ice particularly vulnerable to the storms (Zhang et al., 2013). Additional sensitivity simulation without the wind effects of the strong storm also exhibited a dramatic decline in the sea ice extent in September 2012 (approximately 4.4%, or 0.15×10⁶km2less). The Arctic sea ice thickness and volume, on the other hand, can be signifi cantly reduced due to the signifi cant bottom sea ice melt because of the increased upward ocean heat transport associated with storm stirring (Zhang et al., 2013).
The increased transport of mid-latitude cyclone with low potential vorticity towards the region of Beaufort Gyre is responsible for the strengthening of anticyclone in PAS (Wernli and Papritz, 2018). The recent strengthening trend of the anticyclonic atmospheric circulation in PAS is partly related to this poleward movement of the cyclones from midlatitudes. The persistence of anticyclone in PAS could lead to the continued ocean heat inflow into the high Arctic via Bering Strait (Shimada et al., 2006) and the Arctic sea ice export through Fram Strait (Wang et al., 2009). Therefore, the anticyclones in the Arctic are the favorable synoptic atmospheric activity facilitating the recent reduction in the Arctic MY ice cover.
5.2 Processes related to MY ice replenishment
As we have mentioned above, the variability in the MY ice area is influenced by the number of the icemelting days. Tilling et al. (2015) demonstrate that a 5% drop in the melting days is associated with the notable rebound of MY ice cover, as observed in 2013 and 2014. In addition, the sea ice convergence process over the north of the CAA is also found to be responsible for the MY recovery (Kwok, 2015; Kwok and Cunningham, 2016). Figure 14 presents the different patterns of sea ice motion under the differing atmospheric circulation patterns. In 2011, it was featured with a divergence with a net area increase of 17.8% from June to August (Fig.14a). During the 2013 summer, however, it was observed with an extreme convergence with a reduction in the area by -23.5%. Further analysis indicated that the nine months with a signifi cant sea ice convergence after the summer minimum extent in 2013 contributed to the MY ice recovery in winter 2014. Viewing a longer period of ice convergence around CAA, Kwok (2015) underscored that sea ice convergence, as noted in the 2013 summer, is extremely unusual. Additionally, the MY ice rebound may be related to the enhanced divergence of sea ice due to the increases in cyclone quantities over the Central Arctic (Screen et al., 2011).
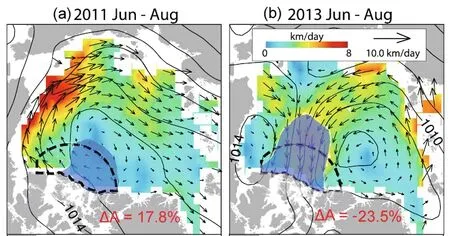
Fig.14 Sea ice motion in summer 2011 and 2013
After the short period of recovery in 2013 and 2014, the Arctic MY ice extent showed a decline from 2015 to 2017 which was again followed by a clear recovery in 2018. Is this rebound associated with the convergence and/or cooler weather, or other synoptic activities of the atmosphere such as cyclone and anticyclone? This is an interesting question that begs for further investigation.
6 REMAINING CHALLENGES IN MONITORING ARCTIC MY ICE FROM MULTISOURCE SATELLITE OBSERVATION
The coverage of MY ice cover is crucial to estimate the heat and mass exchanges between the ocean and the atmosphere. The reduction of MY ice area allows larger heat and moisture flux exchange with the overlying air, likely leading to enhanced Arctic Amplifi cation. The melt of thicker MY ice, relative to thinner FY ice, is expected to release more freshwater and causes a stronger stratifi cation of ocean. The recent decade has observed signifi cant MY ice loss (Maslanik et al., 2011; Lindell and Long, 2016a; Bi et al., 2018), which is not completely replenished (Kwok, 2007b) and results in a positive feedback mechanism of MY ice reduction. Therefore, the accurate information of the MY ice changes in area and thickness is vital to the research fi elds associated with climate change. Overall, a physically consistent MY ice record is the basis to assess the variability and trends of the Arctic climate. The possibility of the navigation plan of Arctic operational passages, such as the Northwest Passage via the CAA and the Beaufort Sea, also need the accurate information of Arctic MY ice changes (Ye et al., 2016).
A critical problem for the acquisition of a physically consistent satellite-derived MY time series lies in the snow-covered FY surface. Snow metamorphism and layering within the snow during a melt-refreeze cycle of the ice surface could modify the ice surface physical properties, such as dielectric constant and volume scattering. In particular, it was found the impacts of the intense cyclone in springtime are remarkable in transforming the sea ice surface morphology (Shokr and Agnew, 2013a, b). Thus, the sole data source from any microwave observations may be incapable of eliminating the anomalies associated with snow modifi cation, and often the FY is misinterpreted as MY ice. An insightful method that proposes the utilization of the sea ice drift information to reduce the erroneous classifi cations of MY ice is hopeful (Ye et al., 2016). However, the reliability of the results is dependent on the accuracy of the sea ice drift product. How to generate a spatiotemporal fi ner sea ice drift product from multiple satellite observations poses a challenge for future studies. Another challenge may be the existence of thick clouds above the sea ice cover. Clouds may alter the microwave signal from the sea ice, resulting in ambiguous information of sea ice coverage (Kay and Gettelman, 2009).
The retrieval algorithm of MY ice thickness from spaceborne altimeters is also challenging. A modifi ed algorithm taking account to the ice density of MY and FY ice floes has been developed to obtain the Arcticwide sea ice thickness from ICESat (Spreen et al., 2009; Bi et al., 2014). The main uncertainty in the sea ice thickness from altimeters is related to the errors in snow depth. For the sea ice thickness retrieval from ICESat observations, snow climatology from Warren et al. (1999) (hereafter referred to as W99) was adopted. As climate change accelerates, snow depth for MY ice has altered signifi cantly. To estimate the sea ice thickness from Cryosat-2 observations, some researchers simply reduced the snow depth of MY ice to half of the climatology value of W99 (Laxon et al., 2013). Therefore, a critical challenge for the estimate of MY ice thickness remains in the extraction of the instantaneous snow depth. In future studies, the combined usage of spaceborne lidar (ICESat-2) and radar altimeters (Cryosat-2) is encouraged to directly obtain the snow depth from satellite observations over the Arctic MY ice cover.
7 SUMMARY AND OUTLOOK
7.1 Summary
The variability and trends of MY ice, in terms of concentration, area, extent, thickness and volume, motion, as well as age, identifi ed from satellite observations, are summarized in this review. Moreover, the causes associated with the changes of MY ice cover are outlined, and the remaining challenge in studying the Arctic MY ice changes is introduced.
A wide variety of spaceborne passive and active microwave sensors are explored to fully obtain the spatiotemporal changes of the MY ice cover. Among them, scatterometers (QuikSCAT, ASCAT, and OSCAT etc.) are broadly exploited to classify the MY types and retrieve MY ice concentration. Additional information for the MY ice cover is obtained from the PMW acquisitions (SSM/I, SSMIS, AMSR-E, and AMSR-2, etc.), but is found less reliable in the identifi cation of the MY ice. MY ice thickness and volume changes can be examined from the retrievals from the altimeter measurements. The satellites, such as ICESat, ICESat-2, and CryoSat-2 are explored. Sea ice motion is derived from both the satellite passive and active microwave measurements. The sea ice motion product is further used to estimate sea ice export and track the ice to infer their ages. The satellite-derived variables for MY ice are a key to interpret the rapid climate changes in the Arctic. In addition, the assimilation of the satellite observations with model inputs shows a great potential to improve the predictability of the model. The satellite observations reveal that the MY ice area and extent have largely reduced in the past decades. Moreover, the MY ice is becoming younger and thinner.
Based on the Arctic-wide observations from multiple satellites, the causes of the remarkable depletion and recovery in MY ice extent and volume have been assessed. Wherein, the variability in MY ice extent is mainly found to be related to the sea ice export, mostly via the Fram Strait. A small fraction of the MY ice loss is also attributable to the melting in PAS. The signifi cant shrinkage in the MY ice cover explains the major portion of the overall decline in Arctic sea ice volume (as the comparison between those observed between 2003–2008 and 2011–2015), while the remaining part is associated with thinner ice. The inflow of ocean water from the North Pacifi c and Atlantic sides and the poleward transport of water vapor are also considered as the important contributors to the MY ice loss. In addition, the role of synoptic weather activity on leading to MY ice variability is also introduced.
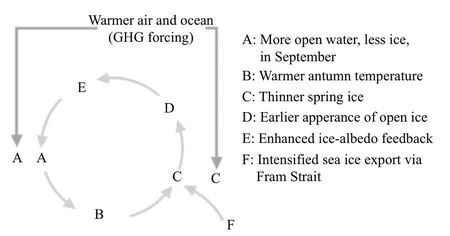
Fig.15 A schematic of the mutually-favoring processes for Arctic total sea ice and MY ice decline
As the greenhouse gas is increasing, the trend of a forced declining Arctic MY ice is expected through the positive sea ice-albedo feedback mechanism (Fig.15). The interannual variability of MY distribution and extent in winter is important in regulating the variability of sea ice minimum extent in the following autumn. Overlaid on this trend, the distinct interannual variability of MY ice extent, as unveiled from satellite observations, are related to large-scale atmospheric circulations. For instance, in mid-1990s AO played a leading role, and since 2000 the Arctic Dipole (AD) mode exerted more influences. Recently, the combined effects of different leading large-scale atmospheric circulation patterns and their roles in modulating the poleward transport of sensible heat flux and moisture is particularly important in understanding the currently rapid surface warming and MY ice volume loss in the Arctic. In addition, the knowledge about the relationship between the MY ice variability and synoptic weather (cyclone and anticyclone) remains lacking, which is an interesting subject worthy of further investigation.
7.2 Outlook for future study in China
The usage of Chinese satellite observations to study Arctic MY ice changes are not popular. On the one hand, we are short of an integrated professional team to validate, maintain, and update the product on time and request of the guests. On the other hand, a public-accessible platform (like NSIDC) is not in operation to distribute the product timely. In this regard, the huge database located in the Ocean Big Data Center in the Institute of Oceanology, Chinese Academy of Sciences, provides such a chance to share our own satellite-derived sea ice product with the world.
8 DATA AVAILABILITY STATEMENT
All data generated and/or analyzed during this study are available in the National Snow and Ice Data Center (NSIDC) repository (https://nsidc.org/).
 Journal of Oceanology and Limnology2020年4期
- Journal of Oceanology and Limnology的其它文章
- Geological, physical, and chemical characteristics of seafloor hydrothermal vent fi elds*
- Rediscovery of the abyssal species Peniagone leander Pawson and Foell, 1986 (Holothuroidea: Elasipodida: Elpidiidae): the fi rst record from the Mariana Trench area*
- Gametogenesis and reproductive traits of the cold-seep mussel Gigantidas platifrons in the South China Sea*
- Identifi cation and characterization of endosymbiosis-related immune genes in deep-sea mussels Gigantidas platifrons*
- Dynamic features of near-inertial oscillations in the Northwestern Pacifi c derived from mooring observations from 2015 to 2018*
- Fabrication of anodized superhydrophobic 5083 aluminum alloy surface for marine anti-corrosion and anti-biofouling*