
Genome-Wide Patterns of Codon Usage in the Pacific Oyster Genome
2021-08-30 06:15:28SONGKai
SONG Kai
Genome-Wide Patterns of Codon Usage in the Pacific Oyster Genome
SONG Kai*
,,266071,
The use of synonymous codons with varying frequencies has been observed in many species, and the magnitude varies among closely related species and genes within the same genome. Mutational processes or natural selective pressures affect this bias. However, a systematic investigation of codon usage pattern for molluscan species and its association with the two factors hasn’t been conducted. In this study, the whole genome codon usage patterns in oyster genome is investigated using the relative synonymous codon usage (RSCU) method, and 17 putative optimal codons were identified, wherein most had either a cytosine (C) or guanine (G) residue at the third position. Results showed that codon bias was positively associated with gene expression levels and breadth. Optimal codons had different mutational bias patterns compared with nonoptimal codons. Moreover, the results show that codon bias is negatively associated with nucleotide diversity. In the oyster genome, the fourfold degenerate codons are affected by different selective pressures, which can be regarded as an evidence that natural selection shapes codon usage patterns. This research will help to understand how natural selection and mutation bias affect codon usage in Mollusca genomes.
codon bias; synonymous codons; gene expression; nucleotide diversity;
1 Introduction
A common process that the 64 nucleotide triplets (co- dons) correspond to a genetic code of 20 amino acids is the translation of mRNA to protein. The use of synony- mous codons in varying frequencies has been observed in many species, and the magnitude varies among closely re- lated species and among genes within the same genome (Grantham., 1980). Different codons are presumed to have different translational efficiency and experience different selective pressures. Thus, highly expressed genes tendto use optimal (., preferred or translationally effective) codons and show a high level of codon bias. Often related to the copy number of highly expressed tRNA and tRNA genes, optimal codons can be considered as the result ofnatural selection to achieve more efficient and accuratetranslation (Ikemura, 1985; Sorensen., 1989; Duret,2002; Stoletzki and Eyre-Walker, 2007; Sharp., 2010). In contrast, GC content is assumed to be the most important factor shaping codon usage patterns (Kanaya., 2001; Knight., 2001; Chen., 2004). These find- ings illustrate that the genome-wide codon usage pattern is shaped by mutational biases because it is more likely to be determined by genome-wide mutational processes ra- ther than natural selection pressures. However, because of some clear indications, the possibility of natural selection involvement cannot be ruled out (Hershberg and Petrov, 2008). The association between codon usages and their abundance in tRNA, the within-genome variation, and the association between codon bias and gene expression le- vels cannot be explained by mutational biases alone. There- fore, another explanation for codon bias is the selection ex- planation (Hershberg and Petrov, 2008), which states that codon bias helps to improve the efficiency and/or accu- racy of protein expression and can therefore be generated and maintained through selection. Considering the muta- tional process and selection pressure are involved in codon usage bias in different organisms, the mutation-selection- drift balance model was proposed (Bulmer, 1991; Akashi., 1998; Duret, 2002).
The relationship among codon bias, natural selection, and mutational bias has been investigated in different orga- nisms such as(Kanaya., 2001),(Kanaya., 2001),(Musto., 2001),(Rao., 2011),and mammals (Chamary., 2006). However, little is known about the codon usage patterns in molluscan spe- cies which constitute the second largest animal phylum. In- vestigation of genome-wide codon usage patterns in mol- luscans are feasible because of the availability of genome dataof different molluscan species such as oysters (Zhang., 2012), scallops (Li., 2017; Wang., 2017), abalone (Nam., 2017), limpets (Simakov., 2013), and deep sea mussels (Sun., 2017). In addition, to in- vestigate natural selection and effective act on synony- mous codon usage, molluscan species with large, effec- tive population sizes are suitable models for investigating codon usage.
The Pacific oysterisan important fish- ery and aquaculture species that are widely distributed in the oceans worldwide are. The first oyster genome was published in 2012 (Zhang., 2012) and served as abasic resource for genetic and evolutionary studies (Xu., 2017; Gagnaire., 2018; Guo., 2018; Li., 2018a; Wei., 2018; Yue., 2018).is em- ployed as a research model because of its modest genome size of about 500 million base pairs (Mbp) and short generation time (1 year). To the best of my knowledge, to date, a comprehensive research on codon usage patterns for mol- luscan genomes has not been conducted. In this study, whole genome analysis using oyster genome was carried out and showed that codon bias had positive correlation with gene expression and breadth, but negative correla- tion with nucleotide diversity. In addition, the difference in selective pressures among fourfold degenerate codons was investigated and found that optimal codons experi- enced more selective pressures. This research will help un- derstand how natural selection and mutation bias affect co- don usage in Mollusca genomes.
2 Materials and Methods
2.1 Crassostrea gigas Genomics
genome sequences and gene annotations were downloaded from the National Center for Biotechnology Information (NCBI) (http://www.ncbi.nlm.nih.gov/, Gen- Bank accession No., GCA_000297895.1). If the coding re- gion does not begin with methionine (ATG) start codon, or the sizeis less than 300bp, orit contains an internal stop codon, the gene will be excluded from the study. A total of 25235 genes are selected in this analysis.
2.2 Sequencing Data
For mutation bias and nucleotide diversity calculation, resequencing data from 40 wildsamples collect- ed along China’s coastline were analyzed (Li., 2018b). These data were downloaded from the NCBI website un- der project number PRJNA394055. The transcriptome data offrom different tissues and developmental stageswere also downloaded from the NCBI website under ac- cession number GSE31012.
2.3 Expression Calculation
From the Oyster Genome Project, RNA-Seq data sets used for the comparison of different tissues and develop- mental stages were retrieved (Zhang., 2012). The eight tissues included the mantle, gill, adductor muscle, diges- tive gland, hemocyte, labial palp, and female and male gonads. The 11 developmental stages included the egg, two-cell, four-cell, morula, blastula, trochophore, D-shaped lar- va, umbo larva, pediveliger, spat, and juvenile stages.
The HISAT2 v2.0.4 package was used to map the RNA- Seq reads to the oyster genome (GenBank accession No. GCF_002113885.1; Kim., 2015) with default settings. SAM files were converted to BAM files using SAMtools v.1.3 (Li., 2009). Then, the abundance and new trans- cript tables were created using StringTie software (Pertea., 2015). Finally, for each gene, the fragments per ki- lobase per million values (FPKM) were estimated using R package Ballgown (Pertea., 2016).
The gene expression in this study was defined using the average of the gene expression levels across all analyzed tissues. Genes with expression levels higher than the cri- teria were considered as expressed genes. The numbers of tissues and developmental stages with gene expression were defined as the gene expression breadth.
2.4 Identification of Optimal Codons
Codons that occur more frequently in high-expressed gene than low-expressed gene were defined as optimal co-dons. First, gene expression levels were identified from theRNA-Seq data sets.Genes with the highest 5% and the lowest 5% expression levels were used as the high and low gene sets, respectively. Second, the average relative syn- onymous codon usage (RSCU) values for the two gene sets were calculated. Each amino acids’ RSCU value was cal- culated by dividing the codon usage number with the average usage number of all its synonymous codons; RSCU value of 1.0 indicates a lack of bias. Codon usage difference between high- and low-expressed genes was used as basis to infer optimal codons; ΔRSCU for a codon is the difference between the average RSCU values of high- and low-expressed genes (signi?cance tested using Wilcoxon rank test by R program). A codon is identified as optimal if the ΔRSCU is larger than 0.1 at<0.05. Lastly, the co- don bias indicator Fop was calculated using the codonW software (version 1.4.2). Fop is the ratio of the number of optimal codons against all the synonymous codons used, with values ranging from 0 (where no optimal codons are used) to 1 (where only optimal codons are used).
2.5 Single Nucleotide Polymorphism (SNP) Calling
The resequencing data from 40 wildwere used for SNP calling. Burrows-Wheeler Aligner software (BWA; Li and Durbin, 2009) was used to align filtered reads to the oyster reference genome (GenBank accession No. GCF_002113885.1; Zhang., 2012) using the command ‘a(chǎn)ln’with default parameters and ‘bwa sampe’ to generate SAMfiles. Next, by following the methods of Song. (2016), alignment results were improved. Bayesian approach, as implemented in the package SAMtools (Li., 2009) with parameters ‘-C 50 -t DP -t SP -ug’, was used to perform SNP calling after read alignment.
2.6 Identification of Pair Mutations
The method described by Hildebrand. (2010) was used to identify the mutation direction.Mutations with minor allele frequency were inferred as new mutations. Likewise, mutations having more than two alleles or two alleles at equal frequency were discarded. Unequal nucleo- tide content at different genomic regions, number of mutations from AT→GC, CG, or TA normalized by the num- ber of AT sites at considered genomic regions, and counts of the mutations from GC→TA, CG, or AT normalized by the number of GC sites were considered. The expected number of these mutation pairs can be determined under equal GC and AT contents in this manner.
3 Results
3.1 Genome-Wide Patterns of Codon Bias
To investigate the pattern of codon frequencies in thegenome, genes with coding lengths lower than 300bp or having an internal stop codon were excluded, and a total of 25235 genes were studied in the following analysis. GC content in thegenome is 33.4%. GC con- tent in the coding regions of the 25235 genes is 45.1%, which is greater than the genome-wide mean value.How- ever, GC contents of introns and ?anking regions are simi- lar with genome-wide mean value, which are 32.1% and 32.9%, respectively.
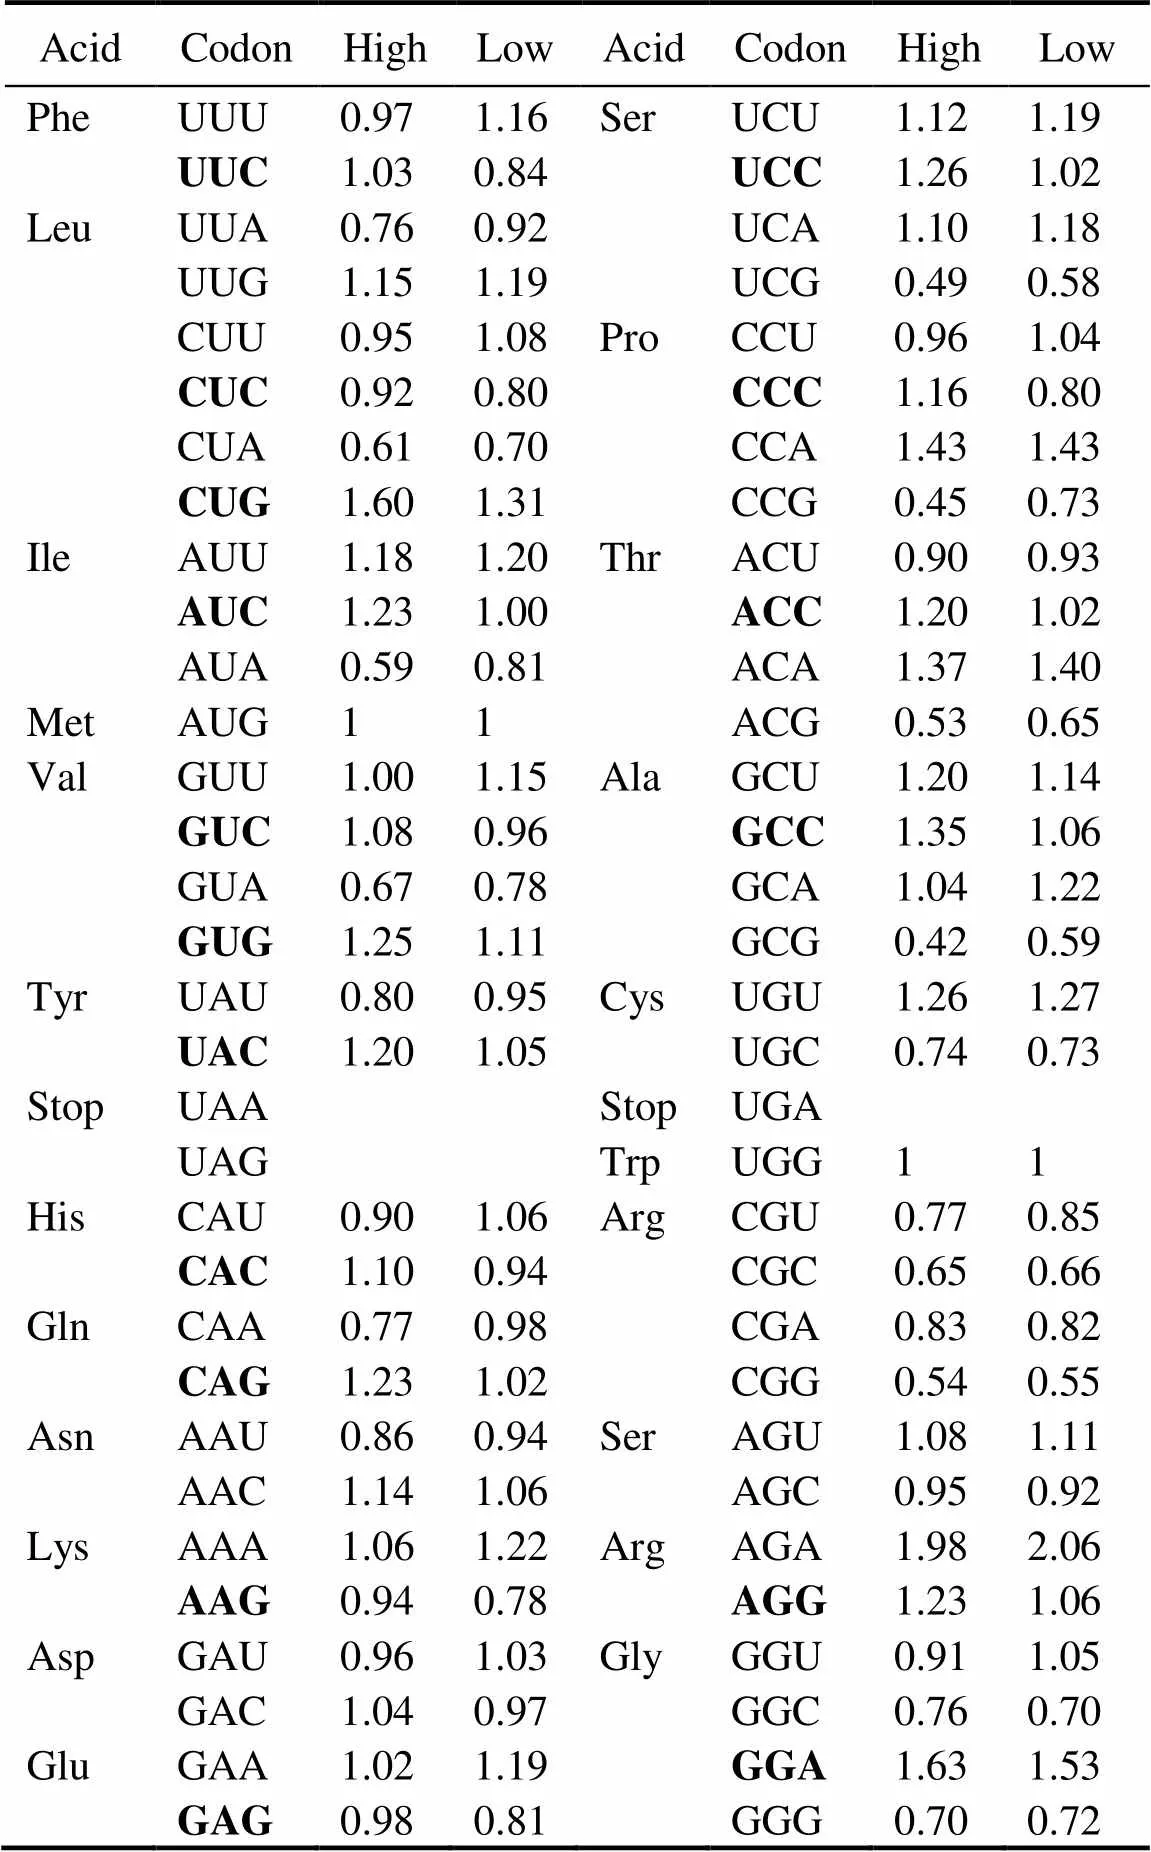
Table 1 Putative optimal codons
Notes: Departures from equal codon usage by sets of loci with high(top5%) and low (bottom5%) gene expression (ΔRSCU) were used as a basis in analyzing putative optimal codons. The difference be- tween the average RSCU of genes with high and low expressions (signi?cance tested using Wilcoxon rank test) is the ΔRSCU for a given codon. This codon will be identi?ed as optimal codon if ΔRSCU>0.1 at<0.05. A total of 17 optimal codons were identi?ed in this study (Boldface).
Table 1 shows that 17 codons were predicted as putative- ly optimal for 15 amino acids. In contrast to the AT bias (GC content: 33.4%) in the oyster genome, almost all pre- ferred codons used cytosine (C) or guanine (G) at the third position, and C is more frequent than G (nine.seven). In the oyster genome, only one preferred codon endsd withadenine (A) or thymine (T). Then these putatively optimal codons in the analysis below were used to estimate codon bias Fop, the ratio of optimal codons to synonymous co- dons.
3.2 Relationships Between Codon Bias and Gene Expression Levels
With the 25235 genes in the oyster genome, codon bias (measured as Fop) was estimated to be 0.3077±0.0616 (ranging from 0.0924 to 0.6492). Then, the relationship be- tween codon usage bias and expression levels in the oys- ter genome was analyzed. Codon bias is positively correlated with gene expression levels (=0.2644,<0.01) as shown in Fig.1a. Genes with higher expression levels tend to use more optimal codons, and correlations between co- don bias and expression breadth were also positive and sig- ni?cant (Figs.1b, c). The correlation between codon bias and expression breadth in different tissues was 0.2228 (<0.01) and of codon bias with expression breadth at dif- ferent developmental stages was 0.2095 (<0.01). This suggests that in their coding sequences, genes with higher expression levels and broader expression breadth tend to use more optimal codons. Total gene expression levels are also associated with the number of expressed tissues. In other words, genes expressed in more tissues tend to have higher expression levels. It is more likely to produce false correlations between codon bias and gene expression if expression breadth is the main factor affecting codon usage. To alleviate this problem, I regressed expression levels with codon bias, conditional with the gene expression breadth levels. A significantly positive correlation was ob- served in this test (=0.0846,<0.01).
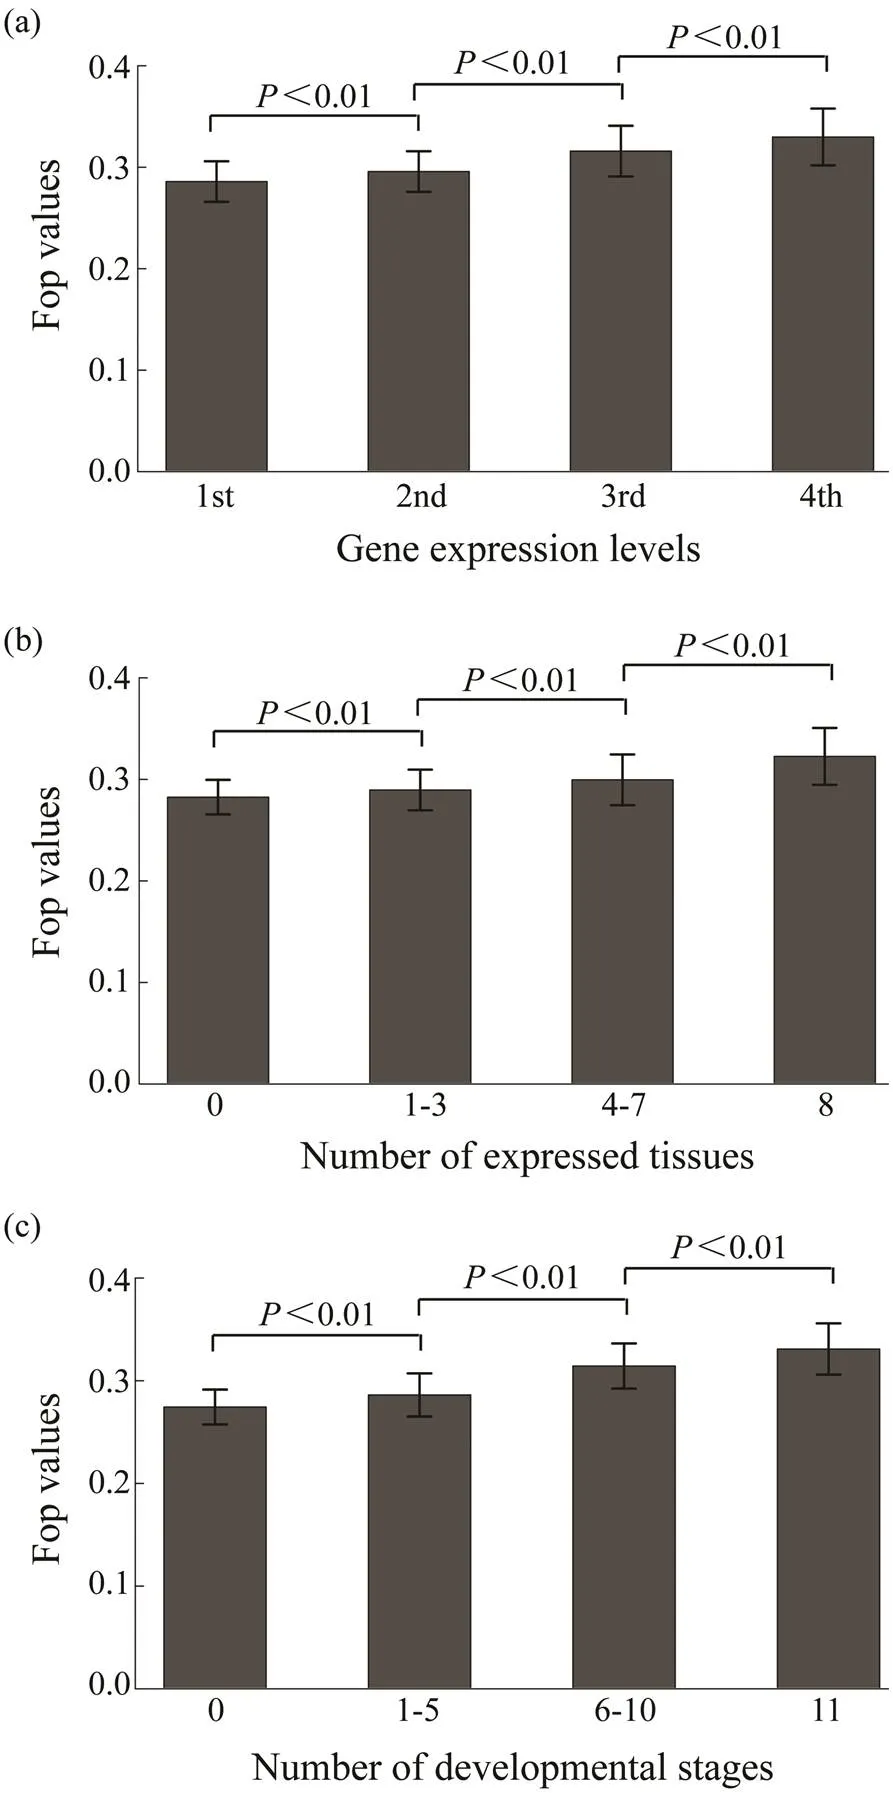
Fig.1 Relationships of Fop with (a) expression level and (b, c) expression breadth. Expression data of eight tissues and eleven developmental stages are analyzed. The average expression level of a gene in the eight tissues is the expression level, and the number of tissues and developmental stages with the expression of this gene is the expression breadth. The genes are divided into four groups based on gene expression levels from the bottom 25% to the top 25%. The differences of Fop values among these groups are significant (Wilcoxon rank sum test, P<0.01).
3.3 Relationship Between Codon Bias and Selective Pressures
The 11409 genes that had orthologs between two species ofgenus,and, were used to estimate the evolutionary indicatorsa ands. As shown in Fig.2a, genes with orthologs had higher degree of codon usage bias than those without. To investigate the relationship between codon usage biases and selective pressures, the 11409 genes with orthologs are ana- lyzed. Fig.2b shows that codon usage bias is negatively associated witha/s values (=?0.2213,<0.01). The codon usage bias is also negatively associated witha va- lues, but is not associated withs values. Thus, genes witha higher degree of codon usage bias tend to experience more selective pressures.
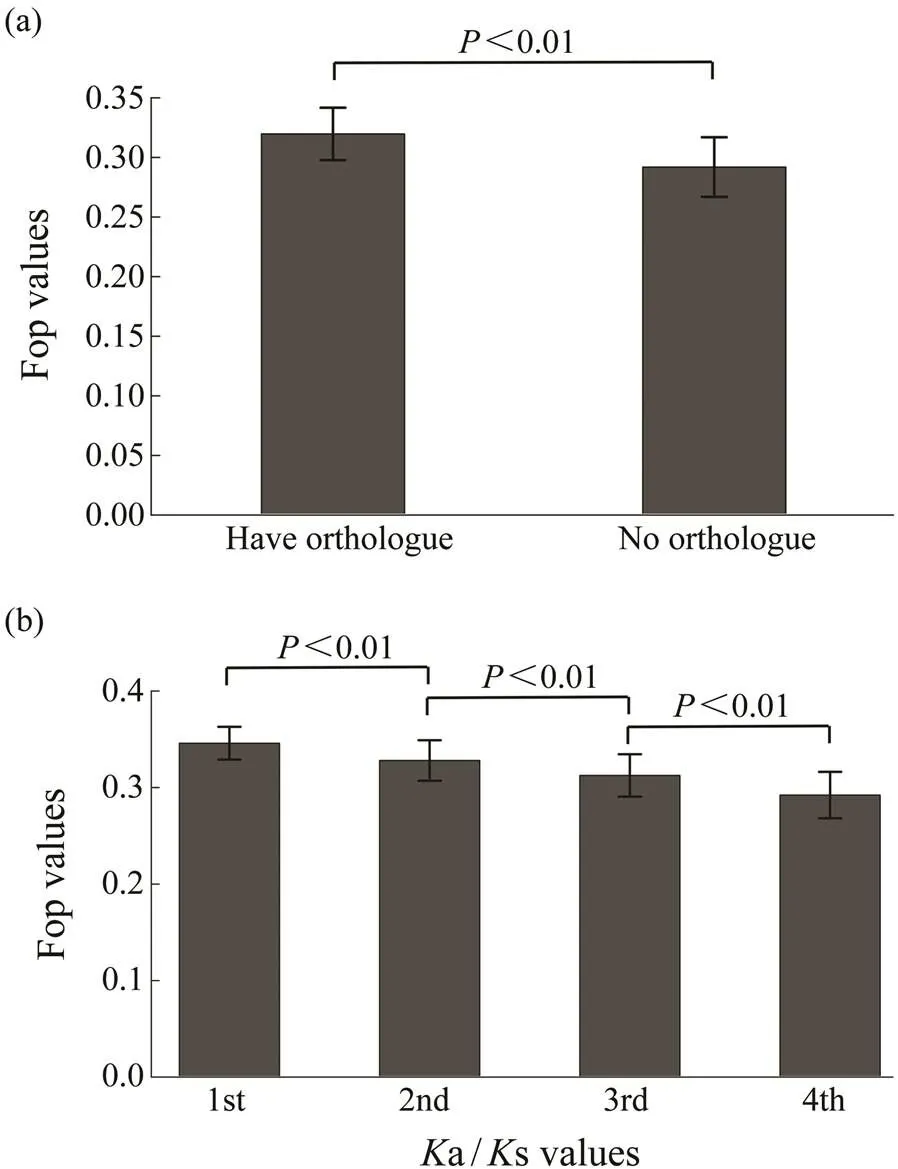
Fig.2 Relationship of Fop with selective pressures. (a), Fop values for genes with orthologs and without orthologs; (b), Relationships of Fop with Ka/Ks values. Genes with or- thologs are divided into four different groups based on the Ka/Ks values from the bottom 25% to the top 25%. The difference of Fop values among these groups were signi- ficant (Wilcoxon rank sum test, P<0.01).
3.4 Relationship Between Codon Bias and Mutational Bias
Although the oyster genome is AT-biased, the predomi- nant mutation is GC→AT, irrespective of the genomic re- gions (Song, 2020). Mutation bias may affect codon usage in the oyster genome because most optimal codons end with C or G. To examine this hypothesis, the extent of mu- tational biases for the third position of optimal and non- optimal codons that ended with C or G across the oyster genes were investigated. Fig.3a shows that the proportions of GC→AT or TA mutations in optimal codons were sig- nificantly lower than those in nonoptimal. Similarly, the proportion of GC→CG mutations in optimal codons was also higher than that in nonoptimal.
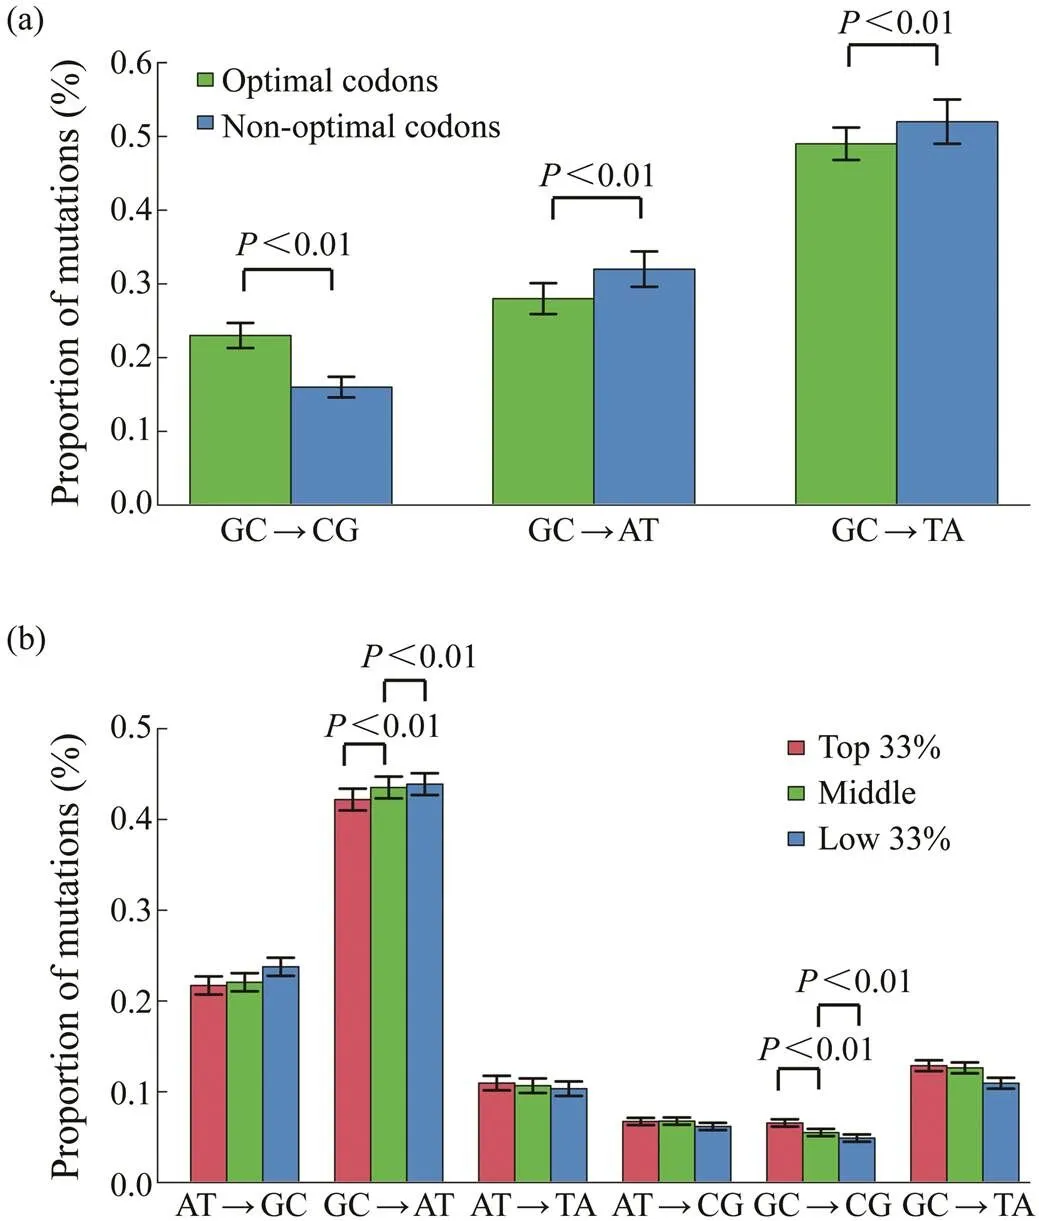
Fig.3 The relationship of Fop with mutational biases. (a), The mutational biases for optimal and nonoptimal codons that end with cytosine or guanine; (b), The relationship of Fop with mutational biases. Genes are divided into three groups based on Fop values from the bottom 33% to the top 33%.
Whether genes with different codon biases had different mutational biases was also examined. Considering the Fop values, genes were divided into three different groups from the bottom 33% to the top 33%. Genes with different co- don biases had different mutational bias patterns as shown in Fig.3b. The genes with the top 33% Fop values had significantly lower rate of GC→AT mutations and higher rate of GC→CG mutations than the other two groups of genes (Pearson-χ2test,<0.01).
3.5 Relationship Between Codon Bias and Nucleotide Diversity
The relationship between codon bias and nucleotide di- versity was determined using whole genome resequencing data from 40 wildsamples. Results show a nega- tive correlation between codon bias and nucleotide diver- sity in the coding regions of genes (=?0.1103,<0.01, Fig.4a). Meanwhile, Fig.4b shows that codon bias was al- so negatively associated with nucleotide diversity in intro- nic regions of genes (=?0.0791,<0.01).
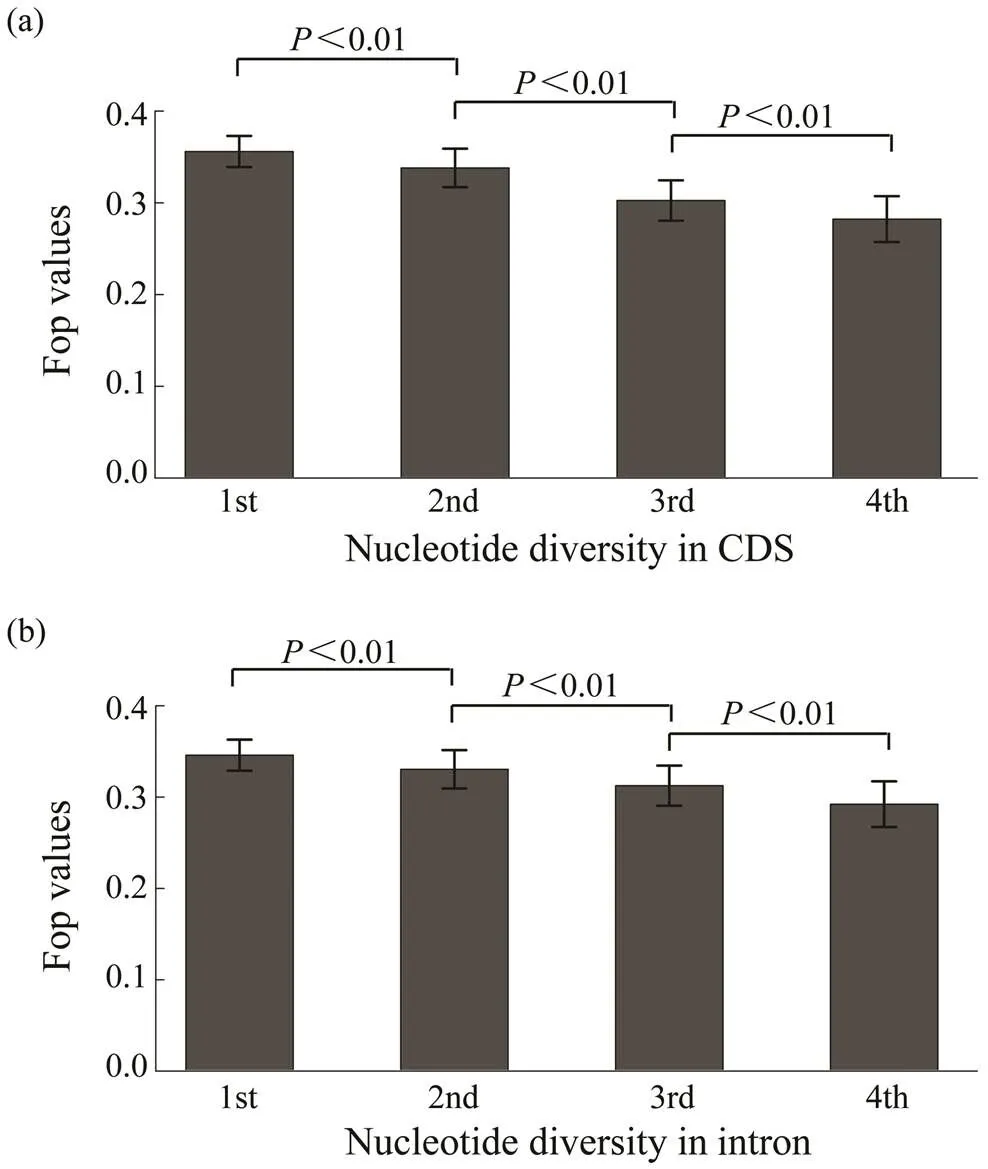
Fig.4 The relationship of Fop with nucleotide diversity in coding and intronic regions. Genes were divided into four groups based on nucleotide diversity from the bottom 20% to the top 20%. The difference of Fop values among these groups are significant (Wilcoxon rank sum test, P<0.01).
3.6 Synonymous Codons Experience Different Selective Pressures
The fourfold degenerate codons were chosen to investigate whether synonymous codons experienced different selective pressures by comparing their nucleotide diversity. Nine of the seventeen optimal codons were fourfold degenerate codons, including CUC, CUG, GUC, GUG, UCC,CCC, ACC, GCC, and GGA. The nucleotide diversity of thethird position for these nine optimal codons was about 15% lower than the average value of all the fourfold degenerate codons (θ,optimal codons/θ,fourfold degeneratecodons=0.8518), which reflects the varying selective pressures among these fourfold degenerate codons.
Then, the nucleotide diversity of the third position between the nine optimal codons and their synonymous co- dons were compared. The results in Fig.5 show that seven optimal codons CUG, GUG, UCC, CCC, ACC, GCC, and GAA had the lowest nucleotide diversity among the synonymous codons. The nucleotide diversity of CUC and GUC was not the lowest among their synonymous codons com- pared with other corresponding optimal codons.
4 Discussion
Codon usage pattern in the oyster genome was investigated in this study. Seventeen codons were identified as putatively optimal across thegenome using the ΔRSCU method. Almost all putatively optimal codons end with C or G, which is consistent with the observations in other eukaryotes genomes, such as,,,,and(Nekrutenko and Li, 2000; Ingvarsson, 2007; Vi-cario., 2007; Rao., 2011; Kober and Pogson, 2013).
Results showed that codon bias was positively associated with gene expression levels, which was also observed in other organisms (Gouy and Gautier, 1982; Duret and Mouchiroud, 1999; Goetz and Fuglsang, 2005; Ingvarsson, 2007). Gene expression levels had strong impact on protein evolution rates. In a previous study on a bivalve genome, genes with higher expression levels tend to be strongly affected by natural selection, evolve slowly, and have lower levels of nucleotide diversity (Song., 2018). In addition, codon bias was observed to be positively as- sociated with gene expression breadth. Genes expressed in more tissues and developmental stages were thought to be more important and more strongly affected by natural selection. Thus, to achieve more efficient and accurate trans- lation, the positive correlation between codon bias and gene expression can be interpreted by natural selection (Soren- sen., 1989; Duret, 2002; Stoletzki and Eyre-Walker, 2007).
Nucleotide composition of synonymous sites is expect- ed to be similar with that of introns and flanking regions if mutation bias causes codon usage bias. Because it has anAT-biased genome,is a suitable specie for test- ing mutation bias. Almost all 17 preferred codons ended with C or G at their third positions despite the overall AT bias. In this study, GC contents in introns and ?anking re- gions are similar with the genome-wide average but are dif- ferent with those in coding regions, which cannot explainthe mutational bias shaping the patterns of codon bias. Fur- thermore, mutational bias patterns for optimal and nonop- timal codons and their difference, which might affectthe patterns of codon bias in, were also investigated.
This study shows that codon bias is associated with nu- cleotide diversity, which is another evidence that natural selection shapes the codon usage pattern. The higher the nucleotide diversity value in coding regions, the less na- tural selection the gene experienced. Thus natural selection acting on codon usage can explain the negative associa- tion between nucleotide diversity and codon bias; how- ever, the mechanism needs further investigation.
Optimal codons had lower levels of nucleotide diversity than their synonymous codons, which can be viewed as theconsequence of natural selection. Synonymous codons ex- perience different selective pressures in the oyster geno- me despite they code the same amino acid. Optimal co- dons with lower levels of nucleotide diversity are assumed to be more important for natural selection. Codons recognized by more abundant tRNA molecules are considered to have higher translation efficiency and fewer translation errors compared with less frequently used codons. Thus, selection may favor the use of the optimal codons. To my best knowledge, this study is the first one to provide the evidence that different synonymous codons experience dif- ferent selective pressures in the molluscan genome.
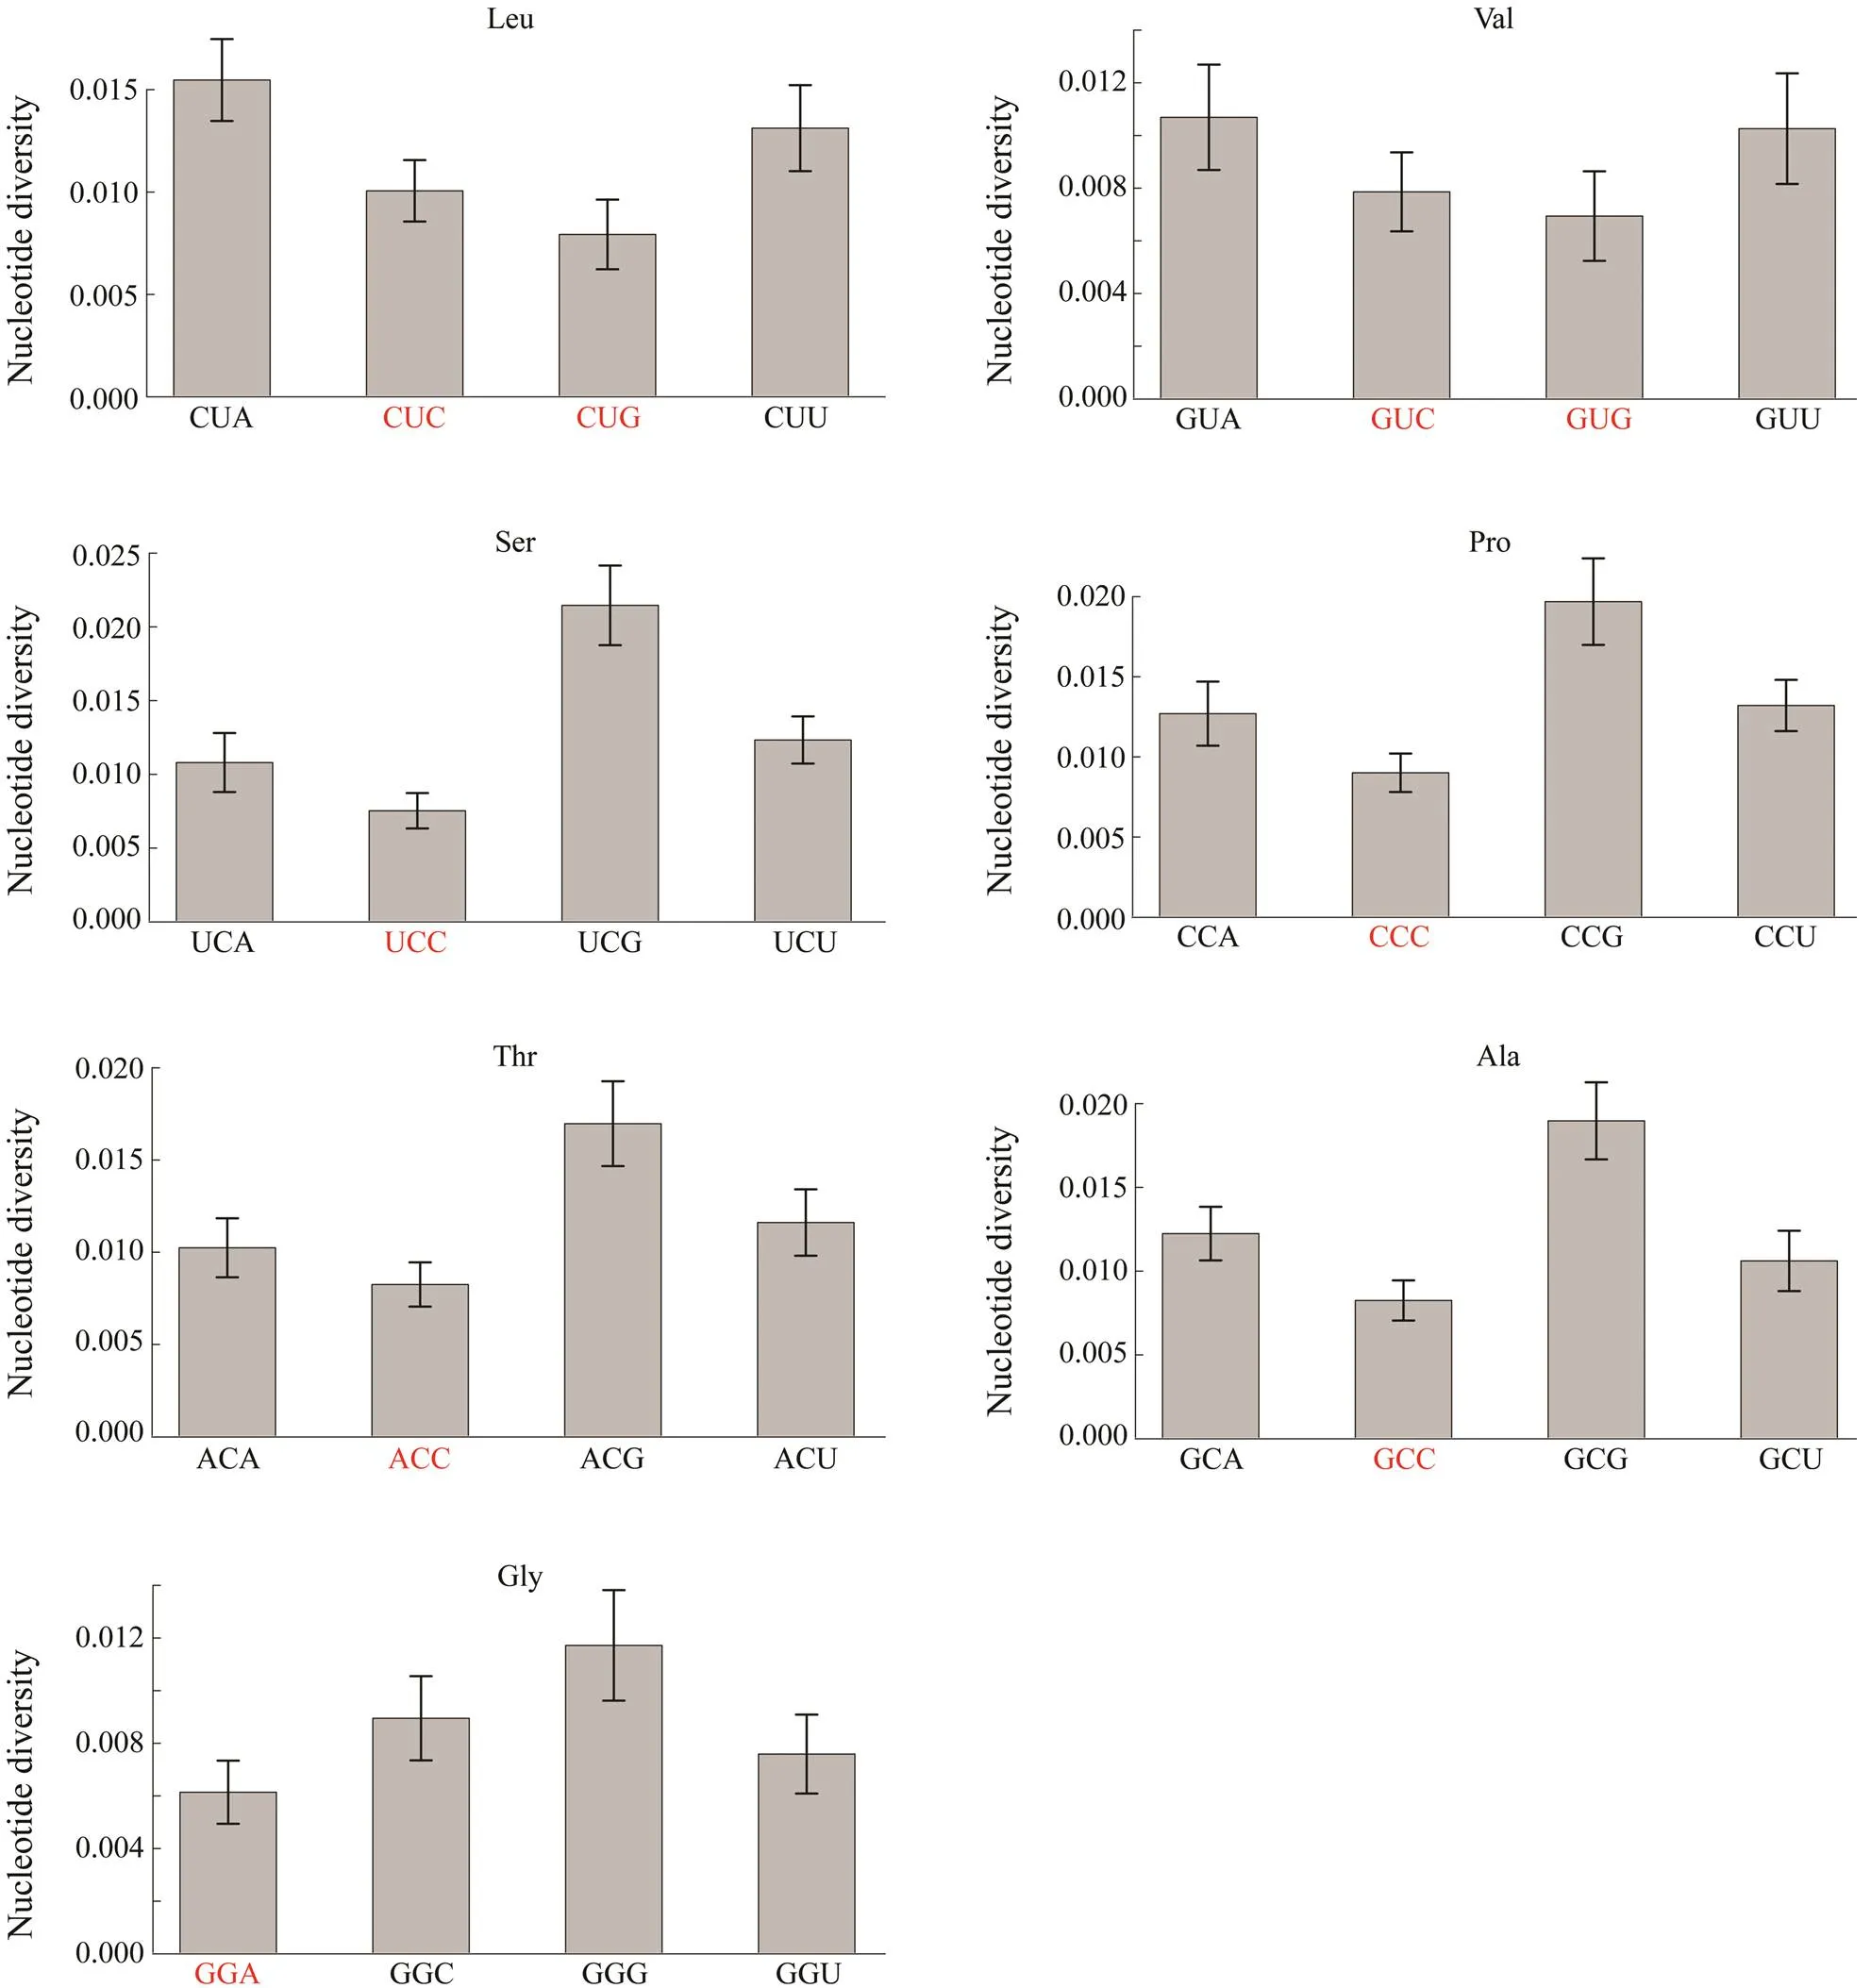
Fig.5 The comparison of nucleotide diversity for the last position between optimal codons and their synonymous codons. Optimal codons are marked in red color. When comparing each pair of codons, optimal codons have significantly lower nucleotide diversity than their synonymous codons (Pearson-χ2 test, P<0.01).
Acknowledgement
This research was supported by the National Natural Sci- ence Foundation of China (No. 11701546).
Akashi, H., Kliman, R. M., and Eyre-Walker, A., 1998. Mutation pressure, natural selection, and the evolution of base compo- sition in., 102 (3):49-60, DOI: 10.1023/ A:1017078607465.
Bulmer, M., 1991. The Selection-Mutation-Drift theory of synonymous codon usage., 129 (3):897-907, DOI: 10. 1016/1050-3862(91)90016-K.
Chamary, J. V., Parmley, J. L., and Hurst, L. D., 2006. Hearing si- lence: Non-neutral evolution at synonymous sites in mammals., 7:98-108, DOI: 10.1038/nrg1770.
Chen, S. L., Lee, W., Hottes, A. K., Shapiro, L., and Mcadams, H. H., 2004. Codon usage between genomes is constrained by genome-wide mutational processes., 101 (10): 3480-3485, DOI: 10. 1073/pnas.0307827100.
Duret, L., 2003. Evolution of synonymous codon usage in meta- zoans., 12 (6):640-649, DOI: 10.1016/S0959-437x(02)00353-2.
Duret, L., and Mouchiroud, D., 1999. Expression pattern and, surp-risingly, gene length shape codon usage in,, and., 96 (8): 4482-4487, DOI: 10.1073/pnas.96.8. 4482.
Gagnaire, P. A., Lamy, J. B., Cornette, F., Heurtebise, S., Dégre- mont, L., Flahauw, E.,., 2018. Analysis of genome-wide differentiation between native and introduced populations of the cupped oystersand., 10:2518-2534, DOI: 10. 1093/gbe/evy194.
Goetz, R. M., and Fuglsang, A., 2005. Correlation of codon bias measures with mRNA levels: Analysis of transcriptome data from, 327 (1):4-7, DOI: 10.1016/j.bbrc.2004.11. 134.
Gouy, M., and Gautier, C., 1982. Codon usage in bacteria: Cor- relation with gene expressivity., 10 (22): 7055-7074, DOI: 10.1093/nar/10.22.7055.
Grantham, R., Gautier, C., Gouy, M., Mercier, R., and Pave, A., 1980. Codon catalog usage and the genome hypothesis., 8:R49-R62, DOI: 10.1093/nar/8.1.197-c.
Guo, X. M., Li, C., Wang, H., and Xu, Z., 2018. Diversity and evolution of living oysters., 37:755-772, DOI: 10.2983/035.037.0407.
Hershberg, R., and Petrov, D. A., 2008. Selection on codon bias., 42 (1):287-299, DOI: 10.1146/ annurev.genet.42.110807.091442.
Hildebrand, F., Meyer, A., and Eyre-Walker, A., 2010. Evidence of selection upon genomic GC-content in bacteria., 6 (9):e1001107, DOI: 10.1371/journal.pgen.1001107.
Ikemura, T., 1985. Codon usage and tRNA content in unicellular and multicellular organisms., 2:13-34, DOI: 10.1093/oxfordjournals.molbev.a040335.
Ingvarsson, P. K., 2007. Gene expression and protein length in- fluence codon usage and rates of sequence evolution in., 24:836-844, DOI: 10.1093/molbev/msl212.
Kanaya, S., Yamada, Y., Kinouchi, M., Kudo, Y., and Ikemura, T.,2001. Codon usage and tRNA genes in eukaryotes: Correlation of codon usage diversity with translation efficiency and with CG-dinucleotide usage as assessed by multivariate analysis., 53:290-298, DOI: 10.1007/ s002390010219.
Kim, D., Landmead, B., and Salzberg, S. L., 2015. HISAT: A fastspliced aligner with low memory requirements., 12: 357-U121, DOI: 10.1038/nmeth.3317.
Knight, R. D., Freeland, S. J., and Landweber, L. F., 2001. A sim- ple model based on mutation and selection explains trends in codon and amino-acid usage and GC composition within and across genomes., 2 (4):research0010.1, DOI: 10.1186/gb-2001-2-4-research0010.
Kober, K. M., and Pogson, G. H., 2013. Genome-wide patterns of codon bias are shaped by natural selection in the purple sea urchin,., 3:1069-1083, DOI: 10.1534/g3.113.005769.
Li, C. Y., Wang, J., Song, K., Meng, J., Xu, F., Li, L.,., 2018a. Construction of a high-density genetic map and fine QTL mapping for growth and nutritional traits of., 19:626, DOI: 10.1186/s12864-018-4996-z.
Li, H., and Durbin, R., 2009. Fast and accurate short read align- ment with Burrows-Wheeler transform., 25:1754-1760, DOI: 10.1093/bioinformatics/btp324.
Li, H., Handsaker, B., Wysoker, A., Fennell, T., Ruan, J., Homer, N.,., 2009. The Sequence Alignment/Map format and SAMtools., 25:2078-2079, DOI: 10.1093/bio informatics/btp352.
Li, L., Li, A., Song, K., Meng, J., Guo, X., Li, S.,., 2018b. Divergence and plasticity shape adaptive potential of the Pacific oyster., 2:1751, DOI: 10. 1038/s41559-018-0668-2.
Li, Y. L., Sun, X. Q., Hu, X. L., Xun, X. G., Zhang, J. B., Guo, X. M.,, 2017. Scallop genome reveals molecular adaptations to semi-sessile life and neurotoxins., 8:1721, DOI: 10.1038/S41467-017-01927-0.
Musto, H., Cruveiller, W., D’onofrio, G., Romero, H., and Bernardi, G., 2001. Translational selection on codon usage in., 18:1703-1707, DOI: 10.1093/oxfordjournals.molbev.a003958.
Nam, B. H., Kwak, W., Kim, Y. O., Kim, D. G., Kong, H. J., Kim, W. J.,., 2017. Genome sequence of Pacific abalone (): The first draft genome in family., 6 (5): gix014, DOI: 10.1093/gigasci ence/gix014.
Nekrutenko, A., and Li, W. H., 2000. Assessment of composi- tional heterogeneity within and between eukaryotic genomes., 10:1986-1995, DOI: 10.1101/gr.10.12. 1986.
Pertea, M., Kim, D., Pertea, G. M., Leek, J. T., and Salzberg, S. L., 2016. Transcript-level expression analysis of RNA-seq experi- ments with HISAT, StringTie and Ballgown., 11:1650-1667, DOI: 10.1038/nprot.2016.095.
Pertea, M., Pertea, G. M., Antonescu, C. M., Chang, T. C., Men- dell, J. T., and Salzberg, S. L., 2015. StringTie enables im- proved reconstruction of a transcriptome from RNA-seq reads., 33:290, DOI: 10.1038/nbt.3122.
Rao, Y. S., Wu, G. Z., Wang, Z. F., Chai, X. W., Nie, Q. H., and Zhang, X. Q., 2011. Mutation bias is the driving force of co- don usage in thegenome., 18:499-512, DOI: 10.1093/dnares/dsr035.
Sharp, P. M., Emery, L. R., and Zeng, K., 2010. Forces that in- fluence the evolution of codon bias., 365:1203- 1212, DOI: 10.1098/rstb.2009.0305.
Simakov, O., Marletaz, F., Cho, S. J., Edsinger-Gonzales, E., Hav-lak, P., Hellsten, U.,., 2013. Insights into bilaterian evolu- tion from three spiralian genomes., 493:526-531, DOI: 10.1038/nature11696.
Song, K., 2020. Genomic landscape of mutational biases in the Pacific oyster., 11: 11, DOI: 10.1093/gbe/evaa160.
Song, K., Li, L., and Zhang, G. F., 2018. Relationship among in- tron length, gene expression, and nucleotide diversity in the Pa- cific oyster., 20 (5): 676-684, DOI: 10.1007/s10126-018-9838-0.
Song, K., Li, L., and Zhang, G. F., 2016. Coverage recommen- dation for genotyping analysis of highly heterologous species using next-generation sequencing technology., 6 (1): e35736, DOI: 10.1038/Srep35736.
Sorensen, M. A., Kurland, C. G., and Pedersen, S., 1989. Codon usage determines translation rate in., 207:365-377, DOI: 10.1016/0022-2836 (89)90260-X.
Stoletzki, N., and Eyre-Walker, A., 2007. Synonymous codon usage in: Selection for translational accuracy., 24:374-381, DOI: 10.1093/ molbev/msl166.
Sun, J., Zhang, Y., Xu, T., Zhang, Y., Mu, H., Zhang, Y.,.,2017. Adaptation to deep-sea chemosynthetic environments as revealed by mussel genomes., 1:0121, DOI: 10.1038/s41559-017-0121.
Vicario, S., Moriyama, E. N., and Powell, J. R., 2007. Codonusage in twelve species of., 7: 226, DOI: 10.1186/1471-2148-7-226.
Wang, S., Zhang, J., Jiao, W., Li, J., Xun, X., Sun, Y.,., 2017. Scallop genome provides insights into evolution of bilaterian karyotype and development., 1:0120, DOI 10.1038/s41559-017-0120.
Wei, L., Xu, F., Wang, Y., Cai, Z., Yu, W., He, C.,., 2018. The molecular differentiation of anatomically paired left and right mantles of the Pacific oyster., 20 (4):1-11, DOI: 10.1007/s10126-018-9806-8.
Xu, L., Li, Q., Yu, H., and Kong, L., 2017. Estimates of heri- tability for growth and shell color traits and their genetic correlations in the black shell strain of Pacific oyster., 19:421-429, DOI: 10.1007/ s10126-017-9772-6.
Yue, C., Li, Q., and Yu, H., 2018. Gonad transcriptome analysis of the Pacific oysteridentifies potential ge- nes regulating the sex determination and differentiation pro- cess., 20:206-219, DOI: 10.1007/s10 126-018-9798-4.
Zhang, G. F., Fang, X. D., Guo, X. M., Li, L., Luo, R. B., Xu, F.,., 2012. The oyster genome reveals stress adaptation and complexity of shell formation., 490:49-54, DOI: 10. 1038/nature11413.
. E-mail: songkai1987@126.com
August 25, 2020;
October 26, 2020;
January 19, 2021
? Ocean University of China, Science Press and Springer-Verlag GmbH Germany 2021
(Edited by Qiu Yantao)
 Journal of Ocean University of China2021年5期
- Journal of Ocean University of China的其它文章
- Numerical Modelling for Dynamic Instability Process of Submarine Soft Clay Slopes Under Seismic Loading
- DcNet: Dilated Convolutional Neural Networks for Side-Scan Sonar Image Semantic Segmentation
- Bleaching with the Mixed Adsorbents of Activated Earth and Activated Alumina to Reduce Color and Oxidation Products of Anchovy Oil
- The Brown Algae Saccharina japonica and Sargassum horneri Exhibit Species-Specific Responses to Synergistic Stress of Ocean Acidification and Eutrophication
- Effects of Dietary Protein and Lipid Levels on Growth Performance, Muscle Composition, Immunity Index and Biochemical Index of the Greenfin Horse-Faced Filefish (Thamnaconus septentrionalis) Juvenile
- Transcriptome Analysis Provides New Insights into Host Response to Hepatopancreatic Necrosis Disease in the Black Tiger Shrimp Penaeus monodon