
SimET: An open-source tool for estimating crop evapotranspiration and soil water balance for plants with multiple growth cycles
2023-10-27 12:18:58MinguoLiuMeiYangHuiminYang
The Crop Journal 2023年5期
Minguo Liu,Mei Yang,Huimin Yang
State Key Laboratory of Herbage Improvement and Grassland Agro-ecosystems,College of Pastoral Agriculture Science and Technology,Lanzhou University,Lanzhou 730020,Gansu,China
Keywords: Crop evapotranspiration Soil water balance Evapotranspiration model R package
ABSTRACT Accurate estimation of crop evapotranspiration(ETc)and soil water balance,which is vital for optimizing water management strategy in crop production,can be performed by simulation.But existing software has many deficiencies,including complex operation,limited scalability,lack of batch processing,and a single ETc model.Here we present simET,an open-source software package written in the R programming language.Many concepts involved in crop ETc simulation are condensed into functions in the package.It includes three widely used crop ETc models built on these functions: the single-crop coefficient,double-crop coefficient,and Shuttleworth-Wallace models,along with tools for preparing model data and comparing estimates.SimET supports ETc simulation in crops with repeated growth cycles such as alfalfa,a perennial forage crop that is cut multiple times annually.
1.Introduction
Drought is a global challenge to agricultural production [1,2].Accurate estimation of crop evapotranspiration (ETc) and soil water balance is vital for effective water management in crop production[3,4].Even in rainfed agricultural environments,such estimates are necessary for determining the effectiveness of field management techniques such as mulching,in reducing crop water use [5].Because ETc and other components of the soil water balance remain difficult to quantify directly,their estimation is usually by simulation [3].Consequently,the use of effective and adaptable modeling methods is crucial in investigations of ETc and soil water balance.
The most commonly used models for simulating ETc are the single-crop coefficient model [6],double-crop coefficient model[6] and Shuttleworth-Wallace (S-W) model [7].They have been used to model the ETc characteristics of maize under drip irrigation[8],sweet sorghum under drip irrigation [8],vineyard under furrow irrigation [9],wheat under rainfed and surface irrigation[10],furrow irrigated cotton [10],soybean under basin irrigation[11],wine grapes under subsurface drip irrigation [12],alfalfa under flood irrigation[3]etc.Successful attempts have been made to predict ETc with machine learning algorithms.A support vector machine model was applied by Shrestha and Shukla [13] to estimate ETc and crop coefficients.In a rainfed maize field under partial plastic film mulching and non-mulching,ETc was modeled with a support vector machine and an artificial neural network optimized by a genetic algorithm [14].The large amount of training data required by machine learning algorithms limits their use in irrigation management.
Most researchers have employed closed modeling software for their work,despite the fact that several publications have detailed calculation procedures for widely used ETc models.CROPWAT[15]and SIMDualKc [16],based on the single-and double-crop coefficient model respectively,are currently the main tools used to simulate ETc and soil water balance.Both tools can be used only through an interactive graphical interface,which streamlines learning but restricts the flexibility of the models.Data preparation and result analysis are hindered by unique input and output formats.Model parameters can be entered only manually,preventing batch preparation.Each software package applies only one model,making it difficult to compare models.It is often desirable to simulate and compare various scenarios,consider various water processes ignored by existing tools,and compare the simulation results from various models or software applications.These requirements are often difficult to meet with closed software,and reprogramming a new model from scratch is difficult,especially for the non-specialist [17].A tool that simplifies operation,is scalable,and readily integrates multiple commonly used models and scenarios is desirable.
Several recent attempts have been made to develop models using script languages such as Python,R,and MATLAB.These languages share the following advantages: simplicity in learning,robust data management and data analysis features,and strong iteration and batch processing capability.More crucially,it is possible to comprehend and alter the simulation process that underlies models created based on these languages.AquaCrop is a widely used crop-water model based on a graphical user interface(GUI).Updated versions of this model have been developed based on the above script languages,including AquaCrop-OpenSource[18],AquaCropR [19] and AquaCrop-OSPy [17].The development of these tools makes AquaCrop more flexible.Guo et al.[20]developed an R package,Evapotranspiration,to integrate multiple models to simulate large-scale evapotranspiration.These tools are open-source and reduce the complexity of operation,but they are not designed specifically for studying ETc and soil water balance.
Here we describe simET,a fully open-source package written in the R language,a flexible and potent language and environment for statistical and graphical analysis that can interface with a variety of systems and languages[16,21].The purpose of this paper is to give a brief overview of the theoretical background,major functions,applications,advantages,and limitations of this software package.
2.Materials and methods
2.1.SimET description
The simET package implements three models that are frequently used to simulate ETc (Tables S1,S2): the single-crop coefficient model [6],double-crop coefficient model [6],and S-W model [7].It was intended to aid researchers in simulating daily ETc characteristics and soil water balance under field conditions.It provides a variety of tools for preparing input data and comparing results.
2.1.1.Theoretical background
whereDr,iandDr,i-1are the daily depletion of root zone water at the end of daysiandi-1 (mm),Pis precipitation (mm),RO is surface runoff (mm),Iis irrigation (mm),CR is capillary rise (mm) from the water table,ETa is actual evapotranspiration (mm),and DP is deep percolation (mm).ETa is estimated by the evapotranspiration models encapsulated in simET (Figs.S1-S4).CR and DP in the root layer are calculated following Liu et al.[22] and Allen et al.[6],respectively.
2.1.2.Model development
The three models implemented in simET were developed to allow evapotranspiration simulation with plants experiencing several growth cycles,making simET helpful for studying the water use of perennial forage crops,e.g.,alfalfa (Medicago sativaL.) and annual crops such as maize (Zea maysL.) and wheat (Triticum aestivumL.).As a perennial forage crop,alfalfa differs from conventional grain crops [3].It produces dry matter during the whole year if the climate is favorable,with high annual water consumption (800-1600 mm).It can be cut for harvesting several times a year and regrows to harvest.It has strong biological N2fixation that varies among ages and cuts,affecting productivity and water use.For this reason,its water consumption differs among cuts and years.SimET may provide an option to estimate ETc and soil water dynamics in the plant of multiple growth cycles.
CR is typically ignored in several models,although it is an important soil water process.Accordingly,a function in simET,cal_CapillaryRise(),was developed to estimate it,following Liu et al.[22].
2.1.3.Main functions
Because the three models share numerous similar calculation processes,we developed ‘‘building block” functions to reduce redundant calculation processes (Figs.S1-S4).We encapsulated in a function the calculation for each of the concepts contained in these models,following primarily Allen et al.[6] and Teh[23,24].These functions were split into two categories: general and model functions(Fig.1).Each category contained many calculation functions,called ‘‘blocks” (Tables S3-S5).
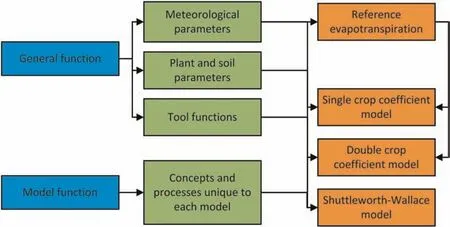
Fig.1.Modeling scheme of the simET package.
General functions in simET were written mostly for calculating meteorological parameters,unit conversion,and missing-value estimation,operations repeatedly needed(Tables S3,S4).In particular,a function,cal_ET0_from_PM_for_daily(),was written to compute daily reference evapotranspiration (ET0) (Table S2).Two functions,cal_CapillaryRise() and cal_DeepPercolation(),were written to estimate CR and DP,respectively,in the root layer,both following Liu et al.[22].Model functions,in contrast,comprised functions specific to the distinct models(Table S5).The three models in the package were constructed using general functions and model functions (Figs.1,S1-S4).
2.2.Experimental data collection and model evaluation
2.2.1.Experimental design
A field experiment was performed from 2018 to 2019 in Suzhou district (39.67°N,98.80°E,1368 m above sea level),Jiuquan city,Gansu province,China [25].Alfalfa was grown under flood irrigation and subsurface drip irrigation with three deficit irrigation treatments.The experimental treatments were arranged in a split-plot design with irrigation system as main plot and deficit irrigation level as subplot.Deficit irrigation levels included full irrigation as control (CK,100%),slight deficit irrigation(SD,70%),and moderate deficit irrigation (MD,50%).The irrigation time for CK was determined by measuring the usable soil water in the reference soil layer,in this study the 0-100 cm layer.The soil type was sandy loam and the roots of alfalfa were distributed mainly in this soil profile during the experiment.In this site,alfalfa can be cut three times a year and growth last for about 6 months.
I was trying to arrange to take a bus tomorrow, she said. But my friend said, ‘No way! She s going to drive me there right now. We ll get in about 2 am.
2.2.2.Data collection
2.2.2.1.Meteorological parameters.A fully automatic microweather station (Insentek,Hangzhou,Zhejiang,China) near the experimental site was used.Meteorological data recorded every minute,were air temperature,air humidity,atmospheric pressure,solar radiation,wind speed at 2.0 m height,and rainfall.Daily meteorological data were then calculated:the maximum and minimum temperature,average wind speed,average and minimum relative humidity,and cumulative solar radiation and rainfall.
2.2.2.2.Plant growth parameters.The plant height and leaf area index (LAI) during alfalfa growth were recorded every 7 d in each plot using band tape and Sunscan(Delta-T Devices,London,United Kingdom),respectively.Plant height and LAI were interpolated as daily values using a logistic growth model[3].Then the maximum LAI over the season was determined.LAI and phenology were used to assess the growth stages of alfalfa following Allen et al.[6]:initial growth stage(Ini),crop development growth stage(Dev),midseason growth stage (Mid),and late season growth stage (End).Allen et al.[6] recommended a crop coefficient for stages under the standard condition (non-stressed,well-managed crops in climates of RHmin≈45%,u2≈2 m s-1),and these coefficients are automatically adjusted by the model functions Model_single_Kc()and Model_DualKc(),based on growth and weather conditions.A root drill was used to measure alfalfa root depth at the end of each year.The roots were distributed mainly in the 0-120 cm soil layer in 2018 and the 0-180 cm layer in 2019.The fully unfolded leaves of alfalfa at different phenological stages were collected,and the width of the leaves was measured with a tape.
2.2.2.3.Soil parameters.The soil textures of 0-40,40-60,and 60-200 cm are sandy loam(with 69.3%sand,26.4%silt,and 4.3%clay),sandy loam(with 51.1%sand,42.9%silt,and 6%clay),and silt loam(with 13.2%sand,75.5%silt,and 11.3%clay),respectively.The corresponding field capacities are 0.25,0.34,and 0.40 m3m-3,saturation water contents are 0.39,0.39 and 0.41 m3m-3,and wilting points are 0.04,0.05,and 0.08 m3m-3.Soil water in the root layer was monitored at 0.2-m depth intervals in each plot every 3 d with a manual time domain reflectometry instrument,TRIME-PICO-IPH(IMKO,Ettlingen,Germany).Four observation wells for groundwater level were located in the experimental site.Groundwater levels in these wells were recorded when soil water content was measure,and varied from 3.5 to 5.0 m during the experiment.Daily values were estimated using the linear_interpolation() function in simET.Measurement methods followed Liu et al.[3,25],and Table S6.
2.2.3.Model evaluation
Three statistical parameters were used to evaluate model errors: mean error (ME,Eq.(2)),mean absolute error (MAE,Eq.(3)),and root mean square error(RMSE,Eq.(4))[26].Simple linear regression was used to fit the relationship between measured (M)and simulated values (S),andR2was calculated.
3.Results and discussion
3.1.Workflow in simET
The simET package was employed mainly for simulating ETc and soil water dynamics in fields.Of the many functions,only a few are used in evapotranspiration simulation,making it easier for users to estimate daily evapotranspiration and soil water.Simulation was divided into three steps:input,evaluation and simulation,output.Corresponding functions for each step are shown in Fig.2.Relevant examples and reusable code are provided in Supporting Information 1.
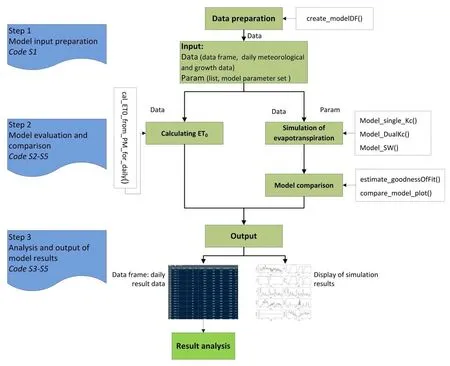
Fig.2.Simplified workflow for evapotranspiration simulation in simET.ET0,reference evapotranspiration.
3.2.Model evaluation
3.2.1.Calculation of reference evapotranspiration
The function,cal_ET0_from_PM_for_daily(),was used to compute daily ET0.The software ET0calculator developed by FAO [27]was used as a standard for calculating ET0.There was a strong linear relationship (R2=0.999) between the estimated ET0of the simET function and the ET0calculator,and the corresponding RMSE,ME and MAE were 1.124,-0.089 and 0.102,respectively (Fig.3),suggested that consistency between the two methods.Compared to the ET0calculation software,simET offers the advantage of loading the required data into the R program as a data frame,eliminating several time-consuming data-preparation steps.The data preparation and analysis process are shown in Supporting Information 1.
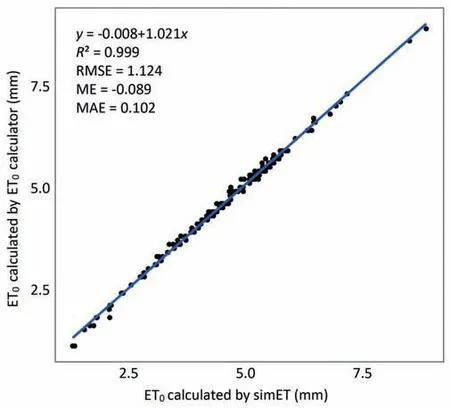
Fig.3.Comparison of reference crop evapotranspiration (ET0) calculated by simET and ET0 calculator.
3.2.2.Simulation of alfalfa evapotranspiration characteristics
The effects of deficit irrigation on evapotranspiration and soil water in the root layer of alfalfa grassland under subsurface drip irrigation were simulated using the double-crop coefficient model with Model_DualKc() function,verifying the support of simET for plants with multiple growth cycles.The model output daily evaporation and transpiration dynamics and soil water dynamics in the root layer (Fig.4).The model accurately simulated changes of soil water in the root layer over two years,givingR2values as high as 0.82 (Fig.4B).The RMSE ranged from 30.42 to 71.74 mm,the ME ranged from -8.87 to 11.96 mm,and MAE ranged from 9.25 to 19.46 mm.Simulation showed that deficit irrigation markedly alters the transpiration dynamics and soil water of alfalfa under subsurface drip irrigation (Fig.4A).
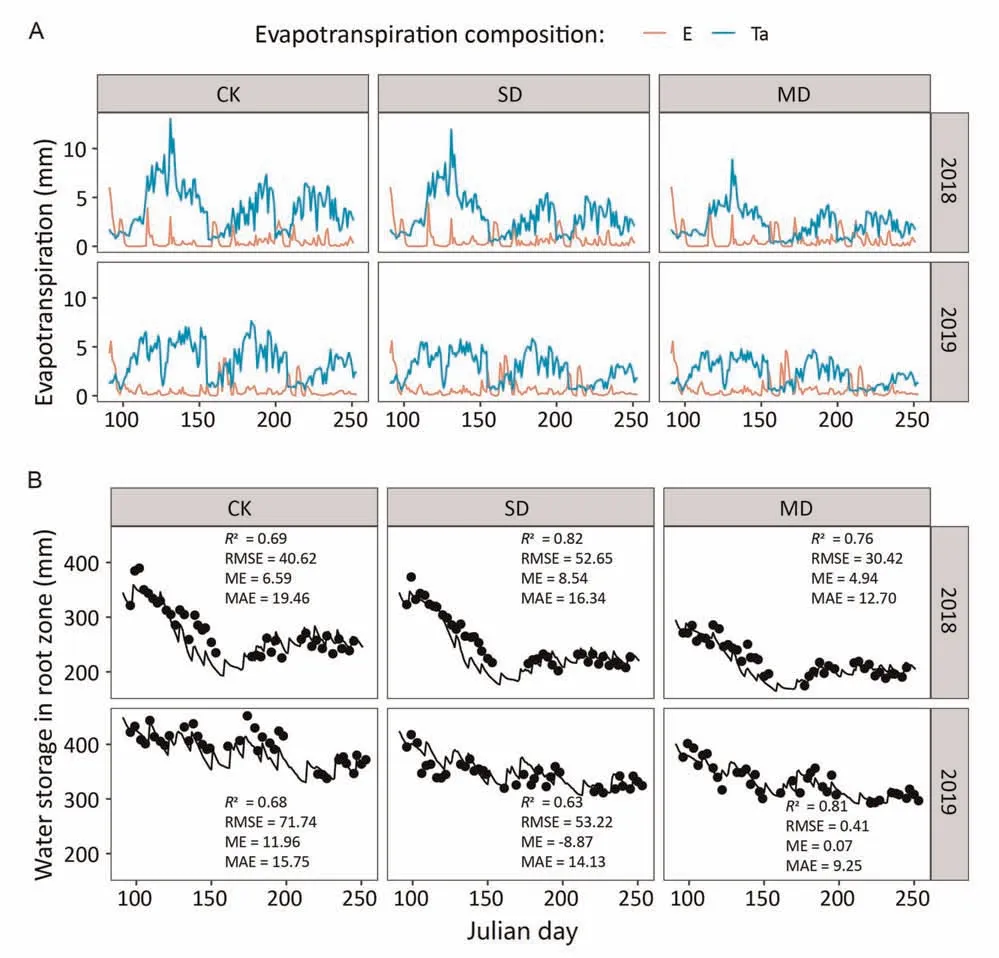
Fig.4.Effects of deficit irrigation on evapotranspiration characteristics and soil water of alfalfa under subsurface drip irrigation.(A) Evapotranspiration characteristics.(B)Measured and simulated values of water storage in the root zone.Points represent measured values and lines represent simulated values.CK,full irrigation as control;SD,slight deficit irrigation;MD,moderate deficit irrigation.
3.2.3.Comparison of three main evapotranspiration models
We provided a fast model comparison in simET.Each model was encapsulated by a function and could be applied by calling that function.The key to model comparison was the preparation of parameters for various models when simulating the same experimental scenario.As a consequence,it was simple to compare the output results (evapotranspiration and soil water) from various models.In simET,a function,compare_model_plot(),is called to conveniently compare models,and take the output results as parameters to show the simulation effects of various models.Fig.5 shows the output results(evapotranspiration and soil water)and predicted performance of the three models under full flood irrigation (CK/control).The simulation effect of the S-W model(R2=0.54) was slightly lower than those of the other two models(Single Kc: 0.7;Dual Kc: 0.74).The parameters of S-W model are much more complex and difficult to measure or calculate,possibly accounting for the poor simulation effect.The setting of model parameters followed Teh [24].The data preparation and analysis process are shown in Supporting Information 1.
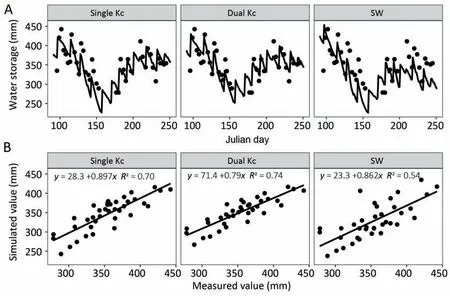
Fig.5.Comparison of water storage in the root zone from three models in simET.(A) Measured and simulated values of water storage in the root zone.(B) Relationship between measured and simulated water storage in the root zone.Single Kc,single-crop coefficient model;Dual Kc,double-crop coefficient model;SW,Shuttleworth-Wallace model.
3.3.Model application
SimET is intended for simulating ETc and soil water balance in annual crops such as corn and wheat and perennial forage crops such as alfalfa in the field.Evaluation of evapotranspiration and soil water is helpful for determining the effect of irrigation on evapotranspiration and soil water dynamics,determining appropriate irrigation management,and determining the degree of water stress under diverse irrigation techniques[3].SimET can calculate ET0and potential evaporation and transpiration for input into other models such as Hydrus [28].SimET is also suitable for comparing the results of multiple evapotranspiration models.Although the models implemented in simET are widely used,some parameters need to be localized for specific areas and crops,and can be obtained or corrected from measured data.
3.4.Model advantages
SimET was developed to remedy the deficiencies of existing evapotranspiration model software,including complex operation,limited scalability,batch processing difficulties,and restriction to one model.There are many advantages of simET compared to the mainstream software available for evapotranspiration simulation and irrigation research (Table 1).First,it simplifies data preparation,model simulation,and result analysis (example 1 in Support Information 1).Consequently,the model can be run quickly without manual input or tedious file format conversion[29].Second,it is an open-source package,which means that it can be modified at the source-code level to perform desired calculations.SimET encapsulates multiple processes involved in evapotranspiration research,and can reassemble a model based on these functions(Support Information 1).The internal processes of the model are easily understood.Third,by batch-modifying input data and applying R-based iteration functions,SimET can simulate multiple scenarios quickly.It can use R’s iteration function (the simplest of which is the loop) or an expanded package of optimization algorithms to optimize single or multiple parameters [30].Fourth,it implements three commonly used evapotranspiration models,which can be compared and analyzed(Example 5 in Support Information 1).
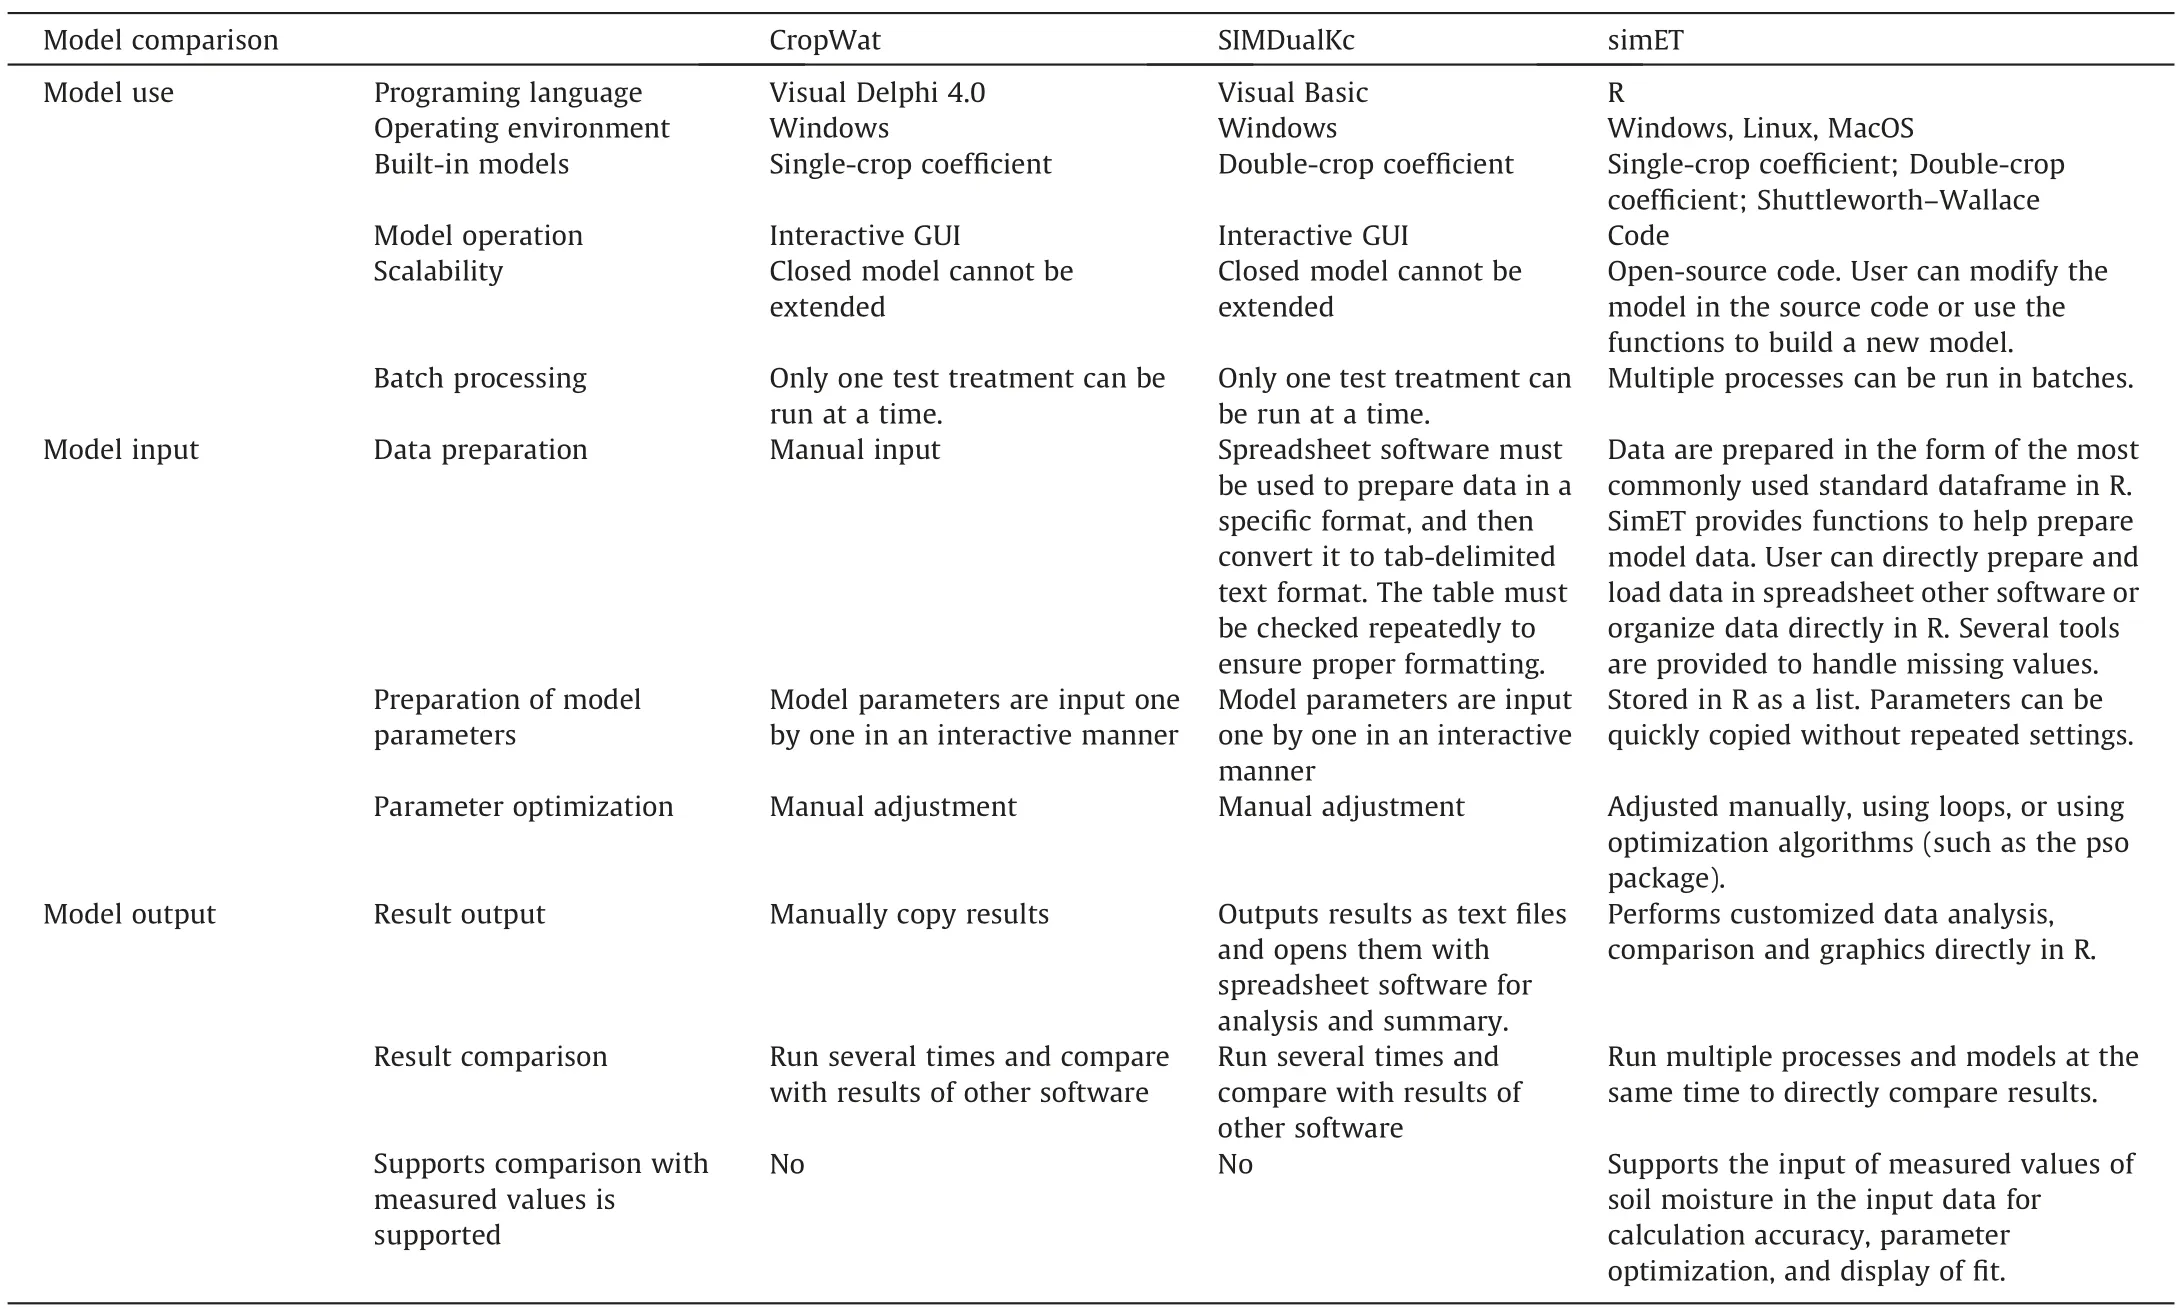
Table 1Comparison of simET with CropWat and SIMDualKc in model use,input and output.
3.5.Model limitations and future development
In the current version of simET,only single-crop evapotranspiration simulation is supported.Simulation for intercropping systems awaits development.Special conditions such as plastic film mulching are not modeled.The root layer is considered to be a layer of soil,a choice that inevitably ignores the water transport process across different depths within the root layer.This assumption has helped reduce the complexity and the parameters associated with the model.Similarly,to reduce the complexity of the model,an empirical formula rather than a mechanistic model is used to estimate capillary rise.Not all users are familiar with the R language,which is not needed for using software with a GUI.SimET’s flexibility allows extending the use of simET to plants with multiple growth cycles.To help researchers use simET smoothly,we provided some examples of using simET in Supporting Information 1.
4.Conclusions
SimET,an open-source tool written in R,is intended to estimate field evapotranspiration and soil water balance.It implements commonly used evapotranspiration models and provides auxiliary tools that can be customized and reprogrammed,accommodating crops with multiple growth cycles.
CRediT authorship contribution statement
Minguo Liu:Software development,Data curation,Investigation,Formal analysis,Visualization,Validation,Writing -original draft.Mei Yang:Resources,Writing -review &editing.Huimin Yang:Project administration,Methodology,Funding acquisition,Writing -original draft,Writing -review &editing.
Declaration of competing interest
The authors declare that they have no known competing financial interests or personal relationships that could have appeared to influence the work reported in this paper.
Acknowledgments
This work was jointly supported by the National Natural Science Foundation of China(32171679 and 32201475).We thank Dr.Meihan Liu (Tsinghua University) for help in model design.
Software and data availability
The simET package (version 1.0.0) has been submitted to the Comprehensive R Archive Network (CRAN,https://CRAN.R-pro ject.org/package=simET),and users can use R to download and use it.The data used in this article have been incorporated into the software package.
Appendix A.Supplementary data
Supplementary data for this article can be found online at https://doi.org/10.1016/j.cj.2023.03.008.

- The Crop Journal的其它文章
- Genomic location of Gb1, a unique gene conferring wheat resistance to greenbug biotype F
- Identification of candidate genes for aphid resistance in upland cotton by QTL mapping and expression analysis
- iBP-seq: An efficient and low-cost multiplex targeted genotyping and epigenotyping system
- RPNet: Rice plant counting after tillering stage based on plant attention and multiple supervision network
- SPP-extractor: Automatic phenotype extraction for densely grown soybean plants
- Improving maize growth and development simulation by integrating temperature compensatory effect under plastic film mulching into the AquaCrop model