
Characteristics of laser-induced breakdown spectroscopy of liquid slag
2024-03-19 02:37:02ChangyanDONG董長言HongxiaYU于洪霞LanxiangSUN孫蘭香YangLI李洋XiuyeLIU劉修業(yè)PingZHOU周平andShaowenHUANG黃少文
Plasma Science and Technology 2024年2期
Changyan DONG (董長言),Hongxia YU (于洪霞),Lanxiang SUN (孫蘭香),Yang LI (李洋),Xiuye LIU (劉修業(yè)),Ping ZHOU (周平) and Shaowen HUANG (黃少文)
1 State Key Laboratory of Robotics,Shenyang Institute of Automation,Chinese Academy of Sciences,Shenyang 110016,People’s Republic of China
2 Key Laboratory of Networked Control Systems,Chinese Academy of Sciences,Shenyang 110016,People’s Republic of China
3 Institutes for Robotics and Intelligent Manufacturing,Chinese Academy of Sciences,Shenyang 110169,People’s Republic of China
4 Shenyang University of Technology,Shenyang 110870,People’s Republic of China
5 Shenyang Ligong University,Shenyang 110142,People’s Republic of China
6 Shandong Iron and Steel Company Ltd.,Jinan 271105,People’s Republic of China
Abstract Rapid online analysis of liquid slag is essential for optimizing the quality and energy efficiency of steel production.To investigate the key factors that affect the online measurement of refined slag using laser-induced breakdown spectroscopy (LIBS),this study examined the effects of slag composition and temperature on the intensity and stability of the LIBS spectra.The experimental temperature was controlled at three levels: 1350 °C,1400 °C,and 1450 °C.The results showed that slag composition and temperature significantly affected the intensity and stability of the LIBS spectra.Increasing the Fe content and temperature in the slag reduces its viscosity,resulting in an enhanced intensity and stability of the LIBS spectra.Additionally,42 refined slag samples were quantitatively analyzed for Fe,Si,Ca,Mg,Al,and Mn at 1350 °C,1400 °C,and 1450 °C.The normalized full spectrum combined with partial least squares (PLS) quantification modeling was used,using the Ca II 317.91 nm spectral line as an internal standard.The results show that using the internal standard normalization method can significantly reduce the influence of spectral fluctuations.Meanwhile,a temperature of 1450 °C has been found to yield superior results compared to both 1350 °C and 1400 °C,and it is advantageous to conduct a quantitative analysis of the slag when it is in a “water-like” state with low viscosity.
Keywords: laser-induced breakdown spectroscopy (LIBS),slag,temperature,composition,viscosity,internal standard normalization,partial least squares (PLS)
1.Introduction
With continuous advancements in science and technology,improving the quality of steel has become a significant objective of steel production [1].Slag,a key by-product of the steelmaking process,is a valuable input for numerical simulations of the steelmaking process and directly influences the quality of the steel liquid and the final steel product [2-4].Real-time analysis of slag composition is essential for determining the end of smelting,ensuring the quality of smelting products,and reducing energy consumption [5].The alkalinity,viscosity,melting point,and other characteristics of slag are determined by its composition [6,7].The main components of slag are SiO2,CaO,Al2O3,MgO,FeO,MnO,P2O5,etc[8-10].Different component concentrations have different effects on the slag.Real-time analysis of slag components during industrial smelting processes can improve the control of subsequent process flows [11,12].
Traditional quantitative analysis methods,such as chemical analysis [13],direct reading spectroscopy [14],and X-ray fluorescence spectroscopy (XRF) [15],are known for their high accuracy in component detection.However,their complex pre-processing procedures and long analysis time render them unsuitable for real-time online analysis.In contrast,laser-induced breakdown spectroscopy (LIBS)offers the benefits of not requiring sample preparation,fast analysis times,and online detection [16,17].Thus,LIBS is a promising technique for online analysis and detection of high-temperature liquid substances.Nollet alstudied the effects of laser radiation illuminance,propagation direction,and wavelength on the stability of LIBS detection [18].Hussainet alinvestigated the use of LIBS for rapid material analysis,analyzed elements such as Ca,Mg,and Fe in iron ore slag,and compared the results to those obtained using inductively coupled plasma (ICP) spectroscopy.The results were consistent,and the detection time was significantly reduced [19].Palagaset alstudied the parameters that impact slag analysis,including laser pulse energy,accumulated laser pulses,laser beam focusing conditions,and detector pass conditions [20].Sturmet alemployed a LIBS system to perform online analysis of solid-liquid mixed slag in a steel-making plant with a surface temperature range of(600-1400) °C.The analyzed components included FeO,SiO2,CaO,MgO,Al2O3,and MnO.The analysis took only two minutes,and the root mean square errors (RMSE) of Fe,Si,Ca,Mg,Al,and Mn in the liquid slag were 2.1%,1.4%,1.68%,0.66%,0.35%,and 0.39%,respectively [21].Maet alused slag as the experimental material and studied the effects of temperature on the plasma signal intensity,stability,and acquisition delay time in the temperature range of (50-1200) °C.The spectral intensity of the sample heated at 1000 °C is significantly higher than that of the sample heated at 200 °C [22].
However,the temperature of slag in steel-making plants can reach 1400 °C or higher under actual field conditions,and the effect of temperature fluctuations at approximately 1400 °C on the LIBS signals has not yet been reported.In response to the need for online analysis of refined slag,experiments were conducted at three different temperatures(1350 °C,1400 °C,and 1450 °C) on slags with different component concentrations to investigate the effects of the component and temperature on spectral intensity and stability.Based on these findings,the sources of measurement error in the liquid slag were analyzed,laying the foundation for the subsequent detection of the components in the liquid slag.
2.Experiment
2.1.Measurement setup and parameters
The LIBS liquid slag experimental device employed the SIALIBS analyzers developed by the Shenyang Institute of Automation Chinese Academy of Sciences.The principal diagram and photographs are shown in figure 1.The plasma excitation light source was a Nd: YAG (Neodymium-doped Yttrium Aluminium Garnet) pulse laser with an output wavelength of 1064 nm for each laser.After optimizing the experimental parameters,the pulse energy used was 100 mJ,with a pulse frequency of 5 Hz,and a spectral detection delay time of 1μs.The laser was passed through a focusing lens with a focal length of 547 mm and collected on the surface of the sample to form plasma.The wavelength range of the spectrometer was 243-361 nm with a resolution of approximately 0.1 nm.The heating device of this experiment was box type electric furnace,the heating element was silicon molybdenum rod and the temperature was adjusted from room temperature to 1500 °C.
2.2.Slag samples and data collection
Figure 1.Schematic diagram (a) and photograph (b) of LIBS setup for liquid slag measurement.
Table 1.Summary of dataset.
The slag samples used in the experiment were provided by a steel plant,and included 42 refined slags.Table 1 lists the mass fraction ranges of each component,and the label data was obtained through X-ray fluorescence analysis.During the sample preparation process,the block slag samples were crushed and ground into a fine powder.Subsequently,the sample powder was sieved using a screen with a pore size of 0.28 mm.The sieved powder was then transferred into a crucible and subjected to heating in a drying oven at 105 °C for approximately 40 min.The dried sample was then placed in a furnace,its position was adjusted,and the furnace lid was closed to begin the heating.To investigate the effects of different temperatures on the viscosity,spectral intensity,and spectral stability of the liquid slag,slag samples were heated in stages.The experimental temperature was conducted at 1350 °C,1400 °C,and 1450 °C.To ensure that the spectral quality is not affected by the deep ablation pits formed due to prolonged laser irradiation at the same location,five different positions on the sample surface were selected during the acquisition of spectral data.Each position was subjected to 400 consecutive laser shots,resulting in a total of 2000 spectra for subsequent data analysis.
3.Result and discussion
3.1.Effect of temperature on the viscosity of liquid slag
In addition to its composition,the viscosity and temperature changes of slags are the main factors that cause inconsistencies in its spectrum.To detect the viscosity status of slag samples at different temperatures,this experiment used a quartz rod with calibrated scales,which was in contact with the surface of the steel slag sample through a fine rope.The experiment was repeated several times,and the depth and speed of the quartz rod sinking were recorded during each trial.If the viscosity of the sample is low,the quartz rod will sink deeper and its sinking speed will be faster over the same period of time.Conversely,if the viscosity of the sample is high,the sinking depth of the quartz rod will be shallower and the sinking speed will be slower over the same period of time.The viscosity of the slag is divided into three states in this experiment.The first state is a high-viscosity “asphaltlike” state,in which the quartz rod basically does not sink when in contact with the sample.The second state is a medium-viscosity “paste-like” state,in which the quartz rod sinks slowly when in contact with the sample.The third state is a low-viscosity “water-like” state,in which the quartz rod sinks quickly when in contact with the sample.Additionally,to investigate the impact of viscosity on the quantitative analysis,this experiment recorded the sample states at three temperatures (1350 °C,1400 °C,and 1450 °C) for 42 slag samples [23,24].Figure 2 shows that at 1350 °C,88.10% of the samples were “asphalt-like”,14% were “paste-like”,and 4.76% were “water-like”,resulting in a generally high viscosity for the samples at this temperature.At 1400 °C,38.10% of the samples were “asphalt-like”,42.86% were“paste-like”,and 19.04% were “water-like”,resulting in a large variation in viscosity among the samples,which may affect the precision of the quantitative analysis.At 1450 °C,83.33% of the samples were “water-like”,14.29% were“paste-like”,and 2.38% were “asphalt-like”,resulting in a generally low viscosity and better fluidity for the slag samples at this temperature.To study the relationship between temperature and slag viscosity,four slag samples with varying component contents were selected from the 42 samples for experimental analysis,as shown in table 2.
Figure 2.Percentage of slag state at 1350 °C,1400 °C and 1450 °C.
The experiment revealed that sample A was in a highviscosity “asphalt-like” state at 1350 °C and 1400 °C,and the viscosity decreased to “water-like” when the temperature increased to 1450 °C.Sample B was in a high-viscosity“asphalt-like” state at 1350 °C,and the viscosity decreased to “paste-like” state when the temperature increased to 1400 °C and further decreased to “water-like” when the temperature increased to 1450 °C.Sample C was in a medium-viscosity “paste-like” state at 1350 °C,and had relatively low viscosity,approaching “water-like”,at 1400 °C and 1450 °C.Sample D was in a high-viscosity “asphalt-like”state at 1350 °C,and was close to “water-like” at 1400 °C and 1450 °C.
According to table 2,the Fe contents in slag samples A and B are relatively low,whereas those in slag samples C and D are relatively high.The free O2-ions in FeO can break down the silicate network structure SiO4-,lowering the viscosity of the slag.In contrast,SiO2can form more complex structures with the silicate network structure SiO4-,increasing the viscosity of the slag [25,26],Furthermore,as the Fe content in the slag increases,the viscosity of the slag decreases more rapidly with increasing temperature.Theseexperimental results indicate that temperature and composition are the primary factors influencing the viscosity of the slag,with the Fe content having a particularly significant impact.
Table 2.Chemical composition concentration of slag samples.
3.2.Effect of temperature on the spectrum
To reduce large fluctuations in the slag spectrum,certain spectra with extreme intensity values were removed during preprocessing.This was done by using the peak intensity at Ca II 317.91 nm as a reference and removing spectra with intensities greater than 16000 or less than 100.Figure 3 shows the combination plots of the peak intensity at Ca II 317.91 nm for the four slag samples under different temperature conditions.Thex-axis represents the temperature and they-axis represents the spectral intensity.Each combination plot was composed of a box plot,histogram,and standard normal curve,representing the combination plots under three different temperature conditions from left to right: 1350 °C,1400 °C and 1450 °C.The yellow dashed line inside the box plot represents the median intensity,and the yellow pentagon represents the mean intensity.
Figure 3 and table 3 show that the spectral intensities of slag samples C and D were significantly higher than those of samples A and B,and there were fewer outlier values above the box plots.The spectral stability of samples C and D was also better than that of samples A and B,particularly evident during the low-temperature phase.The effects of the temperature on the four slag samples were also different.For samples A and B,the intensity increased significantly when the temperature reached 1450 °C,and the number of abnormal points decreased compared to those at 1350 °C and 1400 °C,leading to improved stability.The effect of temperature on slag sample C was insignificant,whereas for slag sample D,the spectral line intensity increased significantly at 1400 °C,and the RSD value decreased significantly.Above 1400 °C,the change was relatively smooth.
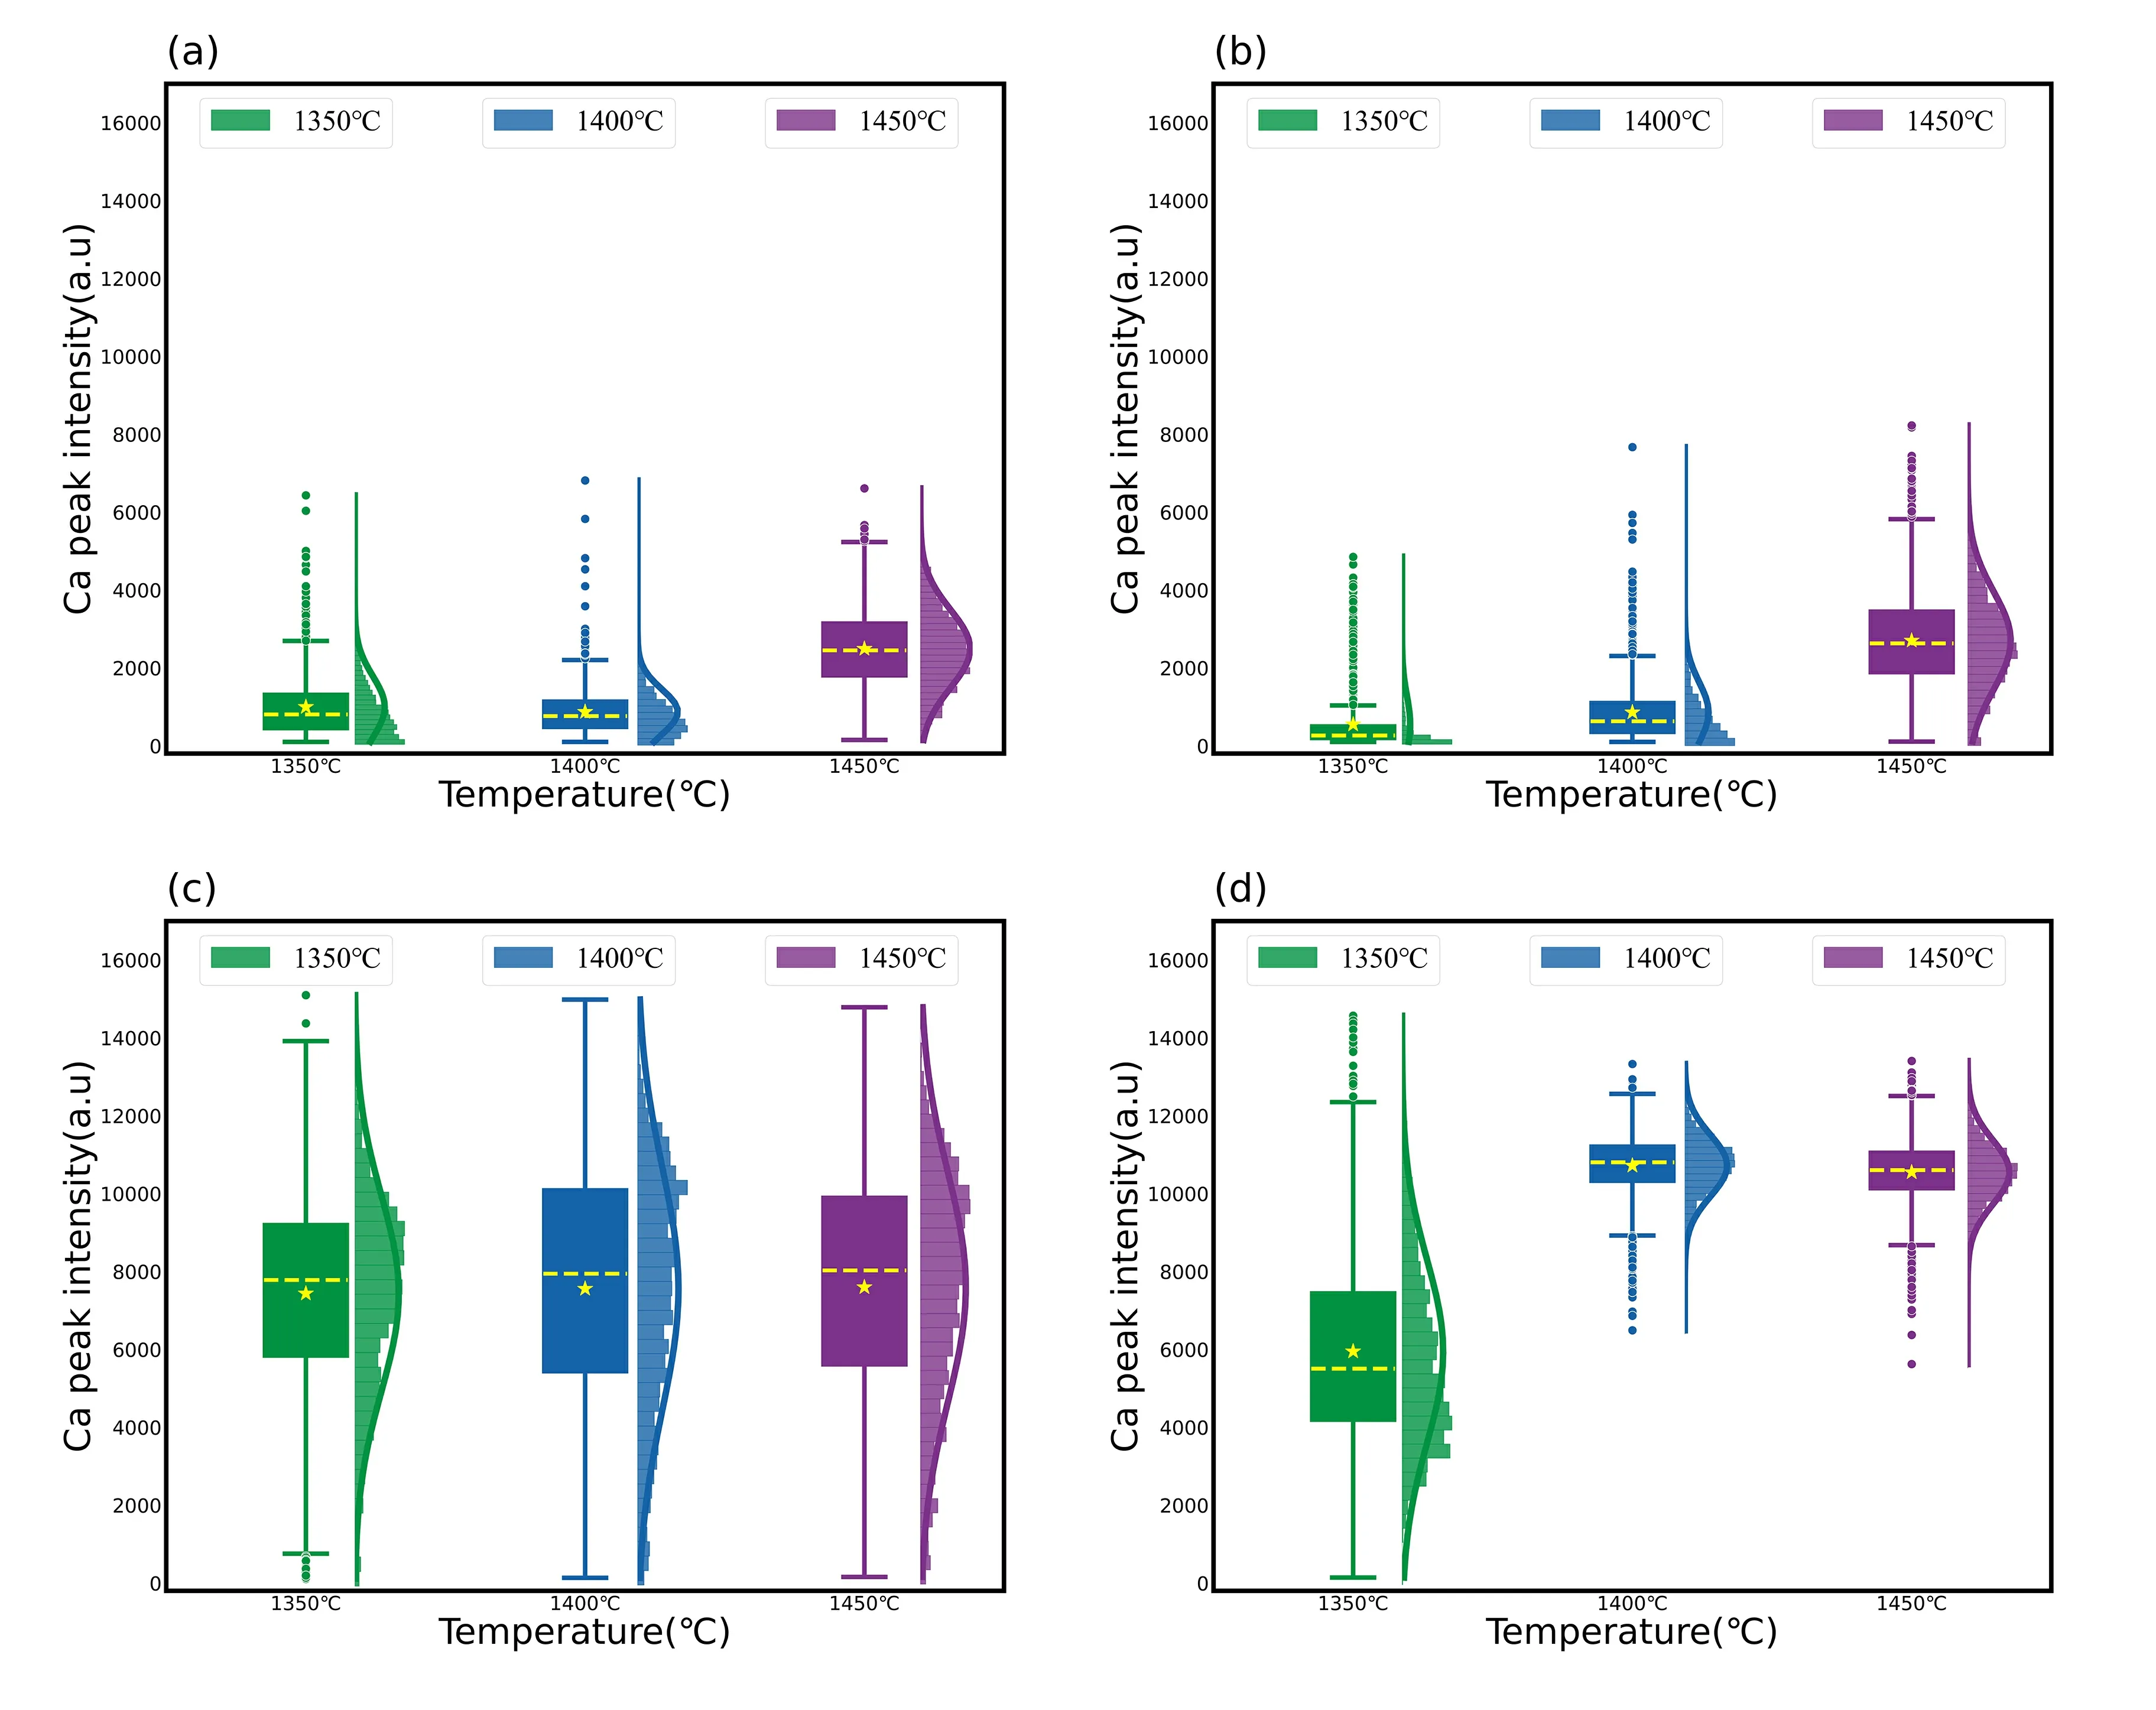
Figure 3.Ca II peak intensity at 317.91 nm for the four slag samples of (a) A #,(b) B #,(c) C #,(d) D #.
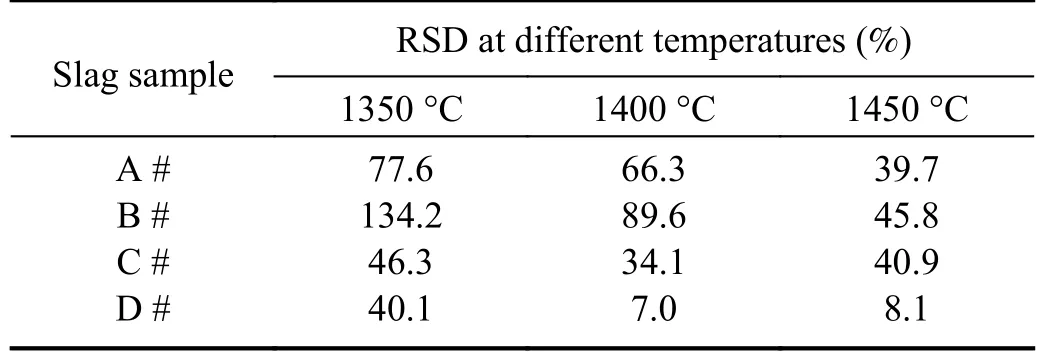
Table 3.RSD of Ca II peak intensity at 317.91 nm for different slag samples (%).
By analyzing the relationship between temperature and viscosity of liquid slag in section 3.1,in conjunction with data presented in figure 3,we can observe a strong correlation between the spectral intensity of liquid slag and its viscosity.When the slag is in a “paste-like” or “watery-like”state with a low viscosity,the spectral intensity is stronger and more stable.In contrast,when the slag is in an “asphaltlike” state with a higher viscosity,the spectral intensity is weaker,and there are many outlier points in the box plot.Furthermore,during the experiment,it was observed that when the slag was in an “asphalt-like” state,the spectral line was initially strong but gradually weakened each time the sample moved.This was likely owing to the high viscosity of the slag,which caused the laser to quickly generate unhealable “pits” on the surface of the slag,resulting in large spectral fluctuations and a decrease in intensity.In contrast,when the slag is in a “paste-like” or “water-like” state with low viscosity,the “pits” heal quickly,resulting in more stable spectra.Because spectral intensity of “asphalt-like”slag is only strong initially after it is moved,these points are considered outliers when creating the box plot.
Internal standard methods are often used to reduce the impact of conditional fluctuations during quantitative analysis.To investigate whether the effect of the temperature can be compensated for using this method,we used the spectral line intensity of Ca II at 317.91 nm as an internal standard and investigated the trend of the spectral line intensity ratio.Figure 4 shows the combination plot of the ratio of the Fe and Ca spectral line intensities for the different slag samples.Thex-axis is the same as that in figure 3,and they-axis represents the ratio of the Fe II 259.90 nm and Ca II 317.91 nm spectral peak intensities.The corresponding RSD values are presented in table 4.
It can be seen from table 4 that when using the internal standard normalization method,the RSD of the four slag samples was significantly reduced.As shown in figure 4,the data of slags samples A and B are more concentrated at the mean,and more obedient to a normal distribution at 1350 °C and 1400 °C.Compared to the results without pretreatment,the RSD was reduced by more than 50%.At a temperature of 1450 °C,the RSD was also decreasing from above 40% to 10%-20%.At the same time,the RSD of slag sample C was decreased from above 30% to within 10% at 1350 °C,1400 °C and 1450 °C.For slag sample D,a change in the RSD can also be observed in the asphalt state at 1350 °C,and it is more likely to follow a normal distribution.Furthermore,the RSD was reduced to less than 4% at 1400 °C and above.
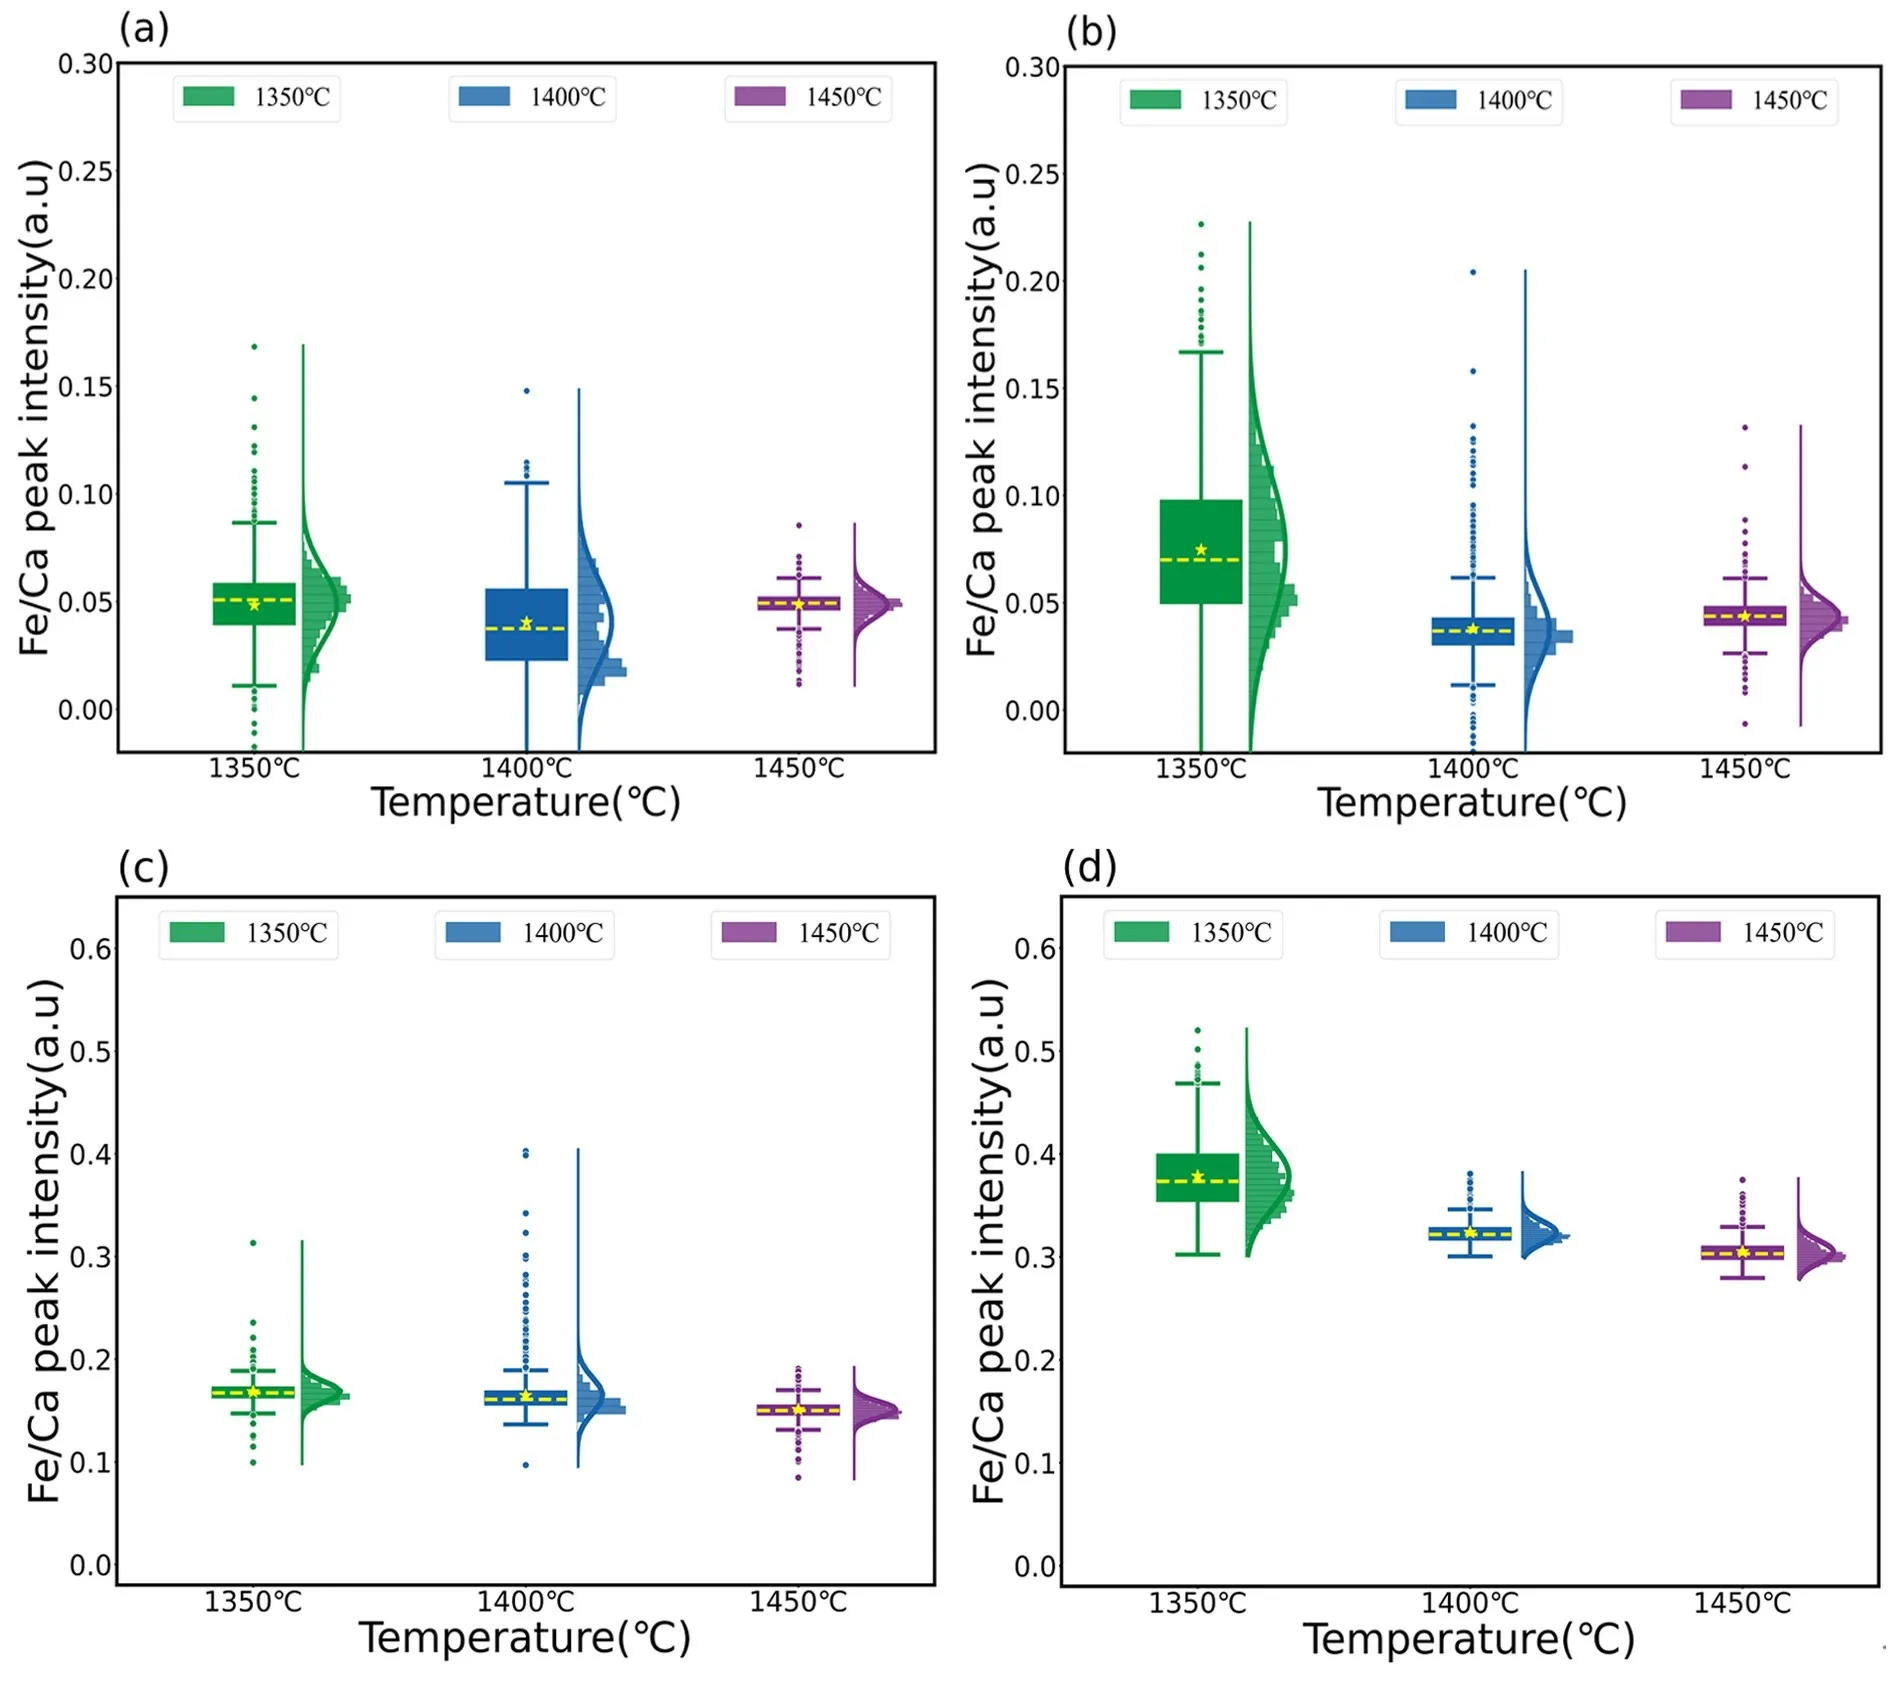
Figure 4.Peak intensity ratio of Fe II 259.90 nm to Ca II 317.9 nm in different slag samples.
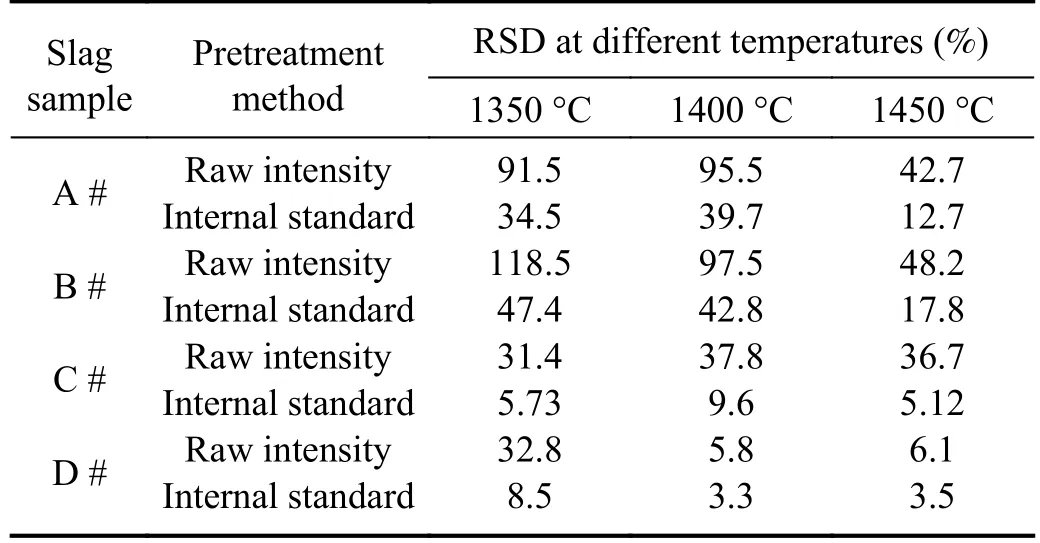
Table 4.Variation of the RSD of Fe II 259.90 nm peak intensity normalized by internal standard of Ca II 317.91 nm in different slag samples before and after normalization.
The above results show that internal normalization can effectively reduce the impact of spectral fluctuations,particularly when viscosity is low.This method can also compensate for temperature fluctuations.However,when the viscosity was high,although the RSD value decreased significantly,it remained high and could not mitigate the effects of the temperature fluctuations.The key factor influencing viscosity is the Fe content.When the Fe content was relatively high,the flow ability of the liquid slag improved,and internal normalization effectively reduced the effect of temperature on the analysis results.
3.3.Quantitative analysis of slag composition
To investigate the effects of viscosity and temperature on the quantitative analysis of liquid slag,42 slag samples were used at temperatures of 1350 °C,1400 °C and 1450 °C,and 2000 spectra were collected for each sample.The upper and lower limits of the box plot of the Ca II 317.91 nm peak intensity were used as boundary lines,and the spectra between the upper and lower limits were selected for mean normalization.The spectral data were obtained for subsequent analyses by averaging the spectra of each sample.To minimize the effect of experimental condition fluctuations on data stability,we employed internal normalization to normalize the spectra using the Ca II 317.91 nm peak intensity as the internal standard.Of the 42 slag samples,34 were selected as the training set,and the remaining eight were used as the test set.To ensure that the training and test sets were representative,we divided them into different concentration intervals,and randomly selected one or more samples from each interval to ensure that the labels of the test set samples were evenly distributed.Because the partial least squares (PLS) algorithm is effective for handling issues of small sample size,high-dimensional variables,and multicollinearity among variables [27-29],this experiment used Ca internal normalization in combination with the PLS method to quantitatively analyze the TFe,SiO2,CaO,MgO,Al2O3,and MnO components in molten slag at three temperature levels of 1350 °C,1400 °C and 1450 °C.
To determine the optimal number of latent variables in the model,we preprocessed the 34×2048 spectral data obtained through Ca internal normalization and used it as the input for the PLS model,with the corresponding mass fractions of the sample elements as the output.The number of latent variables was evaluated by calculating the minimum root mean square error (RMSE) of leave-one-out cross-validation for each element.
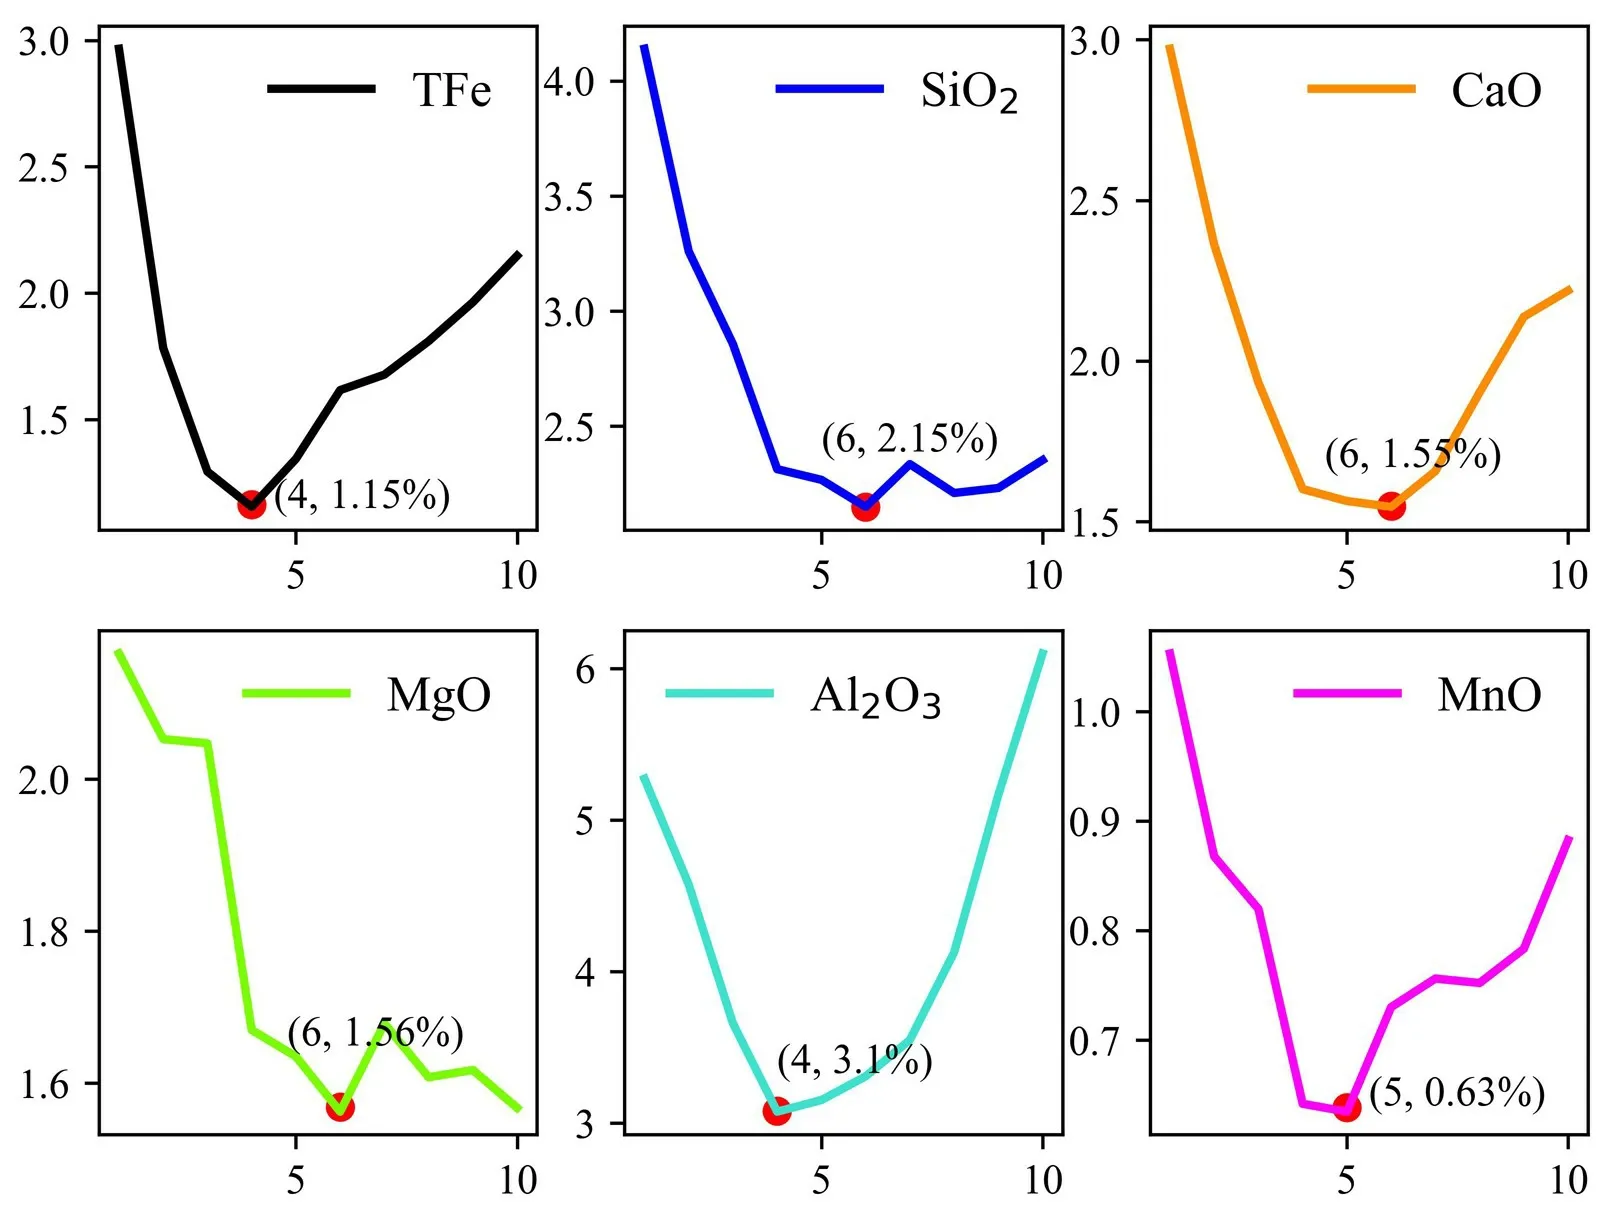
Figure 5.Relationship between the RMSE of leave-one-out cross-validation and the number of latent variables for each element of the PLS model (1450 °C).
As shown in figure 5,when the number of latent variables for Fe,Si,Ca,Mg,Al,and Mn in the slag at 1450 °C was 4,6,6,6,4,and 5,respectively,the corresponding RMSE was minimized.To investigate the comparability of the quantitative analysis results at 1350 °C,1400 °C and 1450 °C,we uniformly set the number of latent variables for each element at each temperature,while ensuring that the other experimental parameters and the test set are consistent.Finally,we selected the optimal number of latent variables for each element to establish the PLS calibration model.The quantitative analysis results of slag at three temperature stages are shown in figure 6,the blue pattern represents the training set and the red pattern represents the test set,each element corresponds to different geometric shapes.The evaluation metrics shown in the graph are the total coefficient of determination (R2) for the six major elements of slag in the test and training sets,the mean root mean square error of cross-validation (RMSECV),the mean root mean square error of the training set (RMSETR) and the mean root mean square error of the test set (RMSEP) for overall elements.
According to figure 6,the average RMSEP values for elements in slag at temperatures of 1350 °C,1400 °C and 1450 °C are 2.38,2.54,and 1.54,respectively.It is evident that the overall predictive performance is optimal at a temperature of 1450 °C.Combining this with table 5 and figure 7,it can be seen that for individual element predictions,theR2values are also highest at 1450 °C.This is because the slag exhibits better fluidity at 1450 °C,with over 80% of the slag samples showing lower viscosity “waterlike”.As discussed in section 3.2,experimental observations indicate that slag spectra are stronger and more stable in a low viscosity state,especially when the slag viscosity resembles that of “water-like”,resulting in higher stability.This effect is particularly evident in the measurement of MgO content.At 1350 °C and 1400 °C,the correspondingR2values are only 0.49 and 0.55,whereas at 1450 °C,theR2value increases to a higher value of 0.89.This is mainly attributed to the fact that MgO has the highest melting point among the oxides in the slag,and at 1350 °C and 1400 °C,MgO may not have completely melted,leading to significant spectral fluctuations and affecting the accuracy of quantitative analysis.
Based on the above,it can be concluded that both temperature and viscosity of the slag significantly impact the accuracy of quantitative analysis.Compared to temperatures of 1350 °C and 1400 °C,a temperature of 1450 °C offers greater advantages for precise quantitative analysis of the slag.Furthermore,it is highly advantageous to conduct a quantitative analysis of the slag when it is in a “water-like”state with low viscosity.
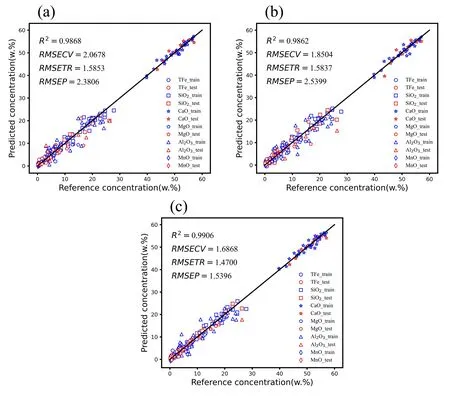
Figure 6.Mass fraction analysis results of slag composition at 1350 °C (a),1400 °C (b),and 1450 °C (c).
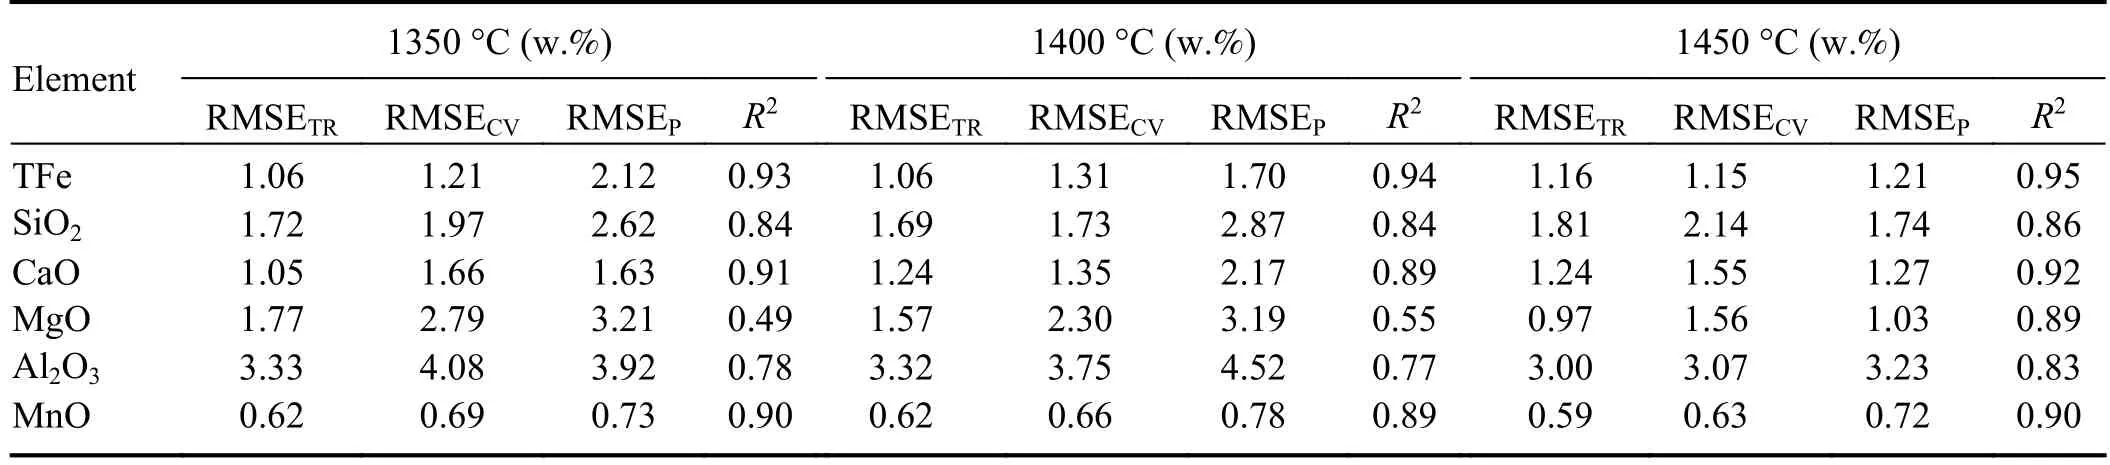
Table 5.Quantitative analysis information of each element at different temperature stages.
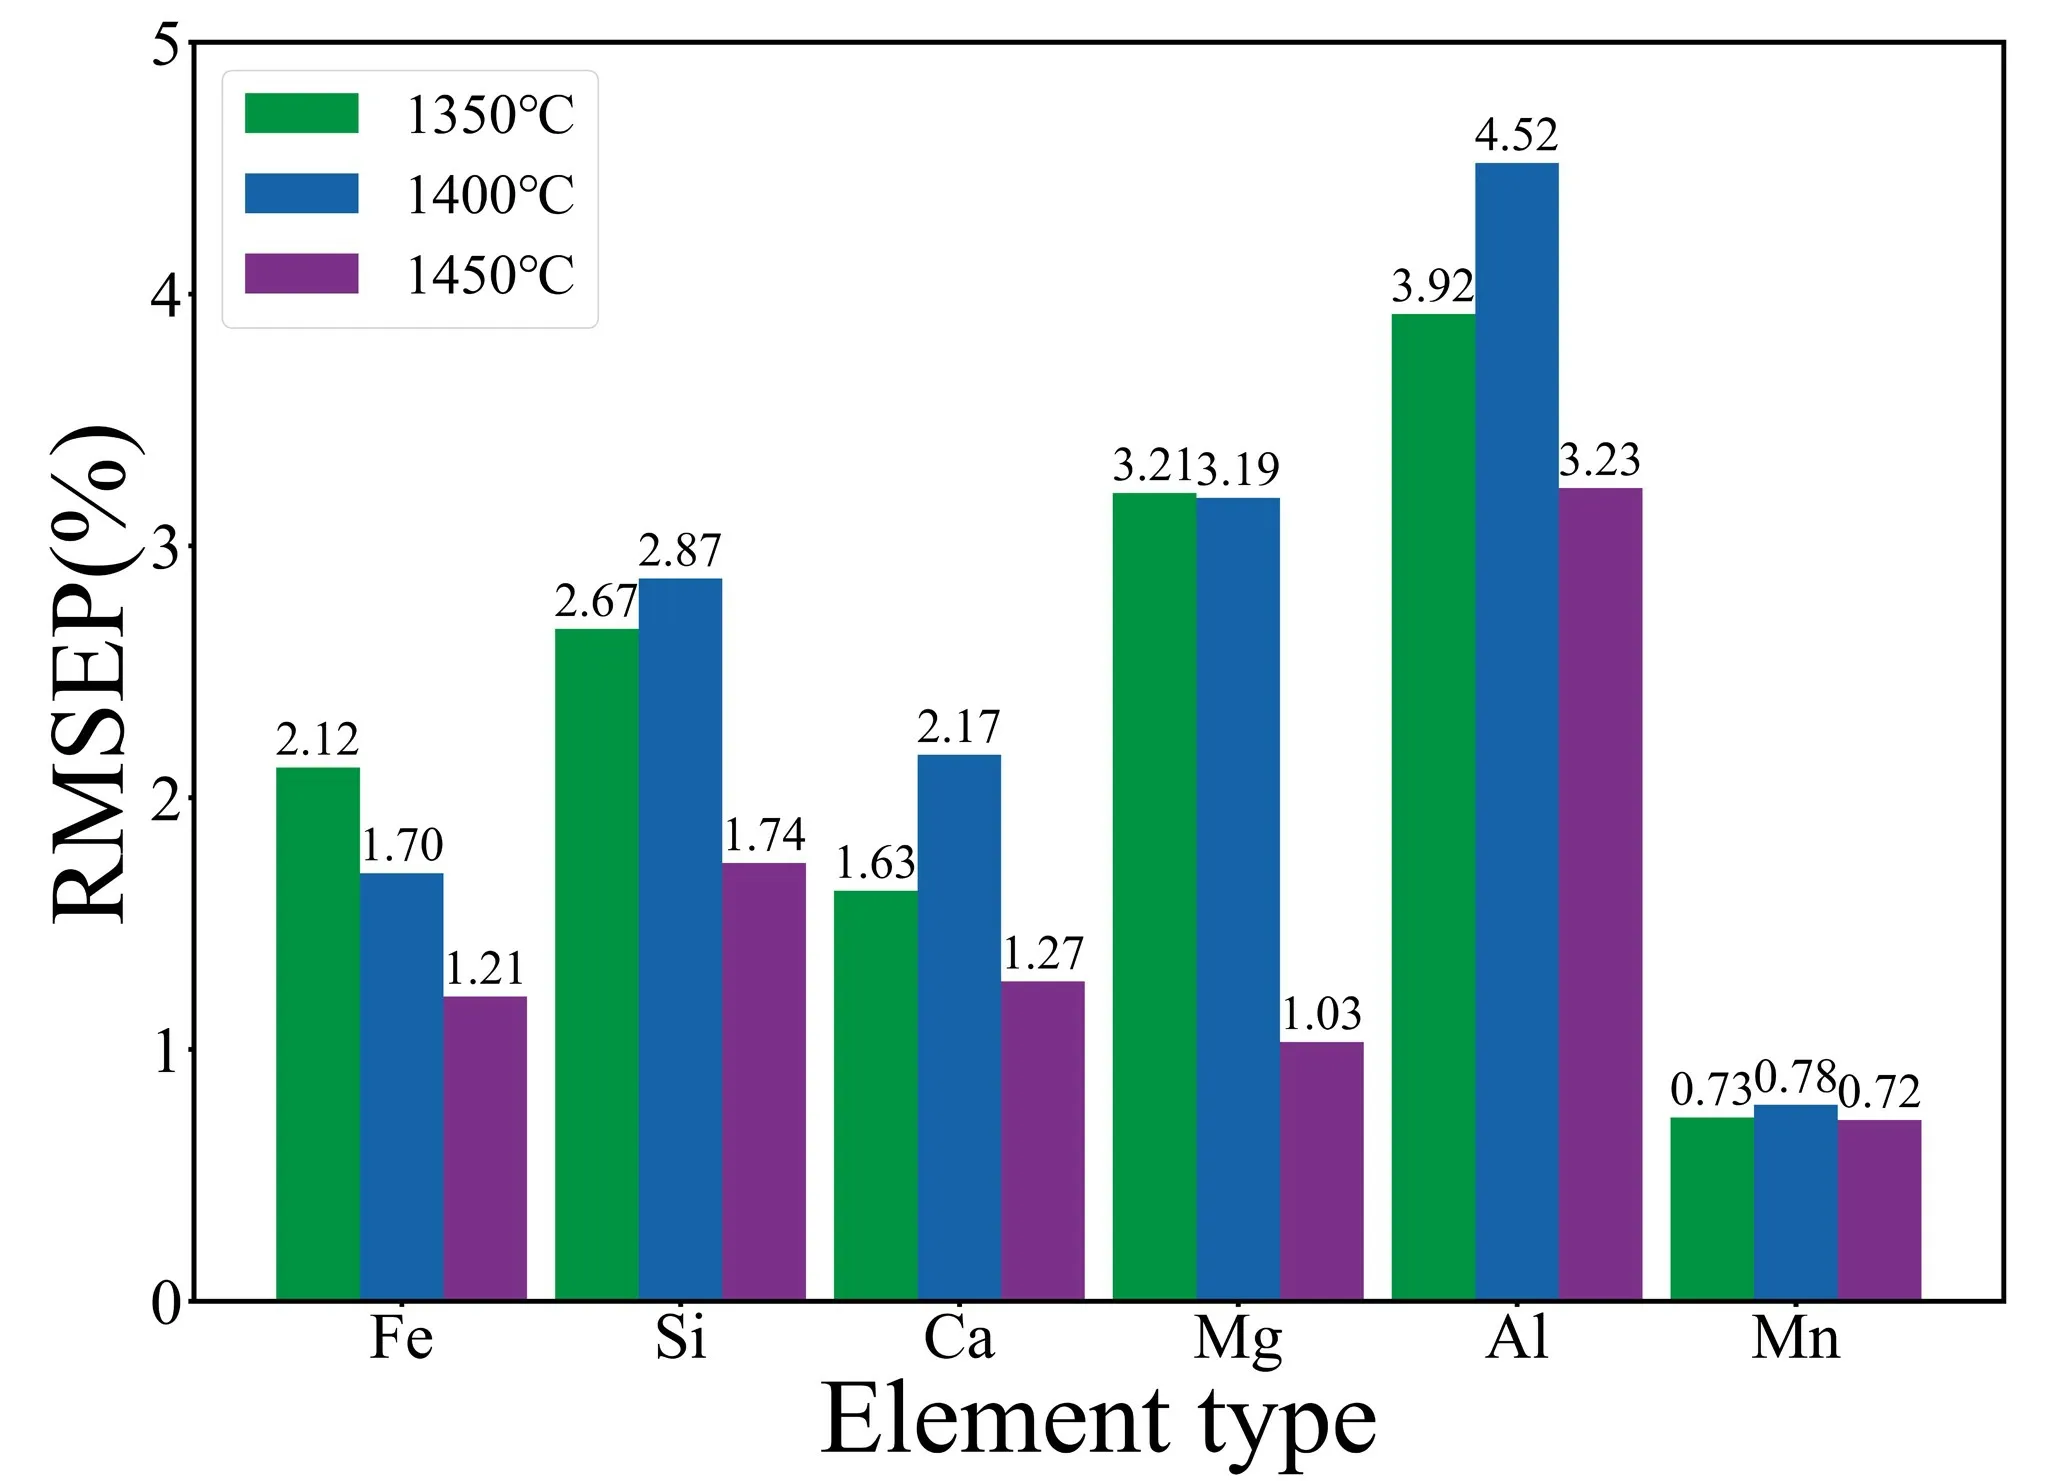
Figure 7.RMESP of six elements at 1350 °C,1400 °C and 1450 °C.
4.Conclusions
In this study,the LIBS technique was used to investigate the effects of slag composition and temperature on spectral intensity and stability.The results indicate that both factors have a significant impact on the spectral properties of slag.The viscosity of the slag exhibits a strong correlation with its Fe content and temperature,particularly when the Fe content and temperature are elevated.This results in a reduction in viscosity,which in turn leads to an improved spectral intensity and stability.These findings indicate that slag with low Fe content has a weaker spectrum and poorer spectral stability,whereas slag with relatively high Fe content has a stronger spectrum and better spectral stability,making it more suitable for quantitative analysis.
In addition,42 slag samples were quantitatively analyzed for TFe,SiO2,CaO,MgO,Al2O3,and MnO at temperatures of 1350 °C,1400 °C and 1450 °C.The mean RMSEP values for the six elements under the three temperature conditions are 2.38,2.54,and 1.54,respectively.The results show that the quantitative analysis of each element in the slag yielded more favorable results at a temperature of 1450 °C when compared to temperatures of 1350 °C and 1400 °C.Furthermore,it is advantageous to conduct a quantitative analysis of the slag when it is in a “water-like” state with low viscosity.
Acknowledgments
This work was financially supported by the National Key R&D Program Projects of China (No.2021YFB3202402)and National Natural Science Foundation of China (No.62173321).
猜你喜歡
Chinese Physics B(2023年12期)2023-12-15 11:48:02
揚子江(2023年5期)2023-09-11 12:34:39
婦女生活(2022年12期)2023-01-20 03:12:29
大觀(2022年12期)2022-02-23 00:44:30
中華詩詞(2021年1期)2021-12-31 07:51:46
魅力中國(2018年51期)2018-04-08 09:09:34
三聯(lián)生活周刊(2017年7期)2017-04-11 12:00:34
三月三(2015年8期)2015-08-12 16:49:35
作文大王·低年級(2015年10期)2015-05-30 20:08:10
百姓生活(2012年2期)2012-04-29 00:44:03
 Plasma Science and Technology2024年2期
- Plasma Science and Technology的其它文章
- Detection of Al,Mg,Ca,and Zn in copper slag by LIBS combined with calibration curve and PLSR methods
- Experimental study on the effect of H2O and O2 on the degradation of SF6 by pulsed dielectric barrier discharge
- Phase field model for electric-thermal coupled discharge breakdown of polyimide nanocomposites under high frequency electrical stress
- Non-thermal atmospheric-pressure positive pulsating corona discharge in degradation of textile dye Reactive Blue 19 enhanced by Bi2O3 catalyst
- Airfoil friction drag reduction based on grid-type and super-dense array plasma actuators
- The characteristics of negative corona discharge and radio interference at different altitudes based on coaxial wire-cylinder gap