
使用激波控制鼓包的跨聲速超臨界機翼減阻研究
2012-12-02 01:39:42劉學強AsifSaeed
楊 洋 劉學強 Asif Saeed
(1.西北工業(yè)大學航空學院,西安 ,710072,中國;2.上海飛機設計研究院,上海,200240,中國;3.南京航空航天大學航空宇航學院,南京,210016,中國 )
Nomenclature
CLCoefficient of lift
CDCoefficient of drag
c Chord length
Ma Mach number
CpCoefficient of pressure
Re Reynolds number
NLF Natural laminar flow
T Angle of attack Supercritical(SC)
L/D Lift to drag ratio
CFD Computational fluid dynamics
BWB Blended wing body
INTRODUCTION
Almost all the modern jet transports in operation today operate in the transonic flow regime,rather than supersonic.A major portion of their mission is for the sole purpose of fuel economy.Invariably the transonic flow regime is associated with the formation of shock waves which give a drag rise called ″wave drag″.This wave drag increases with shock strength and the falloutis flow separation.Consequently the performance of the aircraft is reduced significantly.Therefore it is of paramount importance for any designer to reduce this wavedrag and many methodologies havebeen used previously for shock control.A review of previous research in the subject reveals the work of Qin,et al[1]who presented a parametric study of thevarious shock controls using suction,blowing and shock control contour bumps.This study showed that a well design two-dimensional bump for the RAE 5243(NLF)airfoil significantly increased the lift to drag ratio by reducing theshock strength and consequently the wave drag.
K?nig,et al[2]demonstrated the advantages of using th ree-dimensional shock control bump on an unswept transonic wing.Experimental and numerical studies carried out on an array bumps placed spanwise on a modern transonic airfoil.Close agreement was achieved between the wind tunnel test and CFD results which indicated an overall drag reduction of 10%.
Furthermore Ogawa,et al[3]developed threedimensional bumps for a transonic wing for the purpose of drag reduction and buffet delay.By carrying out both experimental and numerical studies at Ma= 1.3 and by using an optimum spanwise distribution of bumps,an overall drag reduction of 30% was achieved.Qin,et al[4]carried out the design and optimization of the two and the three-dimensional shock control bumps for the RAE 5243(NLF)airfoil using a discrete adjoint solver approach.The adjoint solver was a gradient based optimization technique which used a sequential quadratic programming optimizer to find an optimized design point considering sensitivity derivates for a number of design variables.The optimized two-dimensional bumps resulted in a drag reduction of 18.1% while the optimized three-dimensional bump offered a 20.1%drag reduction.However the three-dimensional bumps were found to be very useful over a wide range of off-design operating conditions.
Sommerer,et al[5]carried out the numerical optimization of adaptive transonic airfoils with variable camber. Here the two-dimensional bumps were analyzed on the DAVA2 airfoil using the two-dimensional Navier-Stokes solver MUFLO.This analysis also showed encouraging results and the airfoils lift to drag characteristics were significantly improved with the addition of the shock control bump.Qin,et al[6]continued their work and presented an adjoint-based optimization of a blended wing body shape with shock control bumps.In addition to the general geometric parameters the bump spacing was also optimized using an adjoint solver for three-dimensional bumps spanwiseon a swept back wing.The result was an overall L/D gain of 12%.
Sobieczky,et al[7]developed a theory based on shape modification concept analysis for transonic airfoils.The study boiled down to the design and study of the effects of an expansion shoulder bump for wave drag control.Here a leading edge bump was used to increase the aerodynamic efficiency of a supercritical airfoil and thus widening the region of optimum L/D.
The supercritical airfoil has numerous advantages compared to the conventional airfoil[8]in the transonic flow regime and thus is the preferred choice of designers all over theworld for its application in transonic wings.We present the design and analysis of the two and the three-dimensional shock control bumps for a supercritical airfoil.The design parameters are the various geometric parameters such as bump height,span,crest location,relative crest and bump spacing.The designed three-dimensional bumps are then placed in a spanwisearray over an unswept transonic wing.However this idea is developed with the concept of a variablegeometry wing using smart materials and/or morphing wing technology in which the bumps would simply ″pop-up″during the design Mach number phase of the mission.Therefore the computations are exerted only at a design Mach number and the effect of transition and performance at off-design conditions(Mach numbers and CL)is beyond the scopeof the present paper.
1 SIMULATION
1.1 Flow solver
All simulations are carried out in the FAST solver which was developed in our research group.In FAST,the finite volume method is used for the spatial discretisation,and the Osher scheme is adopted to compute the interface flux.The temporal discretisation is the Runge-Kutta scheme.The turbulence models in FAST are based on Favre averaging the equations governing the flow.Favre averaging introduces additional terms known as Reynolds stresses which aremodeled using the Boussinesq eddy viscosity concept.This eddy viscosity is modeled by the following equation

where q is the velocity scale and l the length scale.The Baldwin Lomax turbulence model[9]is used in all the simulations.This model is an algebraic turbulence model because the velocity and length scales are obtained from algebraic relations.It is also commonly referred to as a mixinglength model because it employs Prandtl′s mixing-length hypothesis in modeling length and velocity scales.The reason for selecting this model is that it is robust and provides quicker solution as compared to one equation or two equation turbulence models.It is to be noted that for the purpose of this study the Baldwin Lomax model has been formally validated by the comparison of computed surface pressure distributions with the classic ONERA M 6 wing experimental results by Schmitt,et al[10].A structured mess is generated around the wing geometry and simulated at conditions identical to those of the wind tunnel test(T=3.06°,Ma=0.84 and Re=1.2× 10⁶).Plotting the pressure coefficients on the upper and lower surfaces of the M 6 wing at six different spanwise stations and comparing them with the experimental data reveals a fairly good agreement in the compared Cpvalues.Fig.1 presents the results of this exercise,where y/b means the span direction of the wing and x/c the position of the airfoil.
1.2 Bump geometry
The manual placement of the bump is by no means a trivial issue,therefore,the shape of the bump is of utmost significance in achieving the desired results.For the two-dimensional bump,four key characteristics,bump height,bump crest(or chordwise location of the bump),bump length and relative crest,are modified.However the bump height and crest play a pivotal role in the design procedure.For the three-dimensional bump,an additional parameter,bump span,is also considered.Fig.2 shows the generalized key geometric parameters of the two-dimensional and the three-dimensional bumps.It is important to note that all of the mentioned geometric parameters above are quantified in terms of the airfoil/wing chord(c).The designed two-dimensional bump geometry is presented in Fig.3.
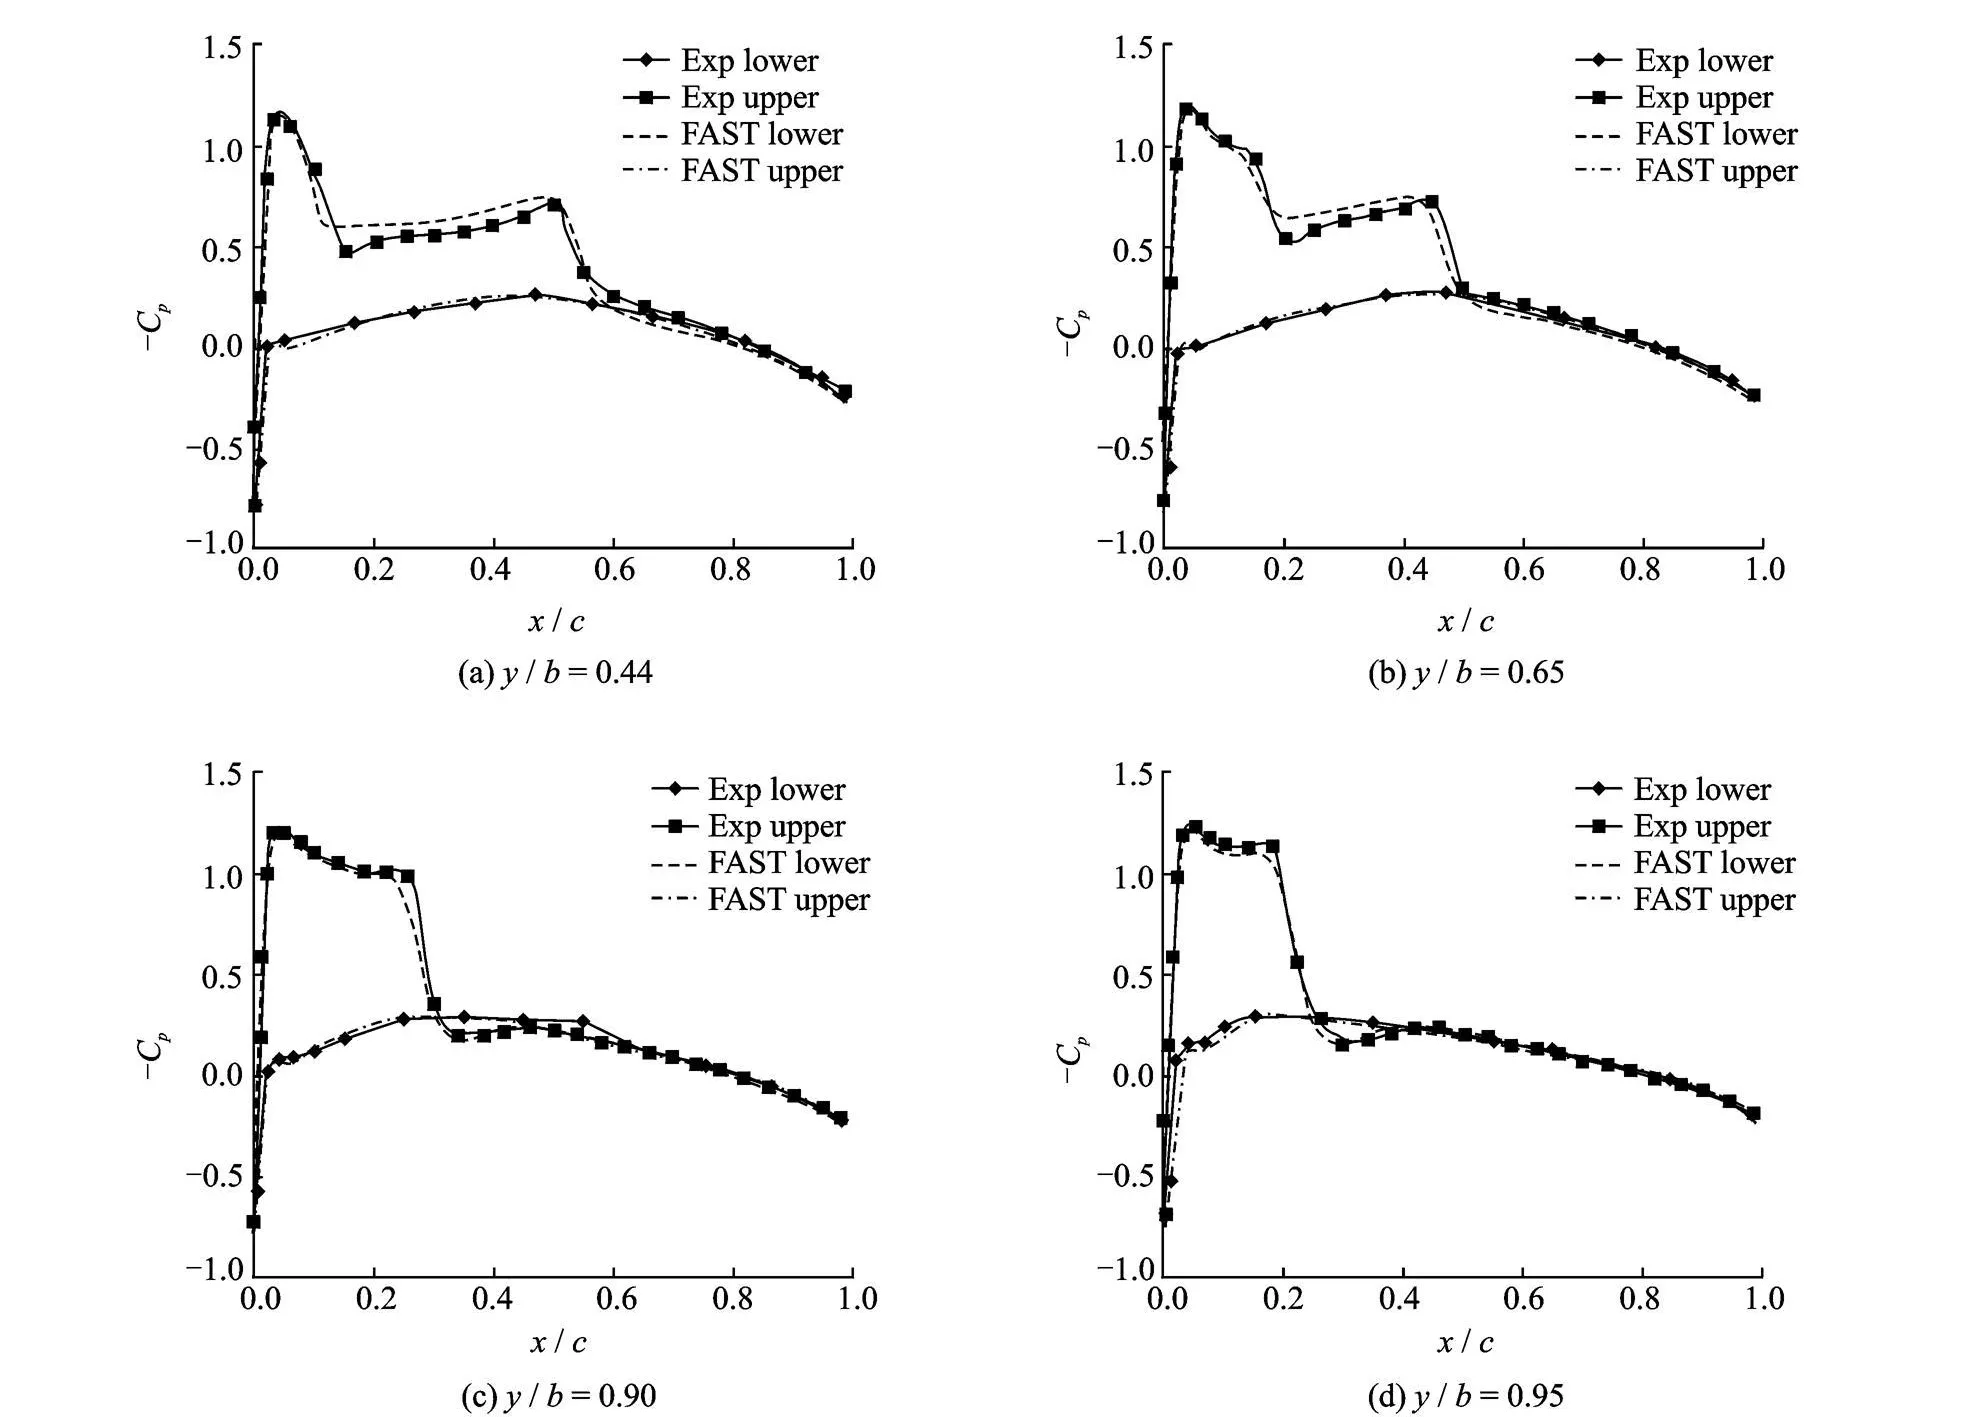
Fig.1 Pressure distribution comparison between experimental and simulated results using Baldwin Lomax turbulence model for ONERA M6 wing
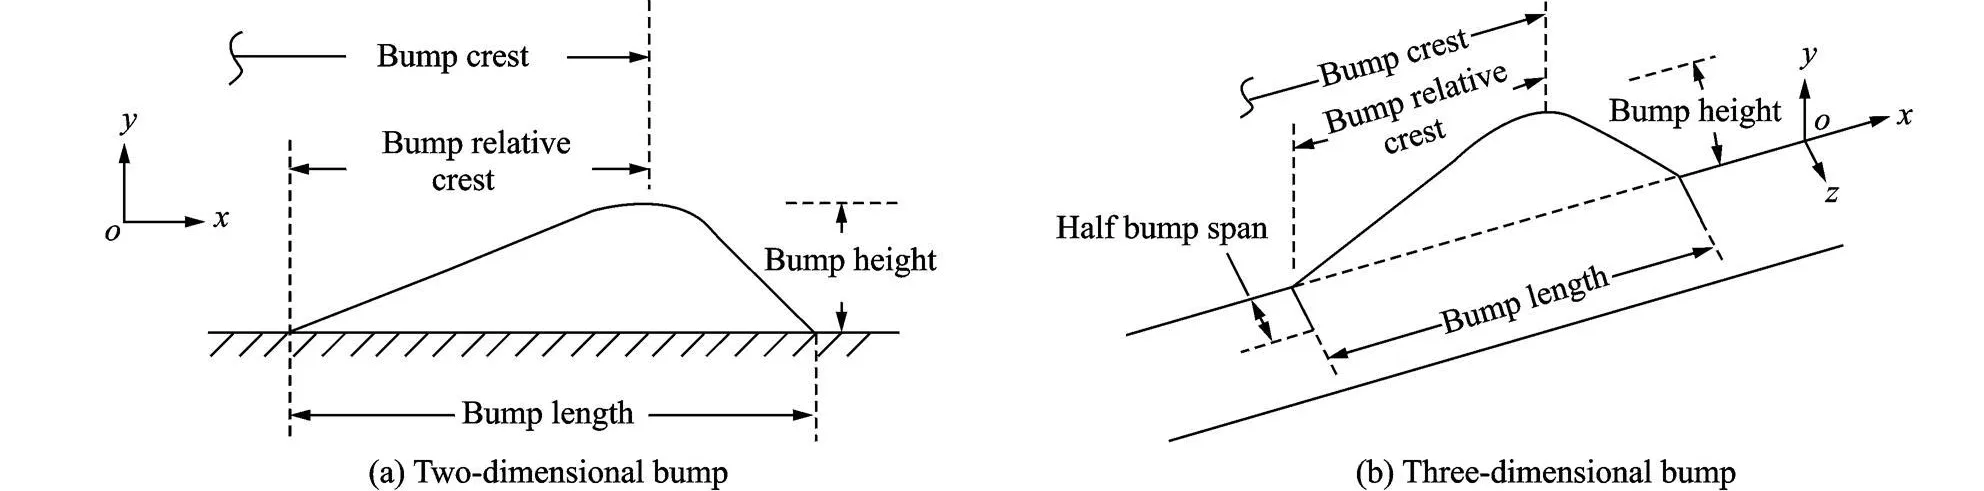
Fig.2 Generalized geometric parameter
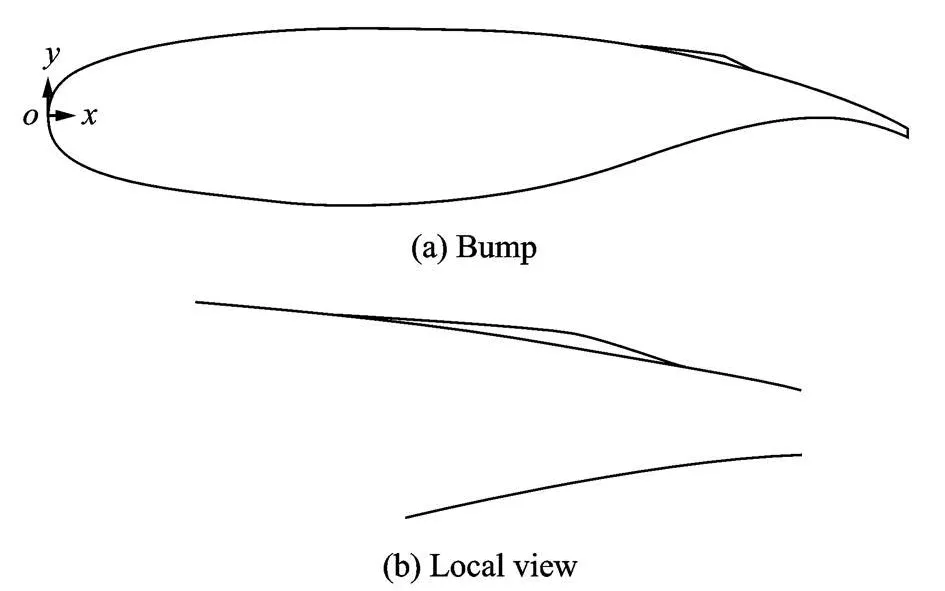
Fig.3 Two-dimensional bump geometry
2 RESULT
This section presents the results of the analysis of the two and the three-dimensional bums on the NASA SC(02)-0714 airfoil which is 14%thick phase two supercritical airfoil.All simulations are carried out at Ma=0.78,Re=1.73×10⁷and T= 0°.It is pertinent to mention here that the phase two supercritical airfoils have an inherent finite trailing edge thickness.This thickness is not only beneficial for structural considerations but also contributes to a significant reduction of wave drag[8].In this study the finite trailing edge thickness is maintained not only for capturing real physics of the problem but also as an aid to structural mess generation.
2.1 Two-dimensional bump
Fig.3 shows the two-dimensional bump geometry on the airfoil upper surface.
The results of the two-dimensional bump analysis are depicted in Fig.4.Fig.4(a)shows the development of a strong normal shock wave on the upper surface of the airfoil while Fig.4(b-c)illustrate the effects of the two-dimensionalbump on the shock structure.The effect of shock dissipation by the development of a ″λ-shock″structure is fairly evident.The series of oblique shocks of theλ-shock incurs the same pressure jump as the original normal shock but with reduced total pressure losses hence a lesser wave drag.This phenomenon is further explained by thecomparison of theupper surfacepressure coefficients in Fig.5.

Fig.4 Result of two-dimensional bump analysis
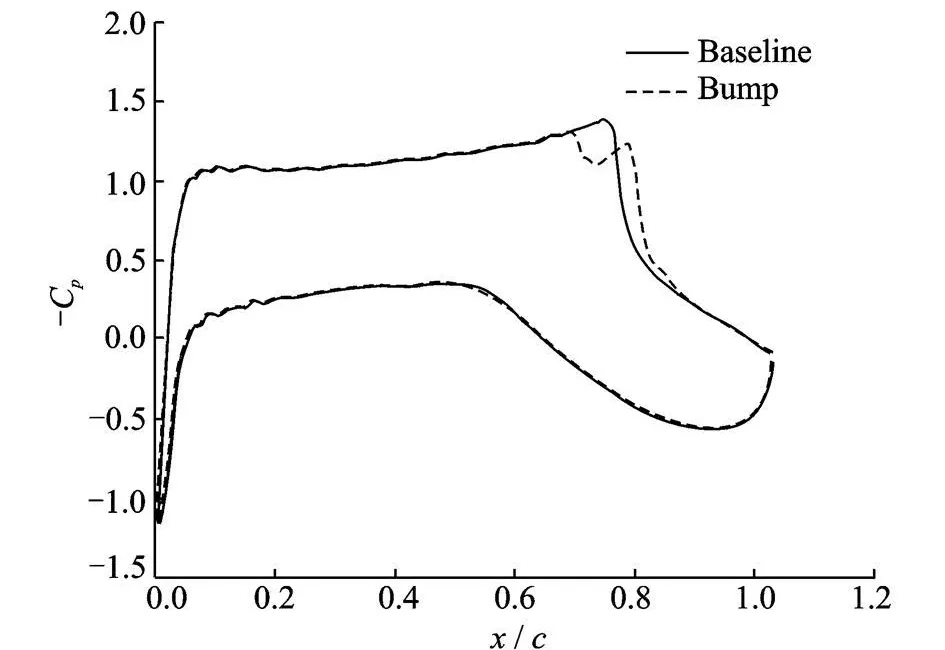
Fig.5 Distribution comparison for two-dimensional bump
The dip and rise of the Cp in the region of the bump is the characteristic of theλ-shock structure,indicating a sudden deceleration followed by a re-acceleration of flow to reach the original minimum pressure of the baseline airfoil.The resulting changes in lift and drag coefficients are presented in Table 1 where two-dimensional bump is listed as 2D Bump.These characteristics are in fact the performance parameters of the bump.
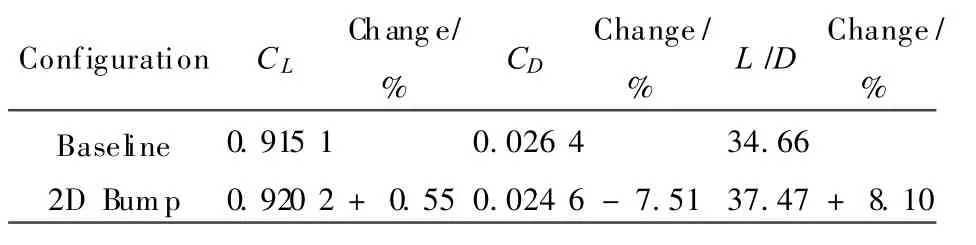
Table 1 Perf ormance parameter for two-dimensional bump
The results presented above are encouraging and validate the effectiveness of the shock control bumps for the supercritical airfoil under study.Furthermore they are a great motivator for the design and analysis of three-dimensional shock control bumps.
2.2 Three-dimensional bump
Fig.6 demonstrates the designed three-dimensional bump geometry.In addition to the key design parameters like those in the two-dimensional case mentioned earlier,an additional parameter of bump span is used for the design of a three-dimensional bump.
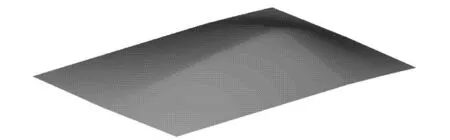
Fig.6 Three-dimensional bump geometry
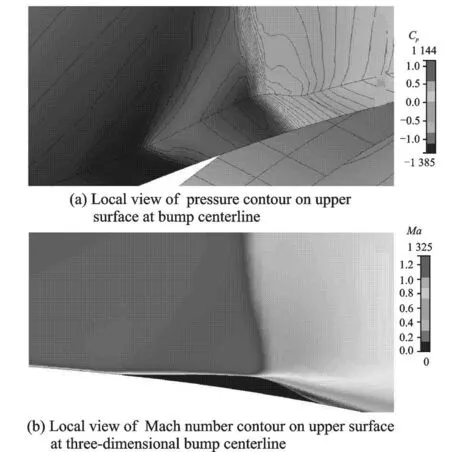
Fig.7 Result of three-dimensional bump analysis
The simulation results are shown in Fig.7.Like the two-dimensional bump,the three-dimensional bump also exhibits aλ-shock structure in the comparison to the normal shock structure on the upper surface of the wing.However,Fig.8 indicates an effect much more pronounced than that of the two-dimensional case at the bump centerline.The resulting surface pressure″bucket″can be accredited to the larger bump height in case of three-dimensional bumps(almost twice than that of two-dimensional bumps).This clear cut advantage of a three-dimensional shock control bump over the two-dimensional one presents itself in theform of better overall performance parameters as tabulated in Table 2,where 3D Bump is the short-term for threedimensional bump.
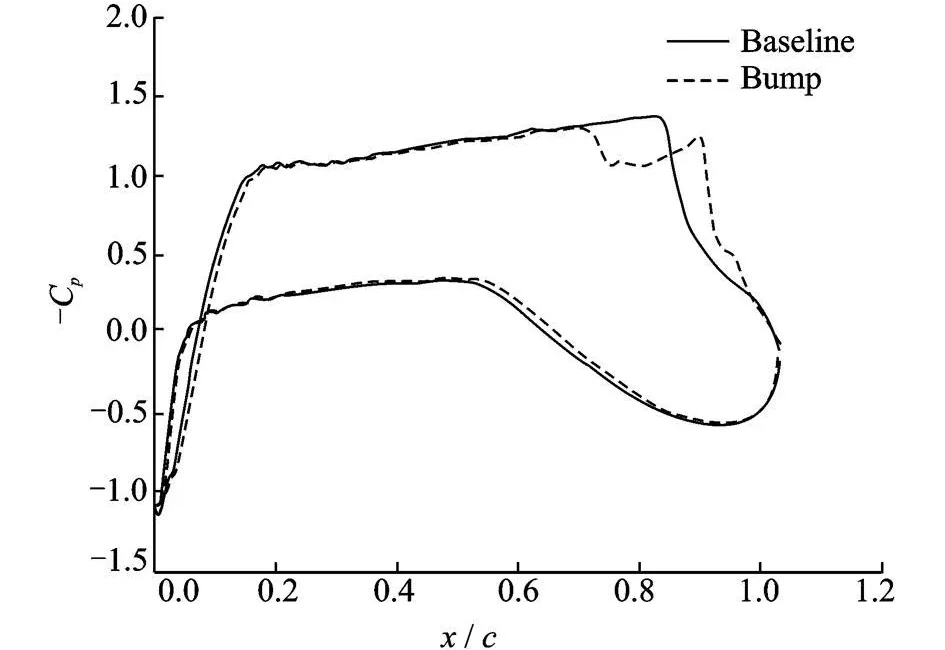
Fig.8 Pressure distribution comparison of baseline wing and three-dimensional bump at bump centerline

Table 2 Performance parameter for three-dimensional bump
2.3 Supercritical wing with three-dimensional bump
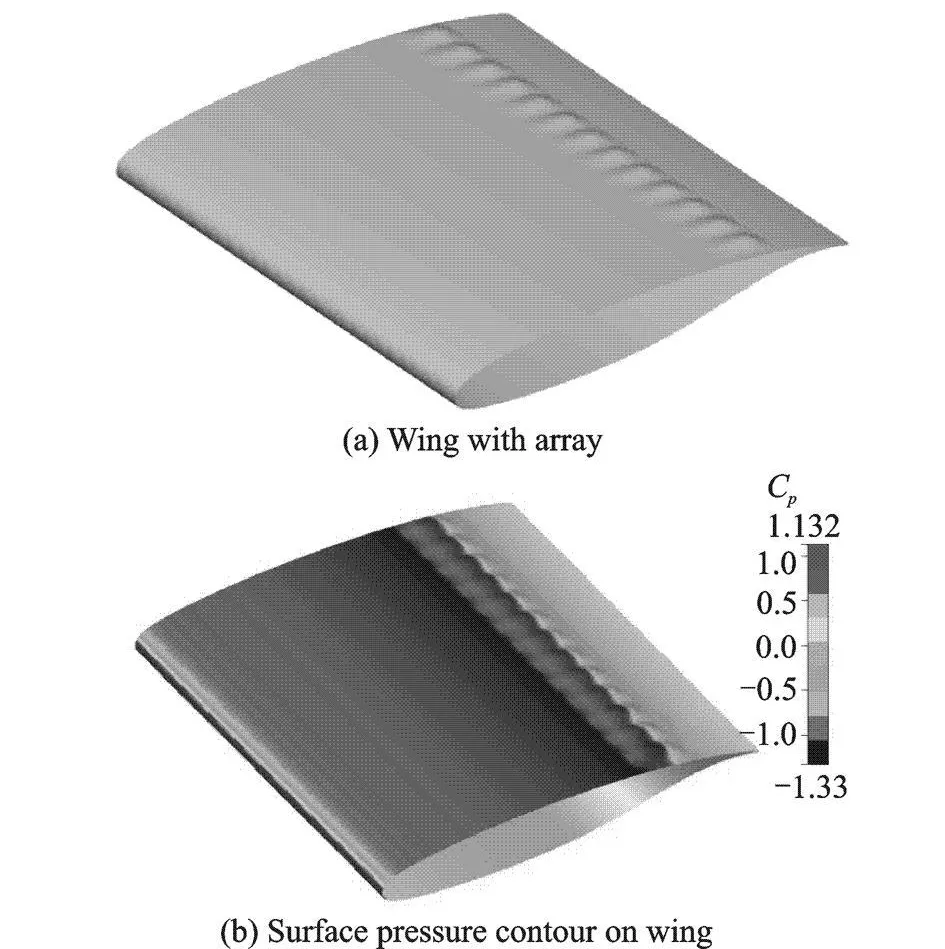
Fig.9 Wing geometry with full-length three-dimensional shock contour bump
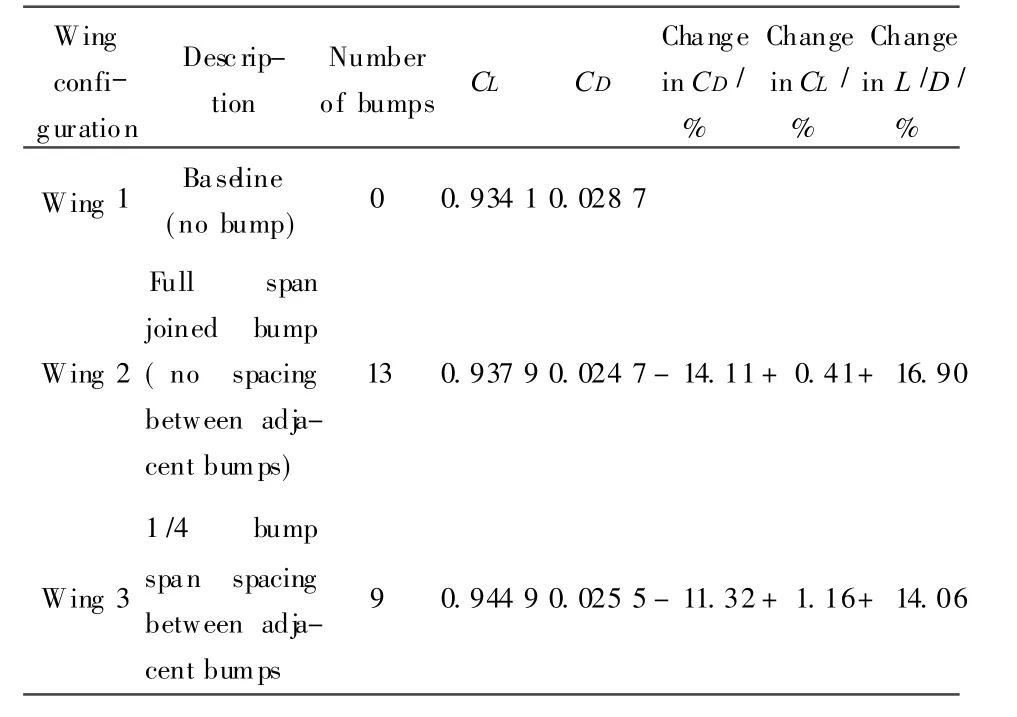
Table 3 Three-dimensional bump spacing arrangement and result
Based on the above results of the standalone three-dimensional bump,a certain confidence is achieved to analyze an unswept wing with NACA SC(02)-0714 airfoil section.The dimensions of the wing are 1 m×1 m and all simulations are carried out at Ma=0.78,Re=1.73×10⁷and T=0°.Fig.9illustrates thewing geometry with a full length array of three dimensional bumps and the surface pressure contours. The only parameter that has still not been determined is the gap or spacing between the three-dimensional bumps,therefore,two arrangements with varying bump spacing are also analyzed.Details of these configurations are provided in Table 3.Optimum performance is achieved by wing 2,providing an overall drag reduction of 14.11%and consequently a lift to drag gain of 16.90%.However,upon closeinspection of the wing 3 results and comparing them with those of wing 2,interesting facts are revealed.Although the drag performance of wing 3 is depleted,there is a significant rise in the lift.This occurrence is explained in Fig.10.The adverse pressure gradient behind the bump crest and the spanwise pressure gradients due to bump spacing create a pair of vortices at the rear surface of the bump which carries on downstream of the bumps. This ″energized flow″ creates boundary layer displacement effects in the spanwise direction and as a result this leads in general to variations of local lift distribution with the consequence of an additional induced drag component,hence the degraded drag performance coupled with a superior lift property.The surface pressure comparison of wing 3 and wing 1 is presented in Fig.11.
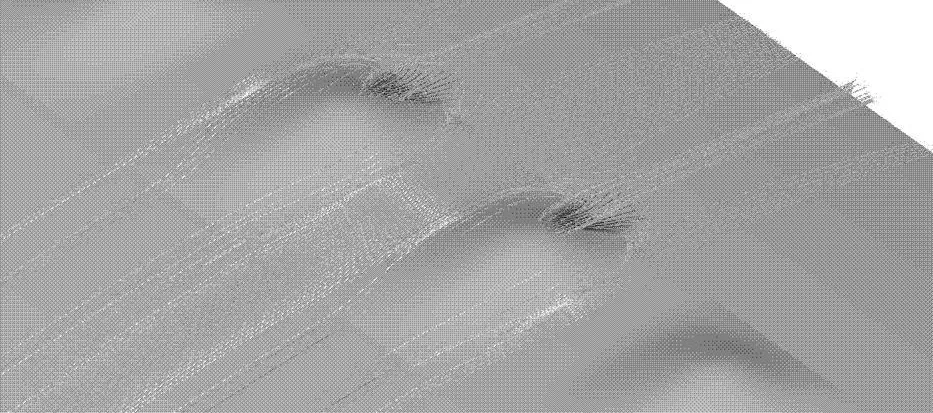
Fig.10 Generation of vortex pair just aft bump of wing 3
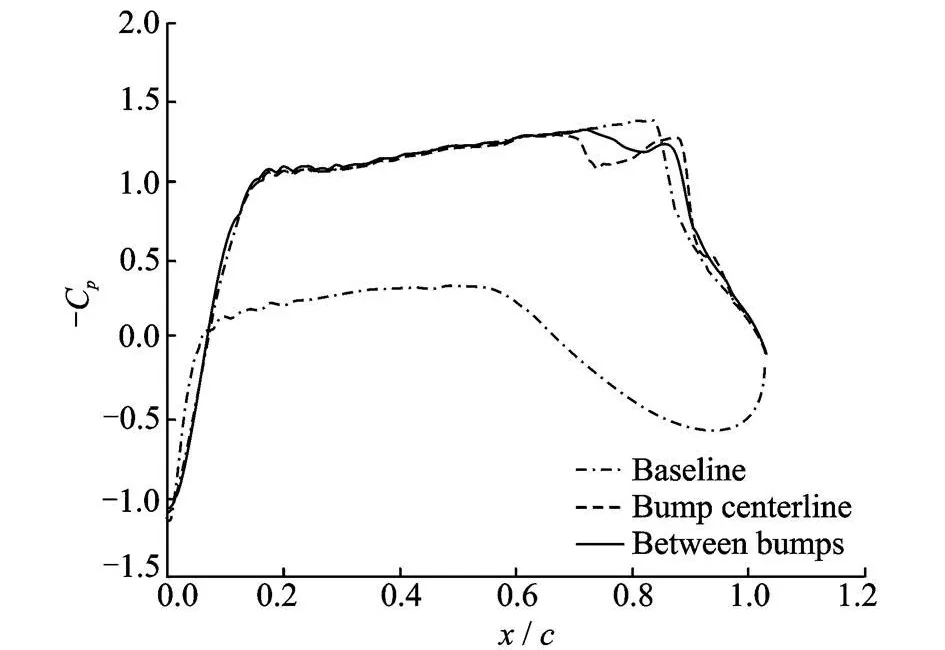
Fig.11 Pressure distribution comparison of wing 3 at bump centerline,between adjacent bumps for wing 3 and wing 1
3 CONCLUSION
Design and analysis of both two-dimensional and three-dimensional shock control bumps for a supercritical airfoil are carried out on the basis of some key geometric parameters for the two-dimensional bump first and then for the three-dimensional bump based on an additional geometric parameter.The results obtained from simulation using FAST solver shows that both the two-dimensional and three-dimensional bumps are successful in wavedrag reduction at the design Mach number,however,the three dimensional bump shows a much better performance.This three-dimensional bump is then simulated as an array on a finite span supercritical wing with two different configurations of bump spacing.The optimum configuration returns encouraging results with an overall drag reduction of 14%simultaneously providing a lift to drag ratio gain of 16%.During the design process it is noted that the two-dimensional is more prone to the double-shock phenomena with an increase in bump height hence degrading the performance.On the other hand the three-dimensional bump exhibits greater robustness to increase resulting in a bump height almost twice that of the two-dimensional bump.
In both the two-dimensional and the threedimensional bumps,the event ofλ-shock structure formation is observed.Theλ-shock structure transforms the original normal shock wave into a series of weaker oblique shock waves rendering the same pressure jump as the original normal shock with reduced total pressure losses.
Further investigation will look to explore the original″pop-up″bump aspect by means of analysis of a large swept back supercritical wing.The design of such a wing could be modeled on the wings planforms of large commercial jet airliners of the modern area.Also the bumps would be subjected to off-design conditions of Mach number and lift coefficients to determine the effects of transition process.A successful design and integration would ensure enhanced performance of the aircraft by means of an increased lift to dray ratio under cruise conditions,and as the cruise constitutes a major portion of the mission,a significant gain in range and endurance performances can be attained.
[1] Qin N,Zhu Y,Ashill P R.CFD study of shock control at cranfield[C]//ICAS 2000 Congress.Harrogate,UK:ICAS,2000:2105.1-2105.10.
[2] K?nig P,Ptzold M,Kr¨amer E.Numerical and experimental validation of three-dimensional shock control bumps[J].Journal of Aircraft,2009,46(2):675-682.
[3] Ogawa H,Babinsky H,Ptzold M,et al.Shockwave/boundary-layer interaction control using threedimensional bumps for transonic wings[J].AIAA Journal,2008,46(6):1442-1452.
[4] Qin N,Wong W S,Le Moigne A.Three-dimensional contour bumps for transonic wing drag reduction[J].Journal of Aerospace Engineering,2008,222(5):619-629.
[5] Sommerer A,Lutz T,Wagner S.Numerical optimization of adaptive transonic airfoils with variable camber[C]//ICAS 2000 Congress.Harrogate,UK:ICAS,2000:2111.1-2111.10.
[6] Qin N,Wong W S,Le Moigne A.Adjoint-based optimization of a BWB shape with shock control bumps[J].Aeronautical Journal,2007,1117(111):165-171.
[7] Sobieczky H,Geissler W,Hannemann M.Expansion shoulder bump for wing section viscous/wave drag reduction[C]//IUTAM Symposium on Mechanics of Passive and Active Flow Control.Gttingen,Germany:Kluwer,1998.
[8] Harris C D.NASAsupercritical airfoils,a matrix of family related airfoils[R].NASA-TP-2969, L-16625,NAS 1.60:2969,1990.
[9] Baldwin B S,Lomax H.Thin layer approximation and algebraic model for separated turbulent flows[C]//16th Aerospace Sciences Meeting and Exhibit.Reno,USA: AIAA,1978:78-257.
[10]Schmitt V,Charpin F.Pressure distributions on the ONERA-M 6-Wing at transonic Mach numbers[R].AGARD AR 138,1979.
猜你喜歡
中國機械工程(2022年21期)2022-11-21 11:57:48
西安航空學院學報(2022年1期)2022-07-06 00:32:40
中國機械工程(2022年7期)2022-04-20 03:24:20
中國機械工程(2021年23期)2021-12-15 13:31:00
西安航空學院學報(2021年3期)2021-10-14 13:06:14
數(shù)據(jù)采集與處理(2021年4期)2021-09-20 10:26:56
西安航空學院學報(2021年1期)2021-07-20 10:36:06
環(huán)境衛(wèi)生工程(2020年3期)2020-07-27 01:19:18
中國特種設備安全(2019年10期)2020-01-04 01:56:04
湖北電力(2016年8期)2016-05-09 09:03:08