
Effect of water-sediment regulation and its impact on coastline and suspended sediment concentration in Yellow River Estuary
2017-02-01 08:49:43HiboYngEnchongLiYongZhoQiuhuLing
Water Science and Engineering 2017年4期
Hi-bo Yng,En-chong Li,Yong Zho*,Qiu-hu Ling
aSchool of Water Conservancy and Environmental Engineering,Zhengzhou University,Zhengzhou 450001,China
bState Key Laboratory of Hydraulic Engineering Simulation and Safety,Tianjin University,Tianjin 300072,China
cState Key Laboratory of Simulation and Regulation of Water Cycle in River Basin,China Institute of Water Resources and Hydropower Research,Beijing 100038,China
dSchool of Civil Engineering and Geosciences,Newcastle University,NE1 7RU,UK
1.Introduction
The Yellow River,well known for having the second largest sediment load river in the world(Milliman and Meade,1983),passes through various regions where climatology,geology,and geomorphology vary spatially.The characteristics of a high concentration of sediment and different sources of water and sediment have caused many difficulties in Yellow River Basin management in terms of water science and engineering(Yu,2002),including for water resources allocation under the ever-increasing pressure of water demand for irrigation,industrial and urban uses,and delta wetland environments(Jia et al.,2006;Yang et al.,2009,2013);maintenance of the operating life of reservoirs with decreasing capacity due to sedimentation(Chamoun et al.,2016;Guo et al.,2015;Ran et al.,2013);and the alleviation offlood risk due to the high riverbed level of suspended rivers(Bai et al.,2016).Under the influence of human activities and natural factors,the Yellow River has been in an unstable water-sediment condition since the 1970s(Xu,2003).With a goal of maintaining Yellow River health and establishing a harmonious water-sedimentrelationship,some techniques,including joint reservoir operation and sediment evacuation and agitation,are used in the water-sediment regulation(WSR)scheme,in order to create a man-madeflood peak and allow turbidity venting to scour river channels downstream and wash away the reservoir sedimentation(Li and Sheng,2011).Since 2002,the implementation of WSR has efficiently reduced deposition,diminished the riverbed downstream,increased theflow capacity and sediment transport,and improved the wetland environment of the Yellow River Estuary(Xu and Si,2009;Li and Sheng,2011).
Although the effect of WSR,mainly focused on solving the sedimentation problems of reservoirs and the lower reaches of the Yellow River,has been validated partially(Miao et al.,2016;Kong et al.,2015a),a large quantity of water and sediment discharge into the sea over half a month has inevitably induced many attendant problems(Kong et al.,2015b;Xia et al.,2016;Wang et al.,2017).The integrated management of the basin,channel,and estuary has to be studied(GWP,2000;Campbell,2016).In the WSR period(WSRP),compared with the normal period(NP),the Yellow River Estuary experienced a strong influence of human activities because of the rapid artificial turbidity of the current flow process.In addition to research on the environmental impact of WSR in the Yellow River Estuary(Xu et al.,2016;Li et al.,2017),the dramaticcoastlineswing and sedimentation morphology in the estuary region have been explored(Dong et al.,2015;Zeng et al.,2015).Along with the development of remote sensing and data availability,coastline change(Rahman et al.,2011;Liu et al.,2013;Li and Gong,2016;Ghosh et al.,2015)and suspended sediment(Volpe et al.,2011;Guo et al.,2017)have been broadly analyzed using remotely sensed data on coastal ocean and climate change.Using 27 satellite images,Cui and Li(2011)concluded that the Yellow River Estuary experienced a slow accretion stage from 2003 to 2010.Zhou et al.(2015)studied the progradation of the Yellow River Estuary and found that coastlines were an integrated response to the complex variations in both sediment and water supply in the WSRP.Wang et al.(2014)concluded that the process of sediment transport in the coastal ocean was mostly dominated by riverine and ocean dynamics,which were disturbed by WSR.Wu et al.(2015)collected surface sediment samples at 15 stations before,during,and after the WSR in 2013 to examine the spatial distribution of sediment with different grain sizes.
With a maximum riverflow of approximately 4000 m3/s delivered to the river mouth for almost 15 days every year during the WSRP(Wang et al.,2005),the Yellow River Estuary was changed dramatically.There are two important things that need to be analyzed:(1)the effect of WSR,and(2)the impact of WSR on the Yellow River Estuary in terms of changes in morphology and sediment distribution.However,even after the implementation of WSR each year from 2002 onward,there has not been a sufficient degree of detailed comparative analysis of the coastline and suspended sediment concentration(SSC)variations in the NP(1986-2001)and WSRP(2002-2013).The purpose of this study was to(1)investigate the water and sediment conditions from 1950 onward,(2)to systematically compare the variations of coastline and SSC in the NP and WSRP,and(3)tofinely dissect the intra-annual changes of the coastline and SSC in the NP(before and after theflood season)and WSRP(before and after WSR).
2.Data and methodology
2.1.Study area
The Yellow River Estuary,located in the Bohai Sea,is wellknown for its rapid erosion-deposition variation(Milliman and Meade,1983)and frequent shifting courses in the lower reaches(Wang et al.,1986),caused by the dramatic change of riverflows,ocean tides,and currents.The Yellow River course has changed more than 50 times in the past 150 years because of either natural or anthropogenic reasons(Pang and Si,1979;Zhong et al.,2003),including from the Diaokou course to the Qingshuigou course in 1976,from the Qingshuigou course to the Q8 course in August 1996,and then to downstream of the Q8 course in 2008(Liu et al.,2013).The study area is shown in Fig.1.
2.2.Data sources
Data for monthly runoff and sediment load at Lijin Station and Huayuankou Station from 1950 to 2014 were collected from the Yellow River Conservancy Commission(YRCC).Due to the moderate frequency(16 days)and medium resolution(30 m),Landsat imagery was used for coastline delineation and sediment concentration calculation.In this study,a total of 56 Landsat images were collected from 1986 to 2015,obtained from a thematic mapper(TM)and an enhanced thematic mapper(ETM+)(Table 1 and Table 2)in each year of the NP(before and after theflood season)and in each year of the WSRP(before and after WSR).Because of missing data or cloud coverage,images near these timing nodes were supplemented.All remote images were selected from the Earth Resources Observation and Science(EROS)Center(http://glovis.usgs.gov/),and the Chinese Academy of Sciences(http://www.gscloud.cn/).
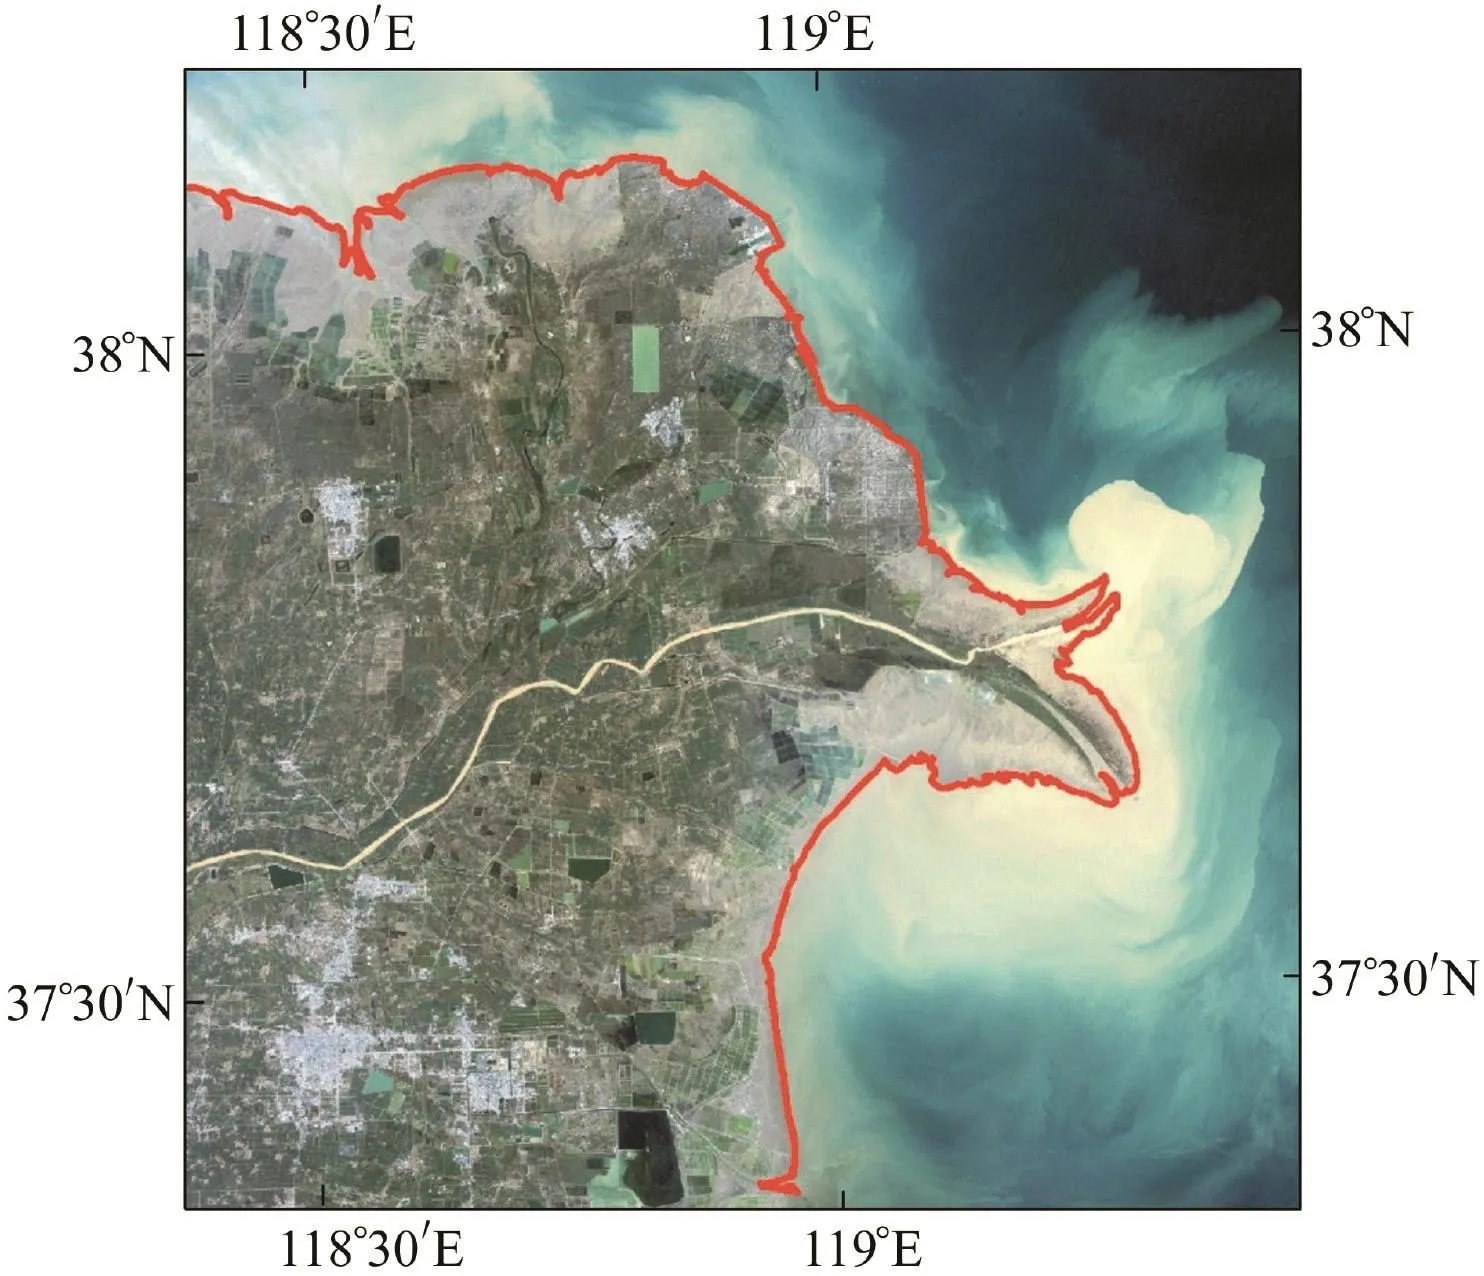
Fig.1.Study area.
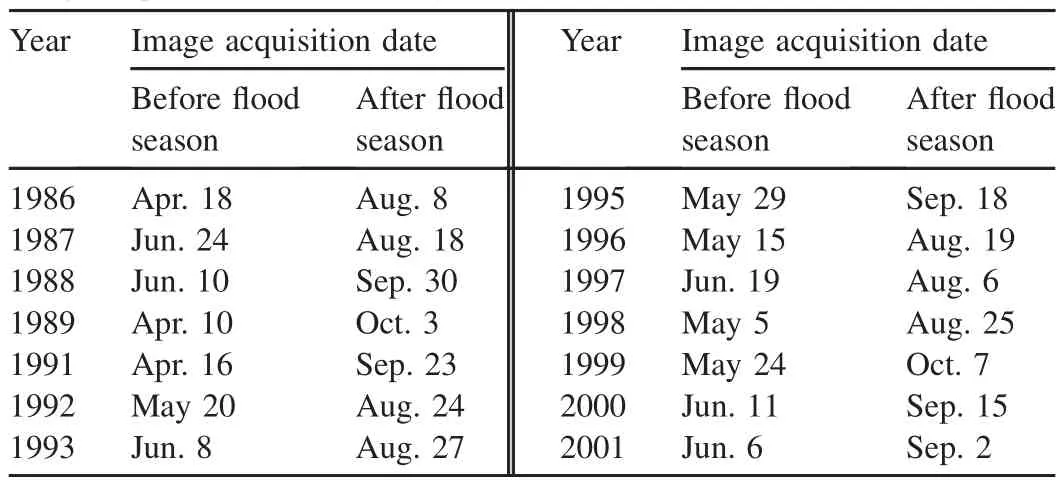
Table 1 Image acquisition date in each year of NP.
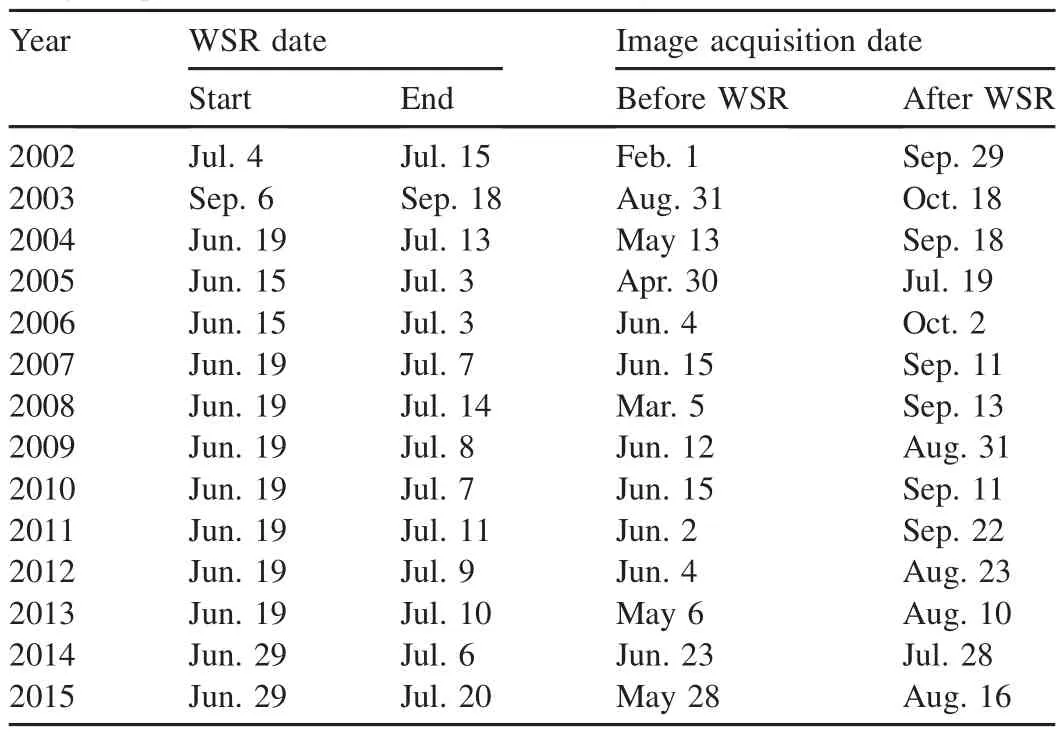
Table 2 Image acquisition date and WSR date in each year of WSRP.
2.3.Coastline delineation and SSC retrieval
After the normalized difference water index(NDWI)was introduced to delineate open water features(McFeeters,1996),the modified normalized difference water index proposed by Xu(2006)was widely used(Yang et al.,2011;Ogilvie et al.,2015).Its mathematical expression is

where MNDWIis the modified normalized difference water index,and RMirand RGrespectively represent the reflectivities of the mid-infrared band and green band.After MNDWIwas calculated by the ENVI software,in order to delineate the coastline,the thresholds of MNDWIshould be used to differentiate the water body from the non-water body areas.Considering that coastlines varied with time and tide,data quality was controlled in two ways.First,the stable area of the entire Yellow River Delta for each year was abstracted and analyzed to calculate the area change ratio,which is the ratio of the difference between the annual stable delta area and multi-year mean delta area to the multi-year mean delta area.Second,in consideration of the subjectivity of the threshold,the slope of the MNDWIwas calculated with ArcGIS software to quantify the threshold,through which obvious boundaries can be detected and delineated to obtain thefinal coastlines.By assuming the dynamic equilibrium of coastlines,Fig.2 shows that the mean area change ratio accounts for 0.79%of the total delta area,indicating that the results have relatively reliable accuracy.
In addition to traditional methods,by virtue of remote sensing,the beam reflectance,optical backscattering,optical transmission,and spectral reflectance can be used for SSC measurement(Wren et al.,2000).Various visible and near infrared band combinations have been proposed to determine SSC in coastal or estuarine environments using several multispectral satellite sensors(Volpe et al.,2011).Inter-annual and seasonal variations of SSC in the Yellow River Estuary have been studied and assessed from 2000 to 2010(Zhang et al.,2014).Through spectralfield measurement and sampling investigation in the Yellow River Estuary,Fan et al.(2007)analyzed the relationship of waveband combinations and SSC,and put forward an equation that was used in this study.
3.Results and discussion
3.1.Water and sediment conditions in NP and WSRP
Table 3 presents the average runoff and sediment load in two periods at Lijin Station.Data indicate that,since 1986,water and sediment conditions have experienced enormous change in the Yellow River Estuary.The average annual runoff at Lijin Station from 1986 to 2001 was 137.78×10⁸m3and the average annual sediment load was 3.51×10⁸t.During the WSRP,after the implementation of WSR,the average annual runoff increased to 184.28×10⁸m3,the average annual sediment load decreased to 1.60×10⁸t.Comparing the NP and WSRP,we find that the runoff proportion in the flood season increased from 56.77%to 57.47%,while the sediment proportion decreased from 87.46%to 77.50%.
Calculation of the average monthly runoff and sediment load in the two periods shows that implementation of WSR extended the ranges with a relatively high runoff and sediment load in theflood season,due mostly to the WSR process from June to July(Fig.3).
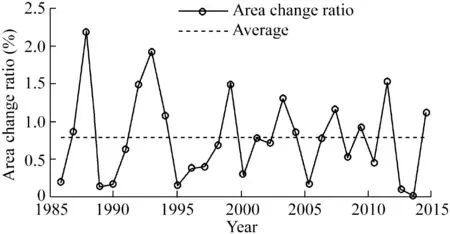
Fig.2.Area change ratio of Yellow River Delta.
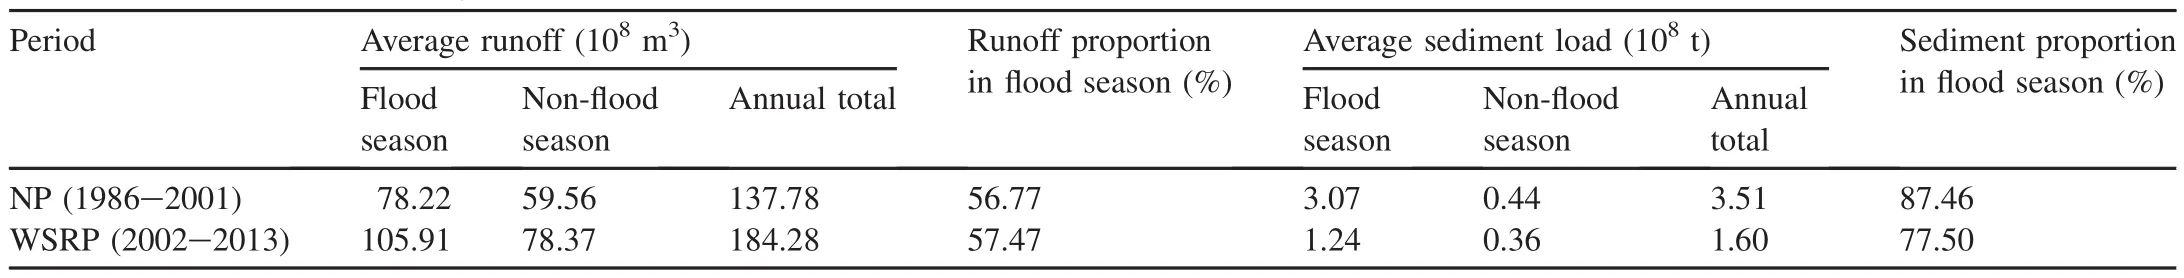
Table 3 Water and sediment data from Lijin Station.
Long-term continuous sedimentation in the lower reaches of the Yellow River was indicated from the sediment difference between Lijin Station and Huayuankou Station from 1950 to 2002.However,after WSR implementation from 2002 onward,Fig.4 shows that the sedimentation turned into erosion,indicating that WSR reduces sedimentation of riverbed and reservoirs.
3.2.Coastline change
In order to analyze long-term serial coastline changes and spatial siltation and erosion evolution in the estuary from 1986 onward,multiple satellite images were used to delineate the coastlines.Fig.5 shows the changes in the coastlines in the NP and WSRP.The coastline pushed forward before 1997 and shrank after 2003 in the southern part of the mouth because of the river mouth shift in 1996,and continually extended outward in the northern part of the river mouth from 2003 onward.
As shown in Fig.6,coastlines before and after WSR for each year from 2002 to 2013 were extracted.A comparative analysis was made of coastlines in the Yellow River Estuary throughout these years,and results indicated that the coastline in the southern part of the mouth swung randomly and included a certain amount of erosion,because of the sedimentation caused by reclamation and sea wave intrusion.In most cases,the coastlines extended offshore,especially in the northern part of the river mouth.However,in some years,the changes were not coincident with the described phenomena because the image data selected were far from the research timing node.
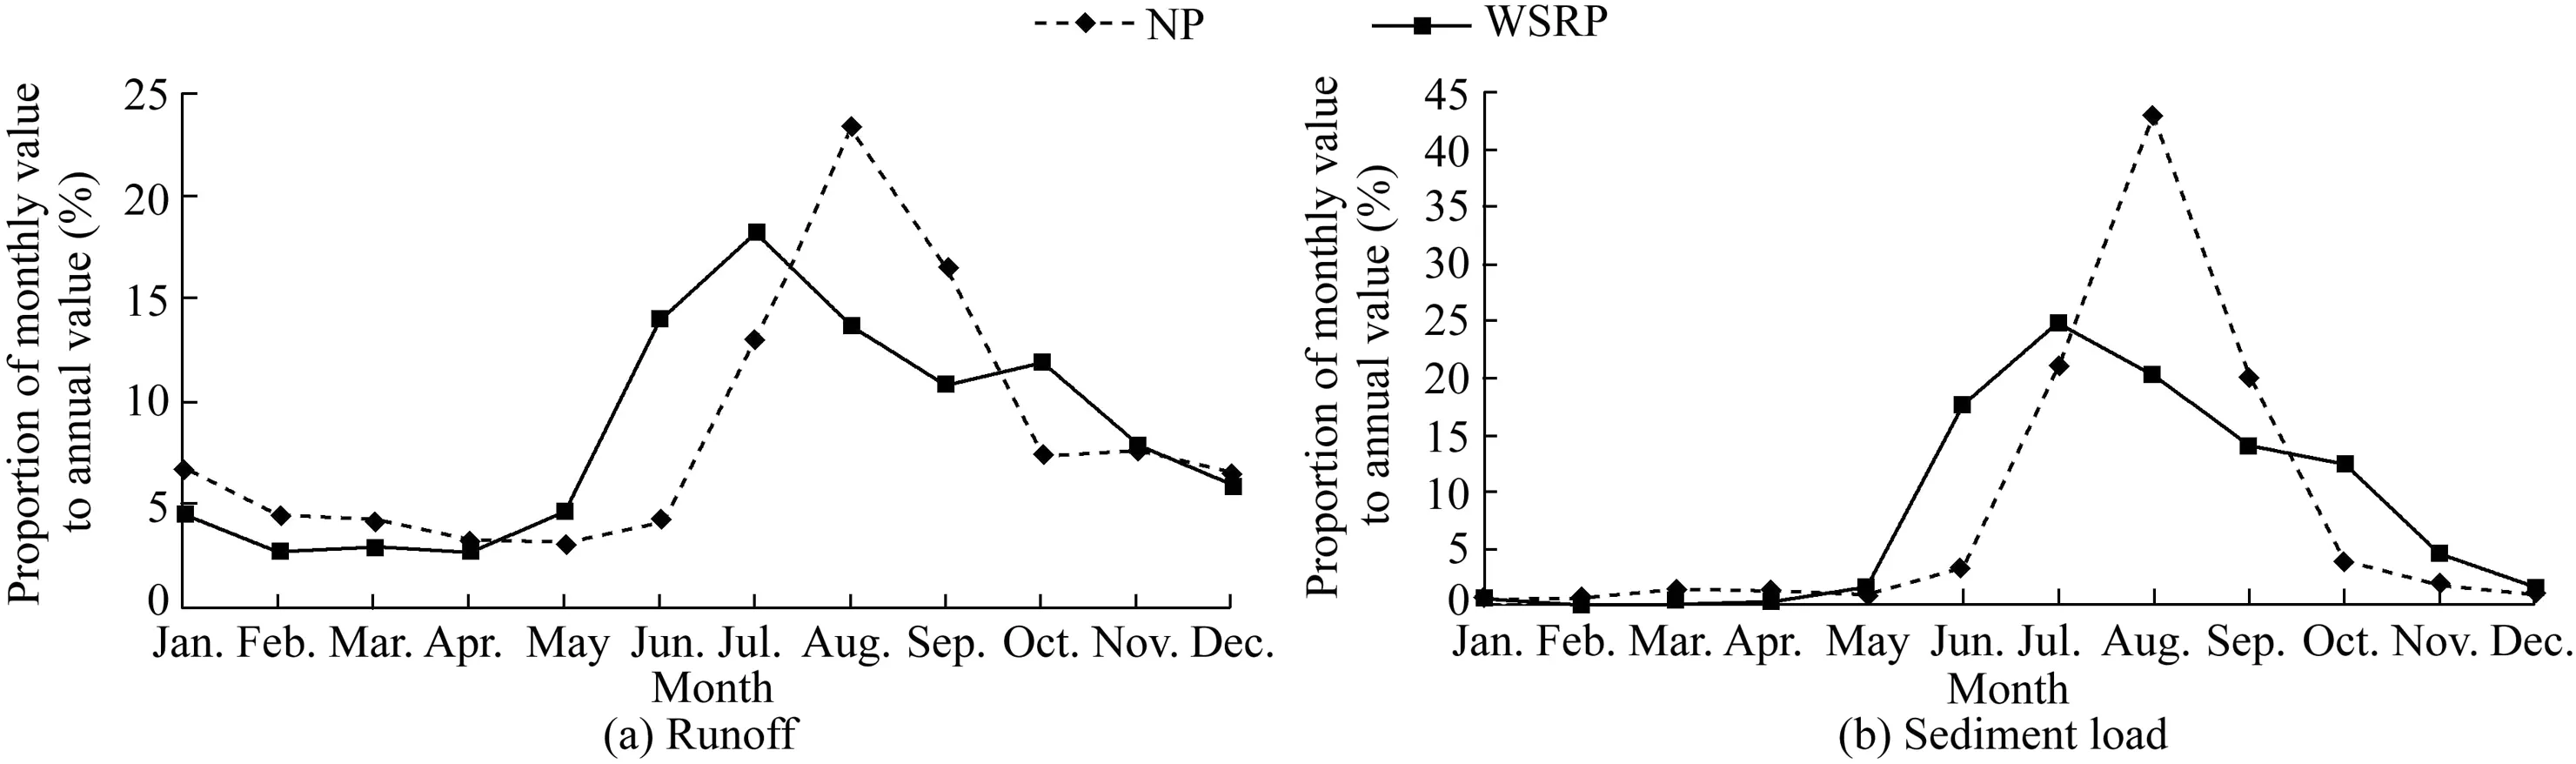
Fig.3.Proportion of monthly water runoff and sediment load to annual values at Lijin Station in NP and WSRP.
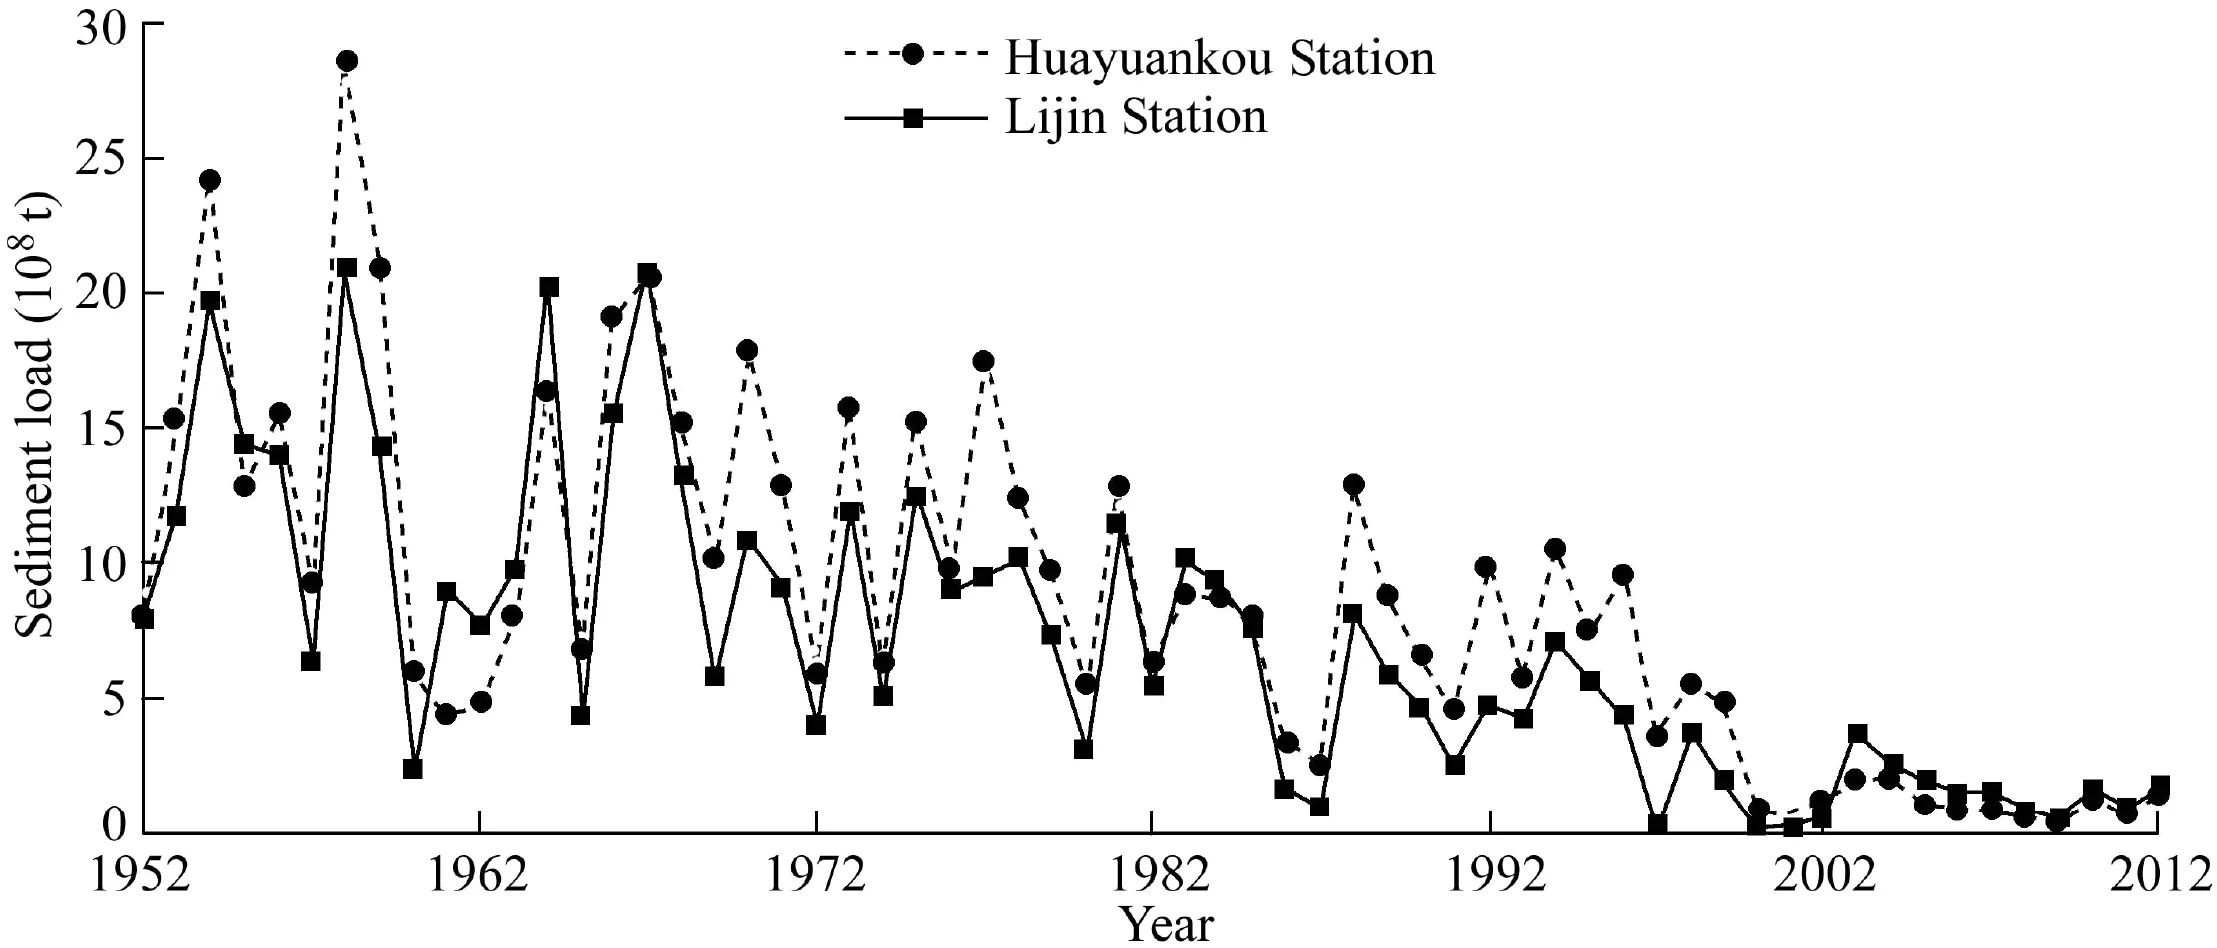
Fig.4.Sediment loads at Huayuankou Station and Lijin Station.
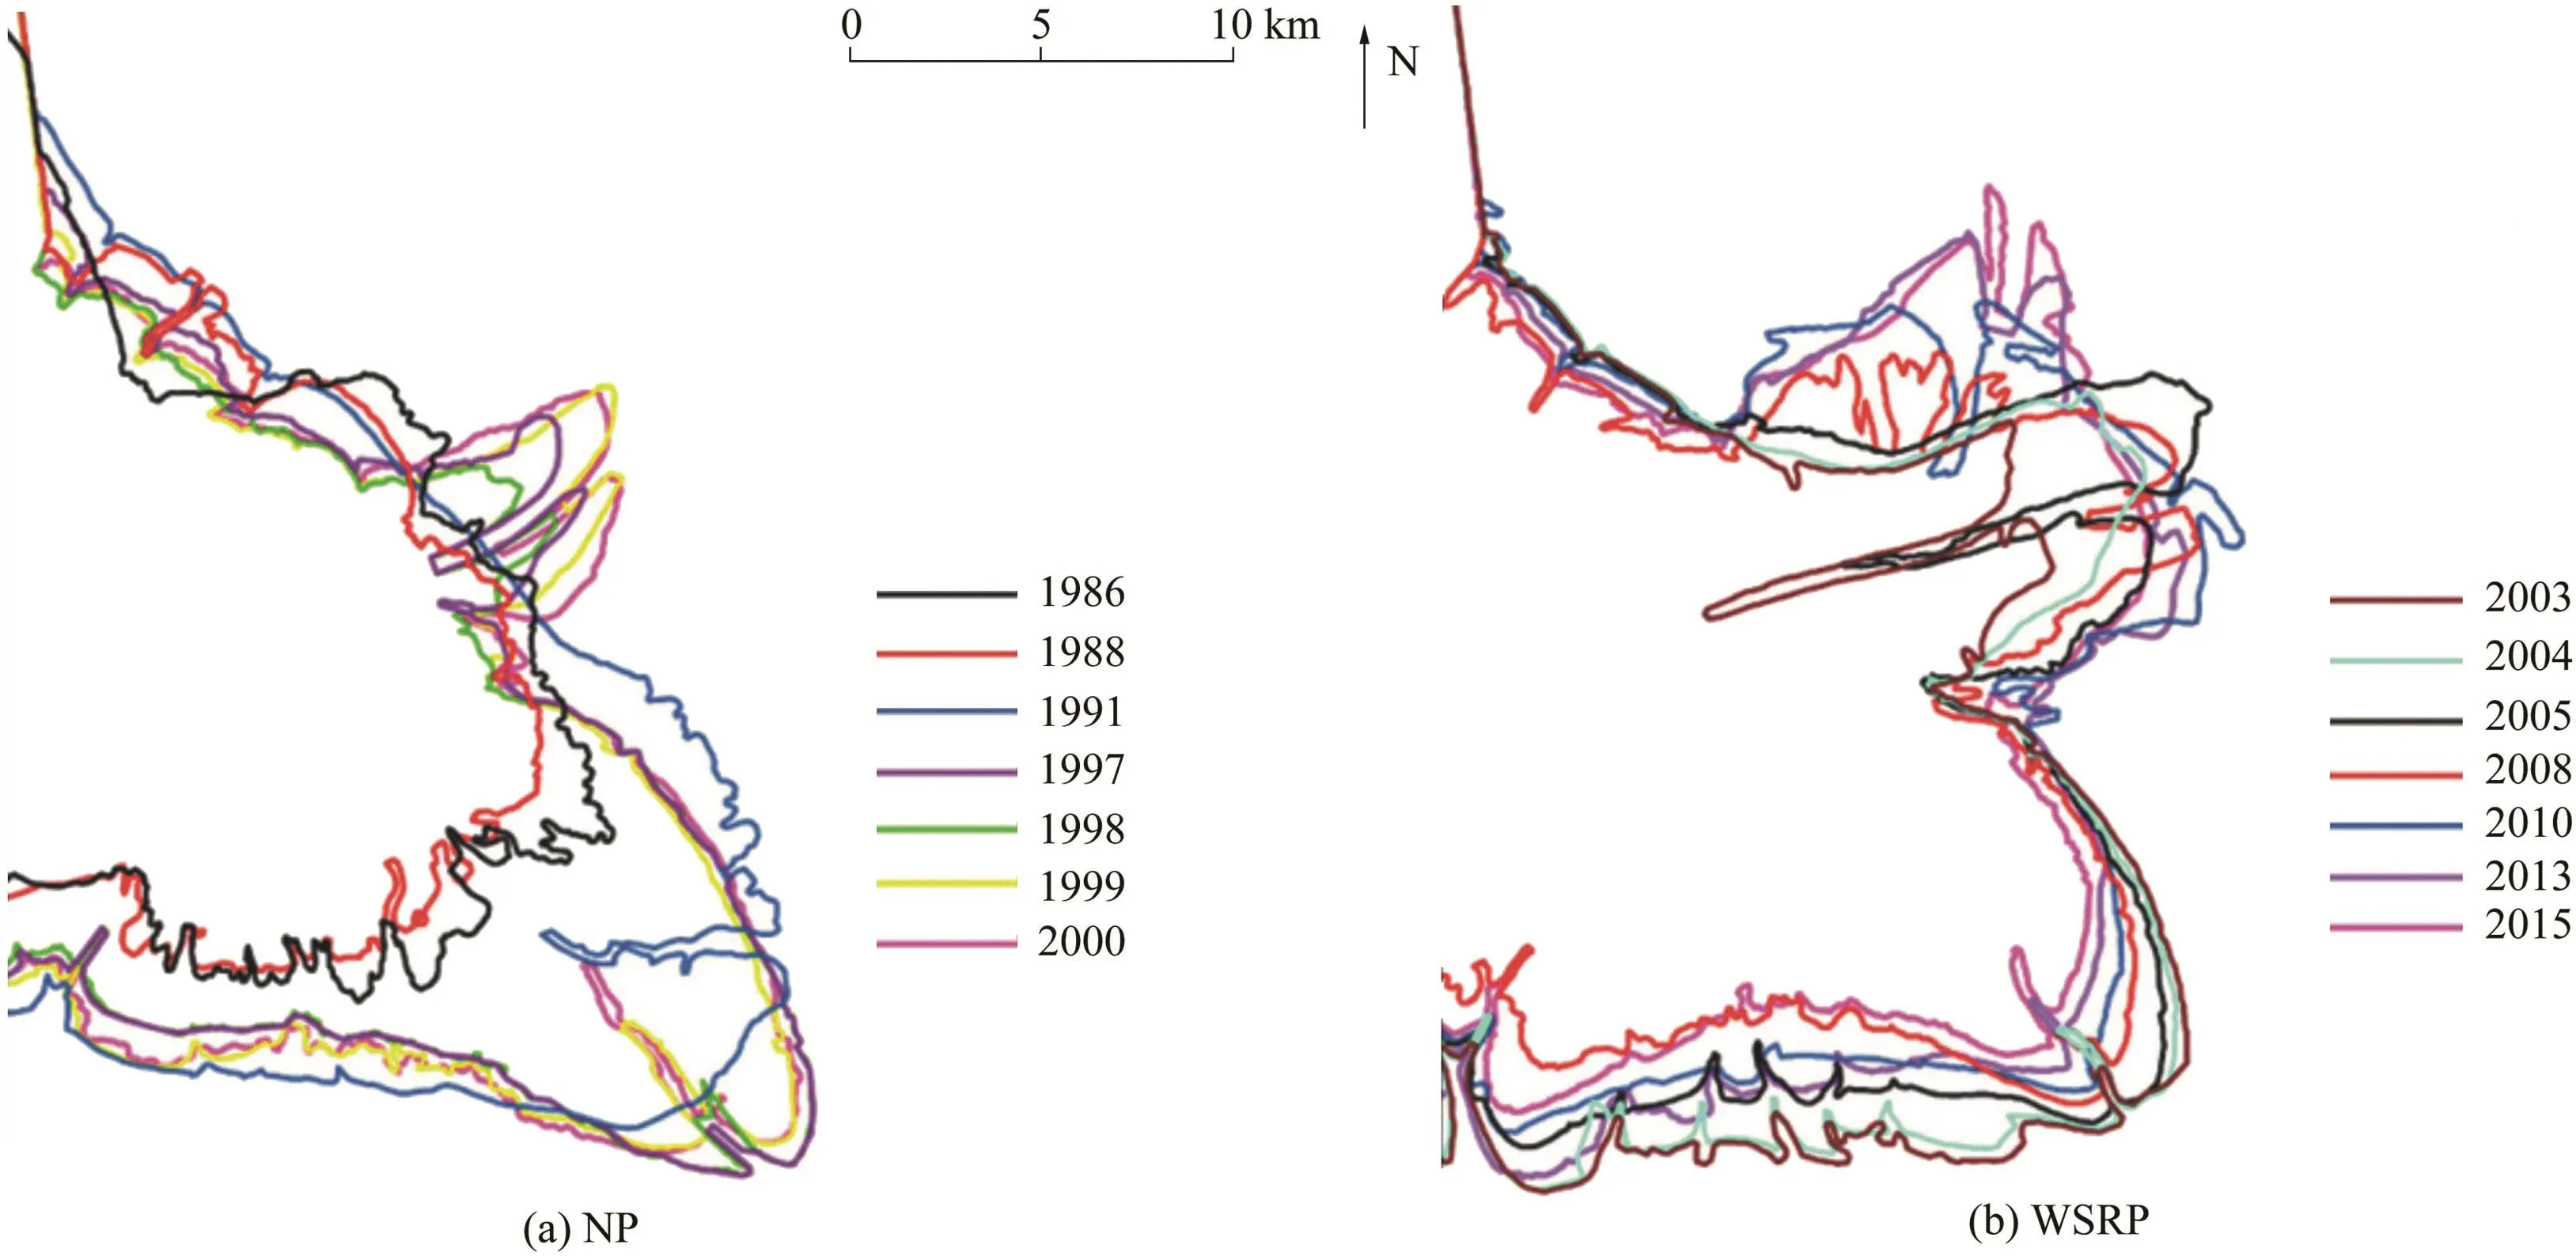
Fig.5.Changes of coastlines in NP and WSRP.
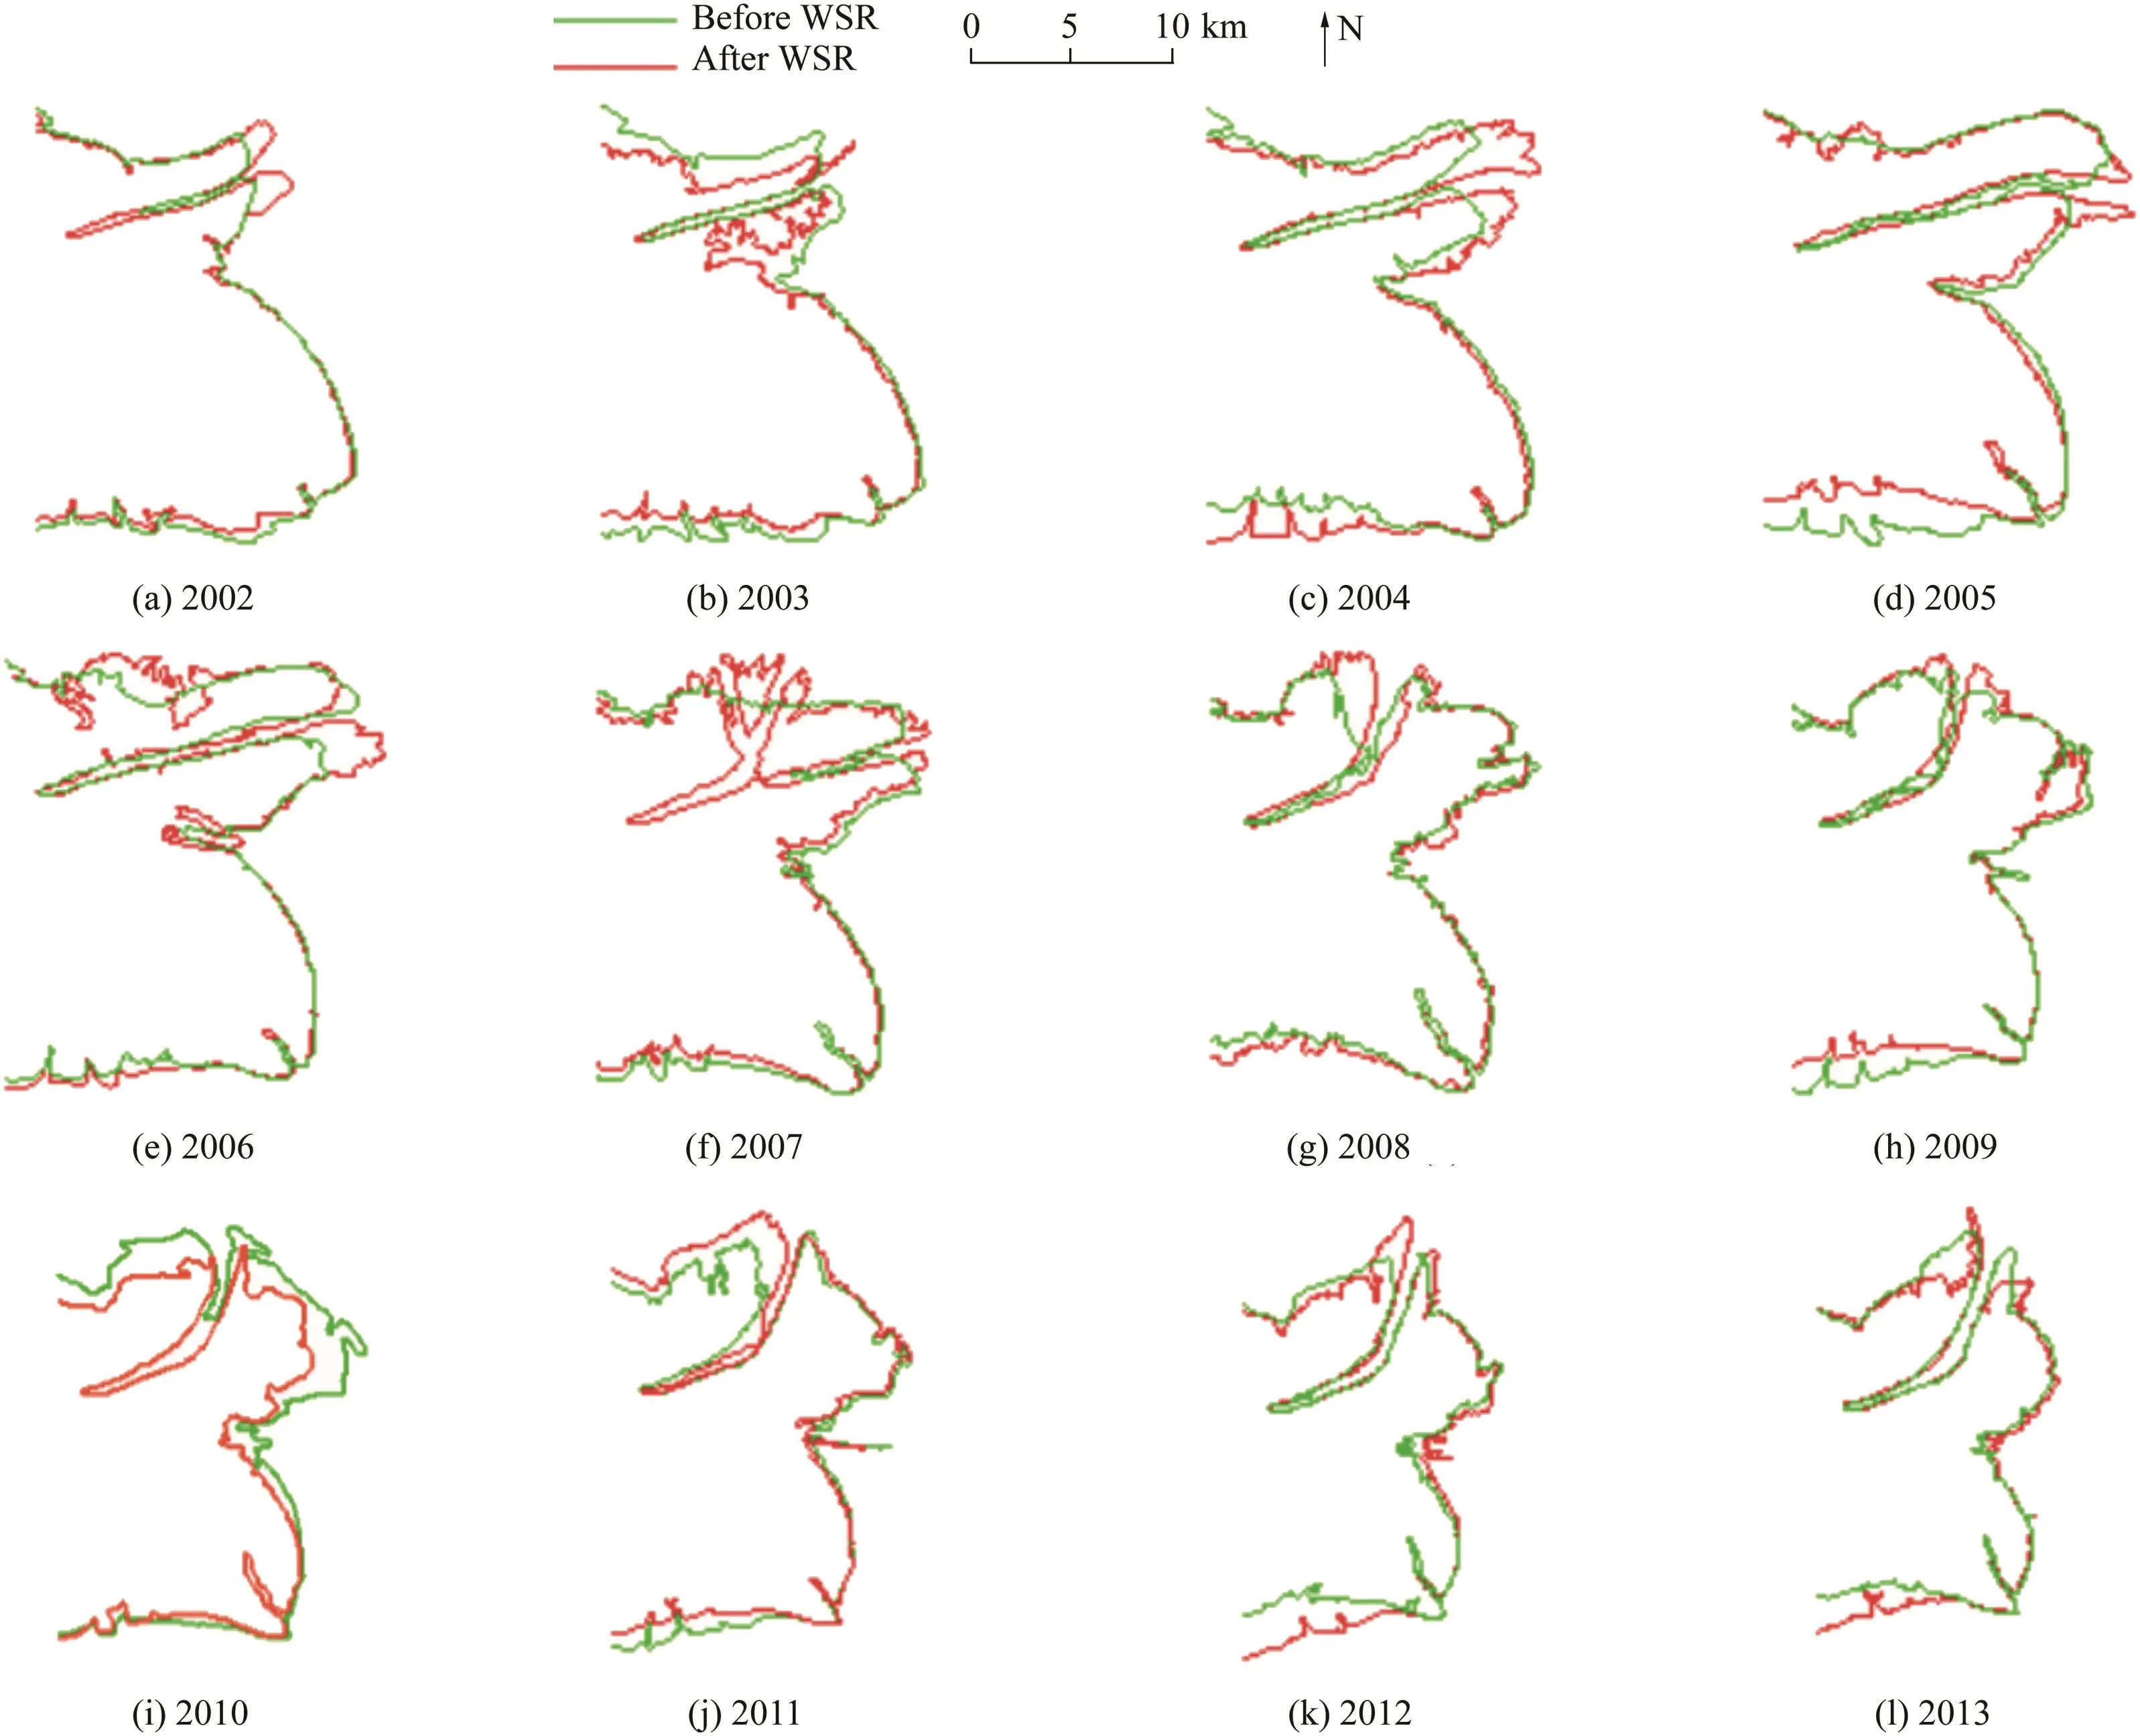
Fig.6.Changes of coastline in Yellow River Estuary before WSR and after WSR from 2002 to 2013.
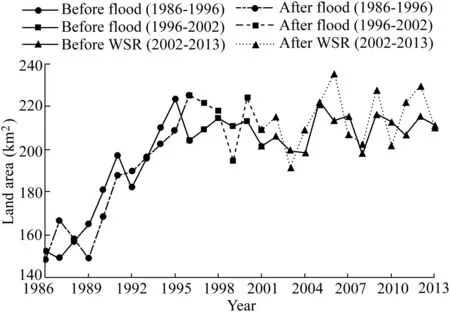
Fig.7.Land area change in Yellow River Estuary in different periods.
In order to conduct further quantitative analysis of Yellow River Estuary changes(before and after the timing nodes)in the NP and WSRP,the land area was extracted and calculated for each year(Fig.7).Results indicated that area increases in the Yangtze River Estuary mainly appeared at the river mouth,and the coastline shrank in different regions to different degrees.Because of missing data or cloud coverage,data in some years(1990 and 1994)were supplemented using data from adjacent years.We found that the accretion-erosion evolution of coastlines could be divided into three stages from 1986 to 2013:the accretion stage(1986-1996),the slow erosion stage(1996-2002),and the slow accretion stage(2002 to the present).This corresponds to other research results(Cui and Li,2011).The mean accretion area in the NP,which is the difference between the land areas before and after theflood season,was 0.789 km2,and the mean accretion area in the WSRP,which is the difference between the land areas before and after WSR,was 4.73 km2.
3.3.SSC spatial analysis
SSC distribution in some years is shown in Fig.8.The suspended sediment in the estuary sea area was mainly distributed along the bank.SSC rapidly decreased as the offshore distance increased,and the concentration and diffusion scope of sediment discharging into sea after theflood season were higher than those before theflood season.All extreme SSC values appeared near the Yellow River Estuary,indicating that a large proportion of sediment discharging into the sea was deposited near the estuary.Only a small proportion of suspended sediments discharging into the sea in the Yellow River Estuary diffused northward,while most diffused towards the sea area of Leizhou Bay due to the combination of river dynamics and ocean dynamics.Under normal conditions,the high-concentration sediment center in the estuary region was connected to the sea area of Leizhou Bay.
In order to analyze SSC spatial distribution variation with the offshore distance in different directions,and then to conduct quantitative analysis of SSC and its distribution in the estuary,the Yellow River Estuary was divided into 12 zones in two steps,as follows.First,three buffer regions with different distances from the coastline were generated.Second,extending from a certain point,five lines were drawn at an angle of 45°.As shown in Fig.9,A1 through A4 constitute the first buffer region(0-5 km away from the coastline),B1 through B4 constitute the second buffer region(5-10 km away from the coastline),and C1 through C4 constitute the third buffer region(10-20 km away from the coastline).Using the SSC distributions in 1991 and 2012 as examples,the SSC values showed a consistent decreasing trend offshore;SSC values in zones A4,B4,and C4 were higher than others;and SSC values after theflood season in 1991 and after WSR in 2012 were higher than those before theflood season in 1991 and before WSR in 2012,respectively(Fig.9).
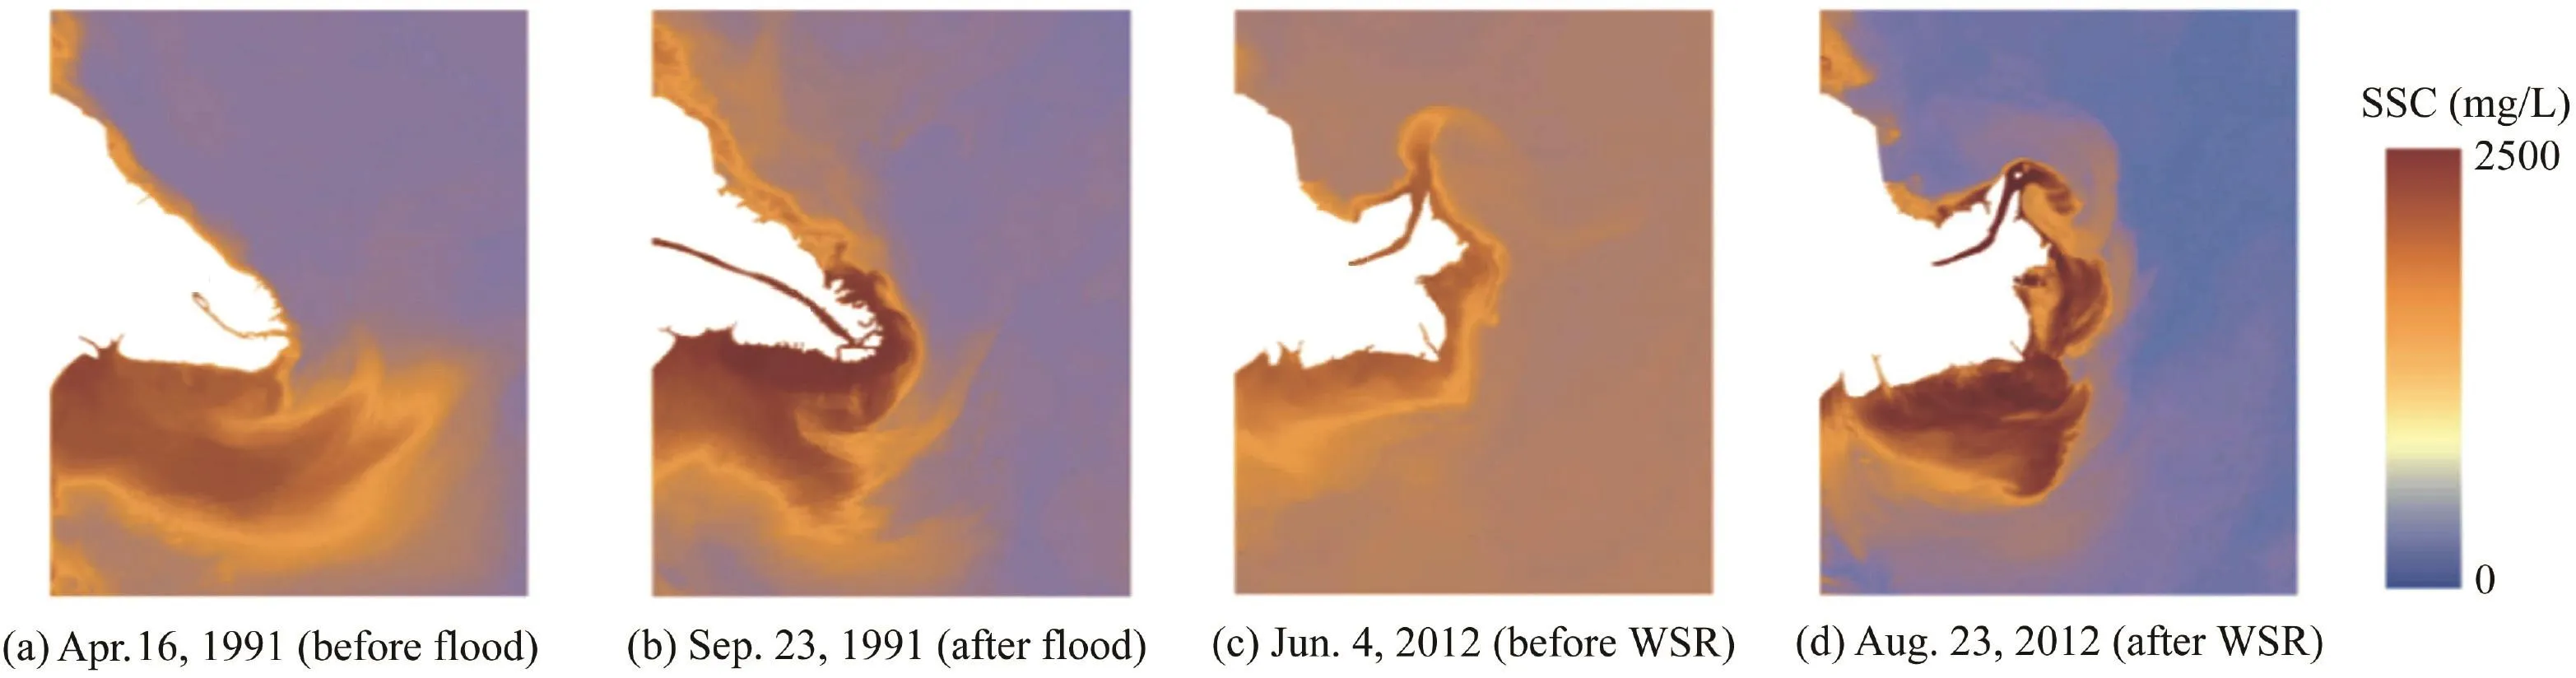
Fig.8.Distribution of SSC in Yellow River Estuary.
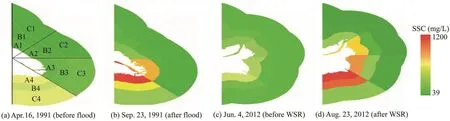
Fig.9.Distribution of zonal average SSC in Yellow River Estuary.
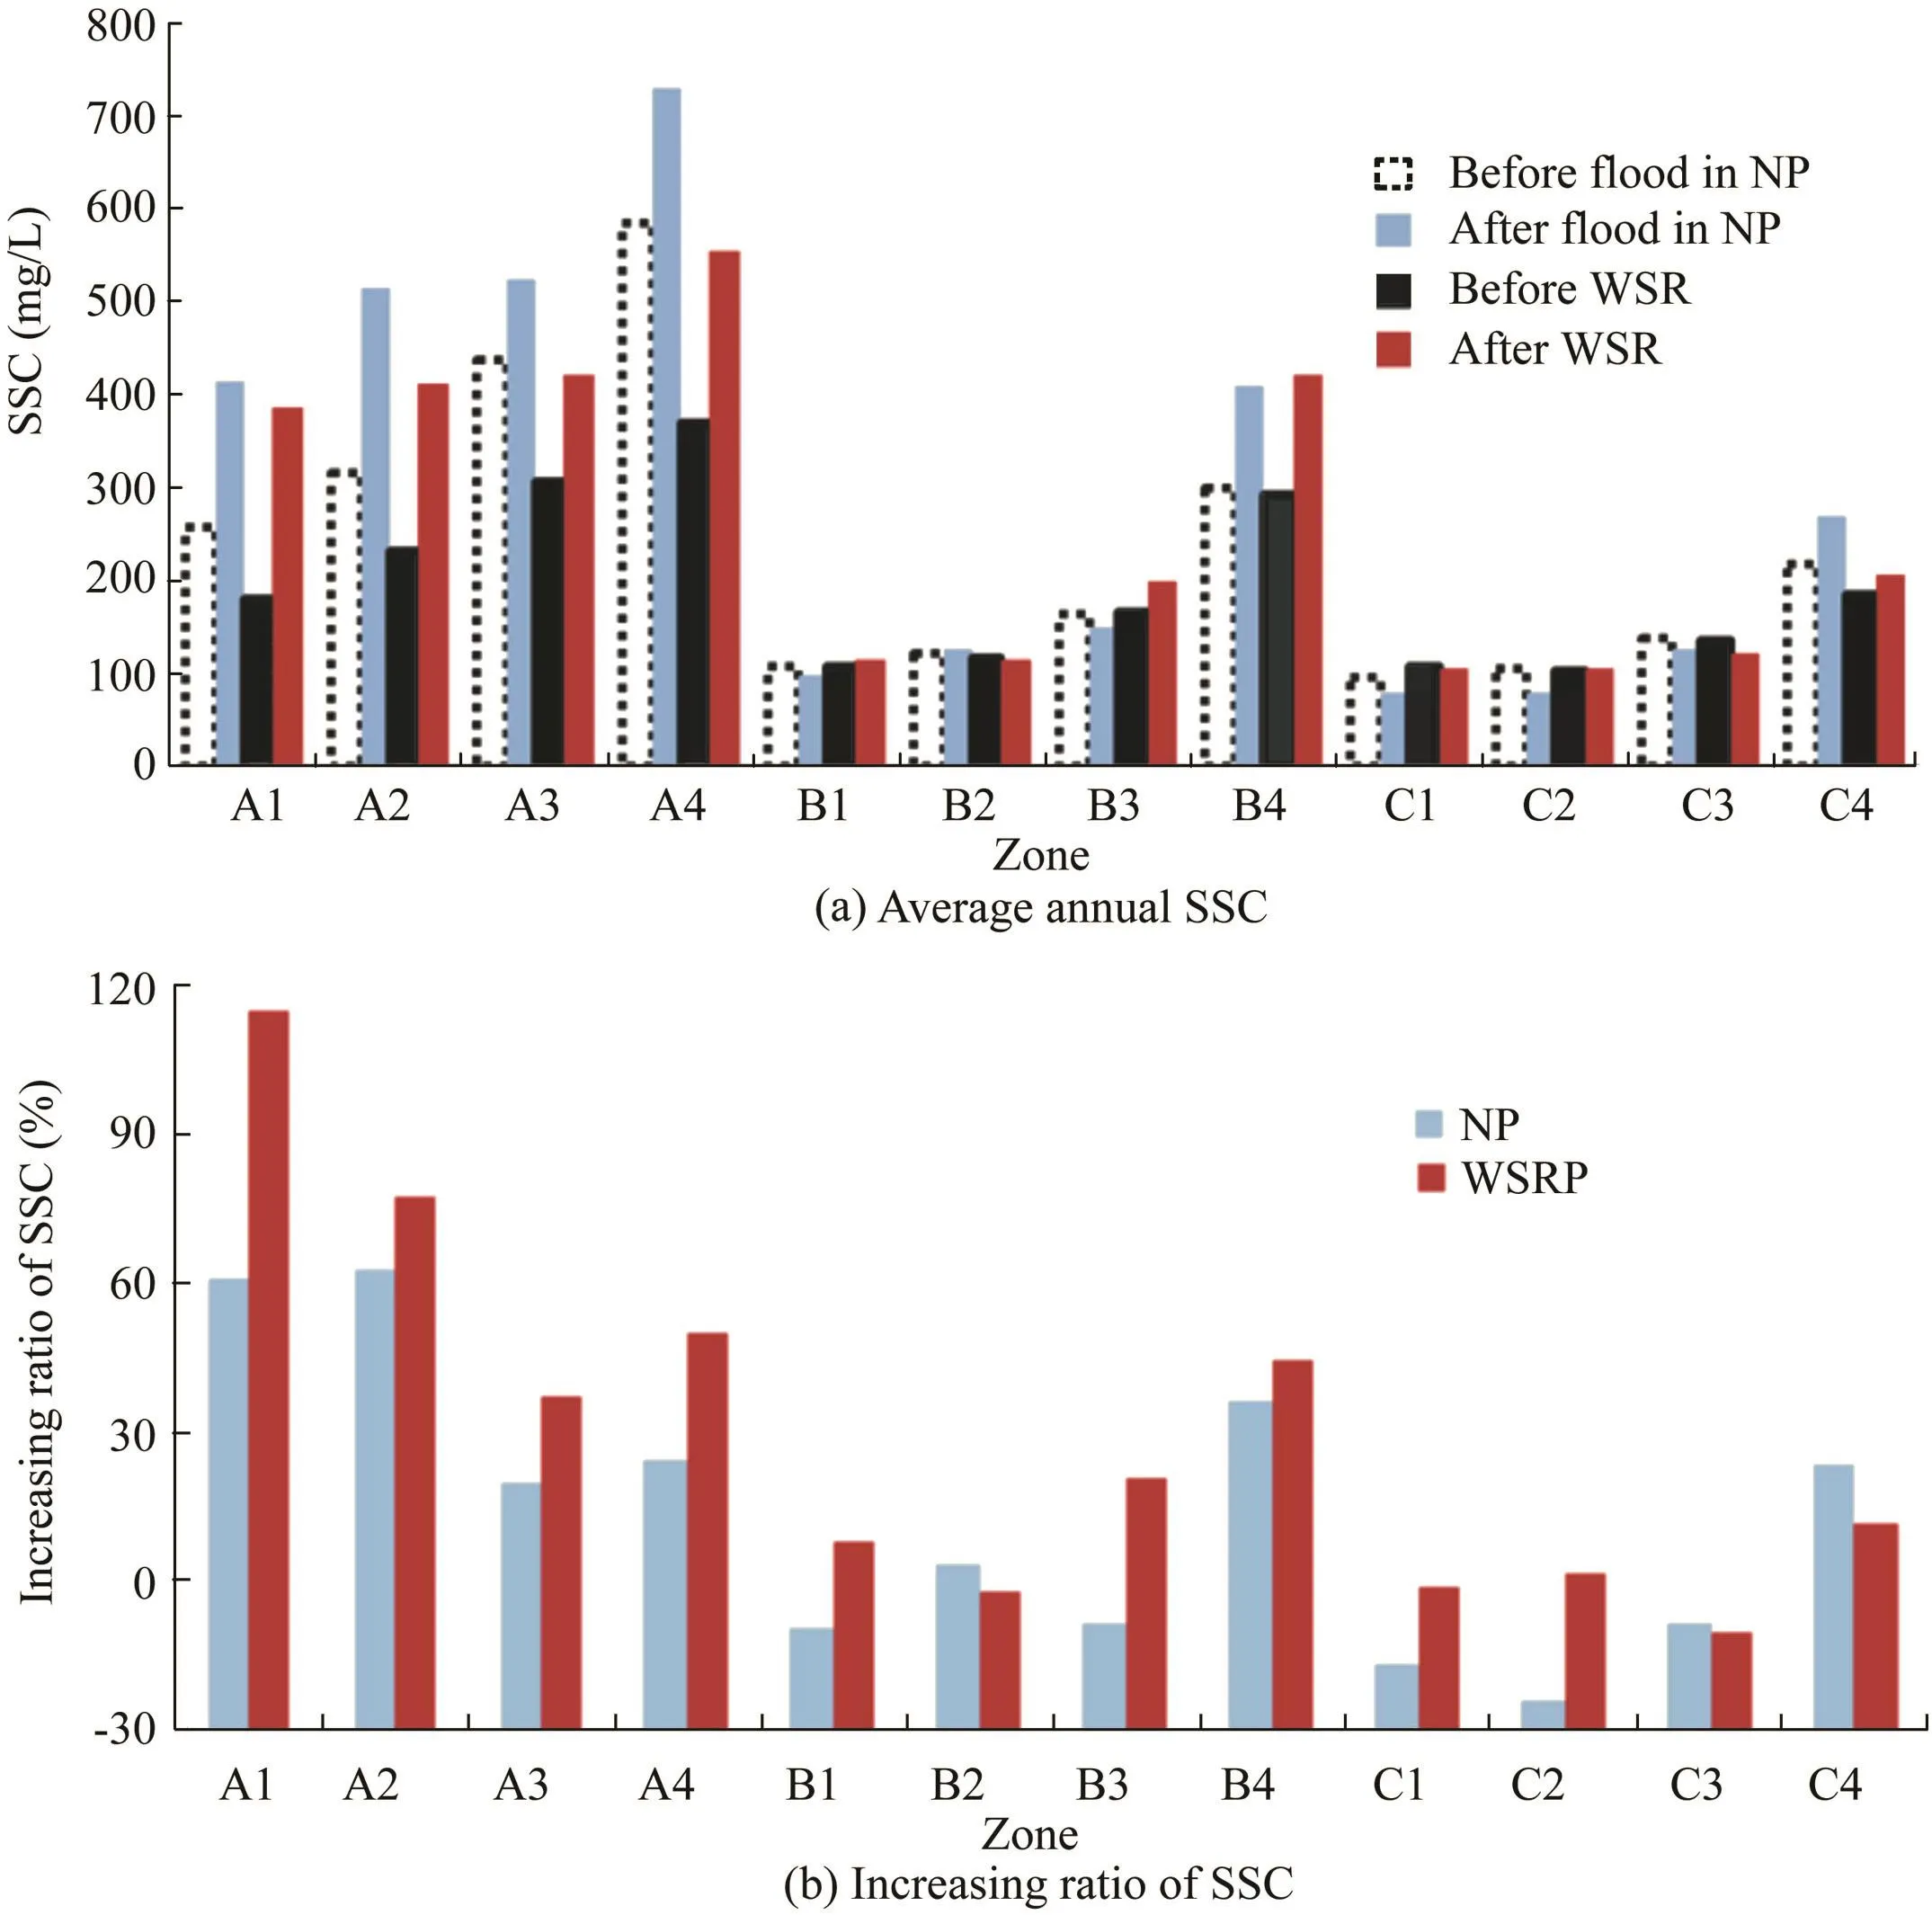
Fig.10.Mean annual SSC and its increasing ratio in different zones.
Based on calculation of partial statistical results,we obtained average SSC in different zones before and after theflood season in the NP and before and after WSR in the WSRP.The results are shown in Fig.10.The average annual values of SSC after theflood season were higher than those before theflood season.During the NP,the average annual value of SSC in the estuary changed from 238 mg/L before theflood season to 293 mg/L after theflood season,while the average annual value of SSC during the WSRP changed from 192 mg/L before regulation to 264 mg/L after regulation.The varying amplitude of average annual SSC values in different periods decreased as the offshore distance increased,and the SSC value within thefirst buffer region(0-5 km away from the coastline)was the maximum.There was basically no difference between the average annual SSC values in the third buffer region(10-20 km away from the coastline),which indicated that sediment transport in this region was mainly influenced by ocean dynamics rather than river dynamics.The increasing ratio of SSC resulting from WSR after 2002 was high than that induced by theflood during the NP(Fig.10(b)).
4.Conclusions
This study analyzed the runoff and sediment load from 1950,extracted estuary coastlines and SSC distribution in the offshore region in the Yellow River Estuary to describe the serial variation in the NP and WSRP,and identified detailed intra-annual changes in the coastline and SSC in the NP(before and after theflood season)and WSRP(before and after WSR)using two images from each year.The results are as follows:
(1)Comparing the NP with WSRP,the runoff proportion in theflood season increased from 56.77%to 57.47%and the sediment proportion decreased from 87.46%to 77.50%.The implementation of WSR extended the ranges with a high runoff and sediment load in theflood season.After the implementation of WSR from 2002 onward,the sedimentation in the low reaches of the Yellow River turned into erosion,indicating that WSR can reduce sedimentation of the riverbed and reservoirs.
(2)The implementation of WSR changed the original water and sediment conditions in the Yellow River,and resulted in changes of land-sea morphology in the Yellow River Estuary.Coastlines mostly extended outward in the river mouth in the WSRP.However,in some years,the changes were not coincident with the observed phenomena because the image data selected were far from the research timing node.The mean accretion area increased from 0.789 km2in the NP to 4.73 km2in the WSRP.
(3)The average annual value of SSC in the Yellow River Estuary changed from 238 mg/L before theflood season to 293 mg/L after theflood season during the NP,while it increased from 192 mg/L before WSR to 264 mg/L after WSR during the WSRP.
Bai,P.,Liu,X.M.,Liang,K.,Liu,C.M.,2016.Investigation of changes in the annual maximumflood in the Yellow River Basin,China.Quat.Int.392,168-177.https://doi.org/10.1016/j.quaint.2015.04.053.
Campbell,I.C.,2016.Integrated management of large rivers and their basins.Ecohydrol.Hydrobiol.16(4),203-214.https://doi.org/10.1016/j.ecohyd.2016.09.006.
Chamoun,S.,Cesare,G.D.,Schleiss,A.J.,2016.Managing reservoir sedimentation by venting turbidity currents:A review.Int.J.Sediment Res.31(3),195-204.https://doi.org/10.1016/j.ijsrc.2016.06.001.
Cui,B.L.,Li,X.Y.,2011.Coastline change of the Yellow River Estuary and its response to the sediment and runoff(1976-2005).Geomorphology 127(1-2),32-40.https://doi.org/10.1016/j.geomorph.2010.12.001.
Dong,J.W.,Xia,X.H.,Wang,M.H.,Lai,Y.J.,Zhao,P.J.,Dong,H.Y.,Zhao,Y.L.,Wen,J.J.,2015.Effect of water-sediment regulation of the Xiaolangdi Reservoir on the concentrations,bioavailability,andfluxes of PAHs in the middle and lower reaches of the Yellow River.J.Hydrol.527,101-112.https://doi.org/10.1016/j.jhydrol.2015.04.052.
Fan,H.,Huang,H.J.,Tang,J.W.,2007.Spectral signature of waters in Huanghe Estuary and estimation of suspended sediment concentration from remote sensing data.Geomatics Inf.Sci.Wuhan Univ.32(7),601-604.https://doi.org/10.13203/j.whugis2007.07.009(in Chinese).
Ghosh,M.K.,Kumar,L.,Roy,C.,2015.Monitoring the coastline change of Hatiya Island in Bangladesh using remote sensing techniques.ISPRS J.Photogrammetry Remote Sens.101,137-144.https://doi.org/10.1016/j.isprsjprs.2014.12.009.
Global Water Partnership(GWP),2000.Integrated Water Resources Management(IWRM).Global Water Partnership,Stockholm.
Guo,K.,Zou,T.,Jiang,D.,Tang,C.,Zhang,H.,2017.Variability of Yellow River turbid plume detected with satellite remote sensing during watersediment regulation.Continent.Shelf Res.135,74-85.https://doi.org/10.1016/j.csr.2017.01.017.
Guo,S.L.,Sun,D.P.,Jiang,E.H.,Li,P.,2015.Equilibrium sediment transport in lower Yellow River during later sediment-retaining period of Xiaolangdi Reservoir.Drink.Water Eng.Sci.8(1),78-84.https://doi.org/10.1016/j.wse.2015.01.006.
Jia,Y.W.,Wang,H.,Zhou,Z.N.,Qiu,Y.Q.,Luo,X.Y.,Wang,J.H.,Yan,D.H.,Qin,D.Y.,2006.Development of the WEP-L distributed hydrological model and dynamic assessment of water resources in the Yellow River Basin.J.Hydrol.331(3-4),606-629.https://doi.org/10.1016/j.jhydrol.2006.06.006.
Kong,D.X.,Miao,C.Y.,Borthwick,A.G.L.,Duan,Q.Y.,Liu,H.,Sun,Q.H.,Ye,A.Z.,Di,Z.H.,Gong,W.,2015a.Evolution of the Yellow River Delta and its relationship with runoff and sediment load from 1983 to 2011.J.Hydrol.520,157-167.https://doi.org/10.1016/j.jhydrol.2014.09.038.
Kong,D.X.,Miao,C.Y.,Wu,J.W.,Duan,Q.Y.,Sun,Q.H.,Ye,A.Z.,Di,Z.H.,Gong,W.,2015b.The hydro-environmental response on the lower Yellow River to the water-sediment regulation scheme.Ecol.Eng.79,69-79.https://doi.org/10.1016/j.ecoleng.2015.03.009.
Li,G.Y.,Sheng,L.X.,2011.Model of water-sediment regulation in Yellow River and its effect.Sci.China Technol.Sci.54(4),924-930.https://doi.org/10.1007/s11431-011-4322-3.
Li,W.Y.,Gong,P.,2016.Continuous monitoring of coastline dynamics in western Florida with a 30-year time series of Landsat imagery.Rem.Sens.Environ.179,196-209.https://doi.org/10.1016/j.rse.2016.03.031.
Li,X.Y.,Chen,H.T.,Jiang,X.Y.,Yu,Z.G.,Yao,Q.Z.,2017.Impacts of human activities on nutrient transport in the Yellow River:The role of the watersediment regulation scheme.Sci.Total Environ.592,161-170.https://doi.org/10.1016/j.scitotenv.2017.03.098.
Liu,Y.X.,Huang,H.J.,Qiu,Z.F.,Fan,J.Y.,2013.Detectingcoastlinechangefrom satellite images based on beach slope estimation in a tidalflat.Int.J.Appl.Earth Obs.Geoinf.23,165-176.https://doi.org/10.1016/j.jag.2012.12.005.
McFeeters,S.K.,1996.The use of the normalized difference water index(NDWI)in the delineation of open water features.Int.J.Rem.Sens.17,1425-1432.https://doi.org/10.1080/01431169608948714.
Miao,C.Y.,Kong,D.X.,Wu,J.W.,Duan,Q.Y.,2016.Functional degradation of the water-sediment regulation scheme in the lower Yellow River:Spatial and temporal analyses.Sci.Total Environ.551-552,16-22.https://doi.org/10.1016/j.scitotenv.2016.02.006.
Milliman,J.D.,Meade,R.H.,1983.World-wide delivery of river sediment to the oceans.J.Geol.91(1),1-21.https://doi.org/10.1086/628741.
Ogilvie,A.,Belaud,G.,Delenne,C.,Bailly,J.S.,Bader,J.C.,Oleksiak,A.,Ferry,L.,Martin,D.,2015.Decadal monitoring of the Niger Inner Deltaflood dynamics using MODIS optical data.J.Hydrol.523,368-383.https://doi.org/10.1016/j.jhydrol.2015.01.036.
Pang,J.Z.,Si,S.H.,1979.Evolution of the Yellow River mouth:Historical shifts.Chin.J.Oceanol.Limnol.10(2),136-141(in Chinese).
Rahman,A.F.,Dragoni,D.,El-Masri,B.,2011.Response of the Sundarbans coastline to sea level rise and decreased sedimentflow:A remote sensing assessment.Rem.Sens.Environ.115(12),3121-3128.https://doi.org/10.1016/j.rse.2011.06.019.
Ran,L.,Lu,X.X.,Xin,Z.B.,Yang,X.K.,2013.Cumulative sediment trapping by reservoirsinlargeriverbasins:AcasestudyoftheYellowRiverBasin.Global Planet.Change 100,308-319.https://doi.org/10.1016/j.gloplacha.2012.11.001.
Volpe,V.,Silvestri,S.,Marani,M.,2011.Remote sensing retrieval of suspended sediment concentration in shallow waters.Rem.Sens.Environ.115(1),44-54.https://doi.org/10.1016/j.rse.2010.07.013.
Wang,H.J.,Yang,Z.S.,Bi,N.S.,Li,H.D.,2005.Rapid shifts of the river plume pathway off the Huanghe(Yellow)River mouth in response to water-sedimentregulation scheme in 2005.Chin.Sci.Bull.50,2878-2884.https://doi.org/10.1360/982005-1196.
Wang,H.J.,Wang,A.M.,Bi,N.S.,Zeng,X.M.,Xiao,H.H.,2014.Seasonal distribution of suspended sediment in the Bohai Sea,China.Continent.Shelf Res.90,17-32.https://doi.org/10.1016/j.csr.2014.03.006.
Wang,S.,Fu,B.,Liang,W.,Liu,Y.,Wang,Y.,2017.Driving forces of changes in the water and sediment relationship in the Yellow River.Sci.Total Environ.576,453-461.https://doi.org/10.1016/j.scitotenv.2016.10.124.
Wang,Y.,Ren,M.E.,Zhu,D.K.,1986.Sediment supply to the continental shelf by the major rivers of China.J.Geol.Soc.143(6),935-944.https://doi.org/10.1144/gsjgs.143.6.0935.
Wren,D.G.,Barkdoll,B.D.,Kuhnle,R.A.,Derrow,R.W.,2000.Field techniques for suspended-sediment measurement.J.Hydraul.Eng.126(2), 97-104. https://doi.org/10.1061/(ASCE)0733-9429(2000)126:2(97).
Wu,X.,Bi,N.S.,Yuan,P.,Li,S.,Wang,H.J.,2015.Sediment dispersal and accumulation off the present Huanghe(Yellow River)Delta as impacted by the water-sediment regulation scheme.Continent.Shelf Res.111(B),126-138.https://doi.org/10.1016/j.csr.2015.11.003.
Xia,X.H.,Dong,J.W.,Wang,M.H.,Xie,H.,Xia,N.,Li,H.S.,Zhang,X.T.,Mou,X.L.,Wen,J.J.,Bao,Y.M.,2016.Effect of water-sediment regulation of the Xiaolangdi Reservoir on the concentrations,characteristics,andfluxes of suspended sediment and organic carbon in the Yellow River.Sci.Total Environ.571,487-497.https://doi.org/10.1016/j.scitotenv.2016.07.015.
Xu,B.C.,Yang,D.S.,Burnett,W.C.,Ran,X.B.,Yu,Z.G.,Gao,M.S.,Diao,S.B.,Jiang,X.Y.,2016.Artificial water sediment regulation scheme influences morphology,hydrodynamics and nutrient behavior in the Yellow River Estuary.J.Hydrol.539,102-112.https://doi.org/10.1016/j.jhydrol.2016.05.024.
Xu,G.B.,Si,C.D.,2009.Effect of water and sediment regulation on lower Yellow River.Trans.Tianjin Univ.15(2),113-120.https://doi.org/10.1007/s12209-009-0020-7.
Xu,H.Q.,2006.Modification of normalised difference water index(NDWI)to enhance open water features in remotely sensed imagery.Int. J. Rem. Sens. 27(14), 3025-3033. https://doi.org/10.1080/01431160600589179.
Xu,J.X.,2003.Sedimentflux to the sea as influenced by changing human activities and precipitation:Example of the Yellow River,China.Environ.Manag.31(3),328-341.https://doi.org/10.1007/s00267-002-2828-y.
Yang,H.B.,Wang,Z.M.,Zhao,H.L.,Guo,Y.,2011.Water body extraction methods study based on RS and GIS.Procedia Environ.Sci.10(C),2619-2624.https://doi.org/10.1016/j.proenv.2011.09.407.
Yang,Z.F.,Sun,T.,Cui,B.S.,Chen,B.,Chen,G.Q.,2009.Environmentalflow requirements for integrated water resources allocation in the Yellow River Basin,China.Commun.Nonlinear Sci.Numer.Simulat.14(5),2469-2481.https://doi.org/10.1016/j.cnsns.2007.12.015.
Yang,Z.F.,Qin,Y.,Yang,W.,2013.Assessing and classifying plant-related ecological risk under water management scenarios in China's Yellow River Delta Wetlands.J.Environ.Manag.130,276-287.https://doi.org/10.1016/j.jenvman.2013.08.015.
Yu,L.S.,2002.The Huanghe(Yellow)River:A review of its development,characteristics,and future management issues.Continent.Shelf Res.22,389-403.https://doi.org/10.1016/S0278-4343(01)00088-7.
Zeng,X.M.,He,R.Y.,Xue,Z.,Wang,H.J.,Wang,Y.,Yao,Z.G.,Guan,W.B.,Warrillow,J.,2015.River-derived sediment suspension and transport in the Bohai,Yellow,andEastChinaSeas:Apreliminarymodelingstudy.Continent.Shelf Res.111(B),112-125.https://doi.org/10.1016/j.csr.2015.08.015.
Zhang,M.W.,Dong,Q.,Cui,T.W.,Xue,C.J.,Zhang,S.L.,2014.Suspended sediment monitoring and assessment for Yellow River estuary from Landsat TM and ETM+imagery.Rem.Sens.Environ.146,136-147.https://doi.org/10.1016/j.rse.2013.09.033.
Zhong,J.H.,Wen,Z.F.,Wang,G.M.,Wang,X.B.,Rao,M.Y.,Li,Y.,Ni,J.R.,Shen,X.R.,2003.Influences of the current breaking of the Yellow River on the anomalous vertical development and evolution of the river course.Geol.Rev.49(6),616-621(in Chinese).
Zhou,Y.Y.,Huang,H.Q.,Nanson,G.C.,Huang,C.,Liu,G.H.,2015.Progradation of the Yellow(Huanghe)River Delta in response to the implementation of a basin-scale water regulation program.Geomorphology 243,65-74.https://doi.org/10.1016/j.geomorph.2015.04.023.
 Water Science and Engineering2017年4期
- Water Science and Engineering的其它文章
- Preface for special section on flood modeling and resilience
- Fenton-like oxidation of azo dye in aqueous solution using magnetic Fe3O4-MnO2nanocomposites as catalysts
- Preparation of 2D square-like Bi2S3-BiOCl heterostructures withenhanced visible light-driven photocatalytic performance for dye pollutant degradation
- Effects of urban grass coverage on rainfall-induced runoff in Xi'an loess region in China
- Flood management of Dongting Lake after operation of Three Gorges Dam
- A distributed eco-hydrological model and its application