
Caffeic acid and protocatechuic acid modulate Nrf2 and inhibit Ehrlich ascites carcinomas in mice
2021-05-20 05:07:10VenugopalBovillaPreethiAnantharajuSireeshDornadulaPrashanthkumarVeereshMahadevaswamyKuruburuVidyaBettadaKunkaMohanramRamkumarSubbaRaoMadhunapantula
Venugopal R. Bovilla, Preethi G. Anantharaju, Sireesh Dornadula, Prashanthkumar M. Veeresh, Mahadevaswamy G. Kuruburu, Vidya G. Bettada, Kunka Mohanram Ramkumar?, SubbaRao V. Madhunapantula?
1Center of Excellence in Molecular Biology and Regenerative Medicine, Department of Biochemistry, JSS Medical College, JSS Academy of Higher Education & Research, Mysore - 570015, Karnataka, India
2SRM Research Institute, Department of Biotechnology, School of Bioengineering, SRM Institute of Science and Technology, Kattankulathur -603203, Tamil Nadu, India
ABSTRACT
KEYWORDS: Ehrlich ascites carcinomas; Nrf2; Protocatechuic acid; Caffeic acid; NQO1 activity
1. Introduction
Oxidative stress, caused by various reactive oxygen species (ROS),is a major contributor to cellular transformation in humans[1].Nuclear factor erythroid 2-related factor 2 (Nrf2) is one of the key regulators of cellular redox homeostasis and controls the expression of antioxidant genes NAD(P)H:quinone oxidoreductase 1 (NQO1),superoxide dismutase (SOD), catalase (CAT), and glutathione S-transferase (GST)[2]. Under normal physiological conditions,the activity of Nrf2 is controlled by its negative regulator Kelchlike ECH-associated protein-1 (Keap-1). Under oxidative stress conditions, Nrf2 is dissociated from Keap-1 and translocated into the nucleus where it binds to the DNA at antioxidant response elements (ARE). The binding of Nrf2 to ARE in turn triggers the expression of cytoprotective genes[3]. Hence the transcription factor Nrf2 and its target genes NQO1, SOD, CAT, hypoxia-inducible factor 1α (HIF1α), and heme oxygenase-1 (HO-1) help in controlling cellular oxidative stress. According to Cuadrado et al., these target genes regulate inflammation, redox status, energy metabolism,purine and pentose phosphate pathways, lipid metabolism, and proteostasis[4]. Mutations or polymorphisms in Nrf2 or Keap-1 are known to upregulate the expression of Nrf2, which in turn induces drug resistance in cancers[4]. Maintaining appropriate levels of Nrf2 is of utmost importance to decide the fate of cells.
According to Sandberg et al., low levels of activated Nrf2 in humans are associated with neurodegenerative diseases such as Parkinson’s, Alzheimer’s, and amyotrophic lateral sclerosis[5].Elevated Nrf2 activity protects cells against oxidative stress induced by environmental pollutants[3]. Activation of Nrf2 through phytochemicals such as sulforaphane, pterostilbene, and naringenin was shown to reduce various complications that occur in diseases caused by ROS[6].
A study by Nezu et al. showed that Nrf2 activation prevented the acute kidney injury in mice[7]. Further studies by Satta et al. and da Costa et al., have demonstrated that activation of Nrf2 and its target genes plays a critical role in reducing free radicals-induced cardiovascular disease[8,9]. Epidemiological studies have also shown that diets rich in antioxidants could prevent the oncogenic transformation of cells[10]. However, the molecular mechanisms regulated by these dietary antioxidants are poorly understood.
Plants are rich in secondary metabolites such as phenolic compounds and flavonoids[11]. Phenolic compounds are known to play a vital role in treating and preventing various diseases associated with oxidative stress such as cancer, diabetes, and cardiovascular complications[11]. Phenolic compounds range from low molecular weight to high molecular weight, as well as single aromatic compounds to large complex structures such as polyphenols[12].Many studies have reported the health beneficial roles of dietary phenols due to their inherent ability to act as an antioxidant, antiinflammatory, and anti-cancer agent. A study conducted by Gijsman demonstrated the involvement of phenolic compounds in the scavenging activity of free radicals[13]. Ruiz-Ruiz et al. have shown that the phenolic compounds present in honey exhibited good antiinflammatory activity in vivo[14]. Moreover, Alaklabi et al. reported a potent anticancer effect for phenolic compounds[15].
Among various simple phenolic compounds, benzoic acid (BA)and cinnamic acid (CA) are widely distributed and extensively investigated for structure-activity relationships and properties[16].These compounds have a characteristic carboxylic group and one or more hydroxyl or methoxyl groups attached to the benzene ring[10].Derivatives of BA and CA are commonly found in different parts of various fruits, seeds, and vegetables[17]. Among BA derivatives,gallic acid was studied extensively for antioxidant and antiinflammatory properties[18]. Anantharaju et al. demonstrated that BA and CA derivatives 3,4-dihydroxybenzoic acid (commonly known as protocatechuic acid-PA) and 3,4-dihydroxycinnamic acid (commonly known as caffeic acid-CaA) exhibited anticancer activity by inhibiting histone deacetylases[18]. CaA is one of the most abundant phenolic acids found in fruits[11]. Lin et al. showed that PA inhibited the metastatic ability of cancer cells by decreasing the levels of matrix metalloproteinase-9 and nuclear factor kappa beta via the downregulation of protein kinase C? (PKC?) and Ras/Akt signaling cascades[19]. Tanaka et al. reviewed the potential of PA in preventing the development of epithelial malignancy and cardiovascular diseases through its antioxidant activity[20].However, Nrf2 modulatory potential of phenolic compounds remains unclear. Therefore, in this study, the ability of phenolic compounds(CaA and PA) to activate Nrf2 was investigated using the Nrf2 complementation assay and real-time PCR. In addition, the ability of Nrf2-activating CaA and PA was evaluated for inhibiting the growth of Ehrlich ascites carcinomas (EAC) in mice.
2. Materials and methods
2.1. Cells and reagents
Cell lines HCT-116 (colorectal cancer cell line), T47D, MDA-MB-231 (breast cancer cell lines), A549 (lung cancer cell line) and MIN 6 (mouse pancreatic beta-cell line with very low basal Nrf2), were purchased from National Center for Cell Science, Pune, Maharashtra,India. BA, CA, PA, CaA, glucose-6-phosphate dehydrogenase(Cat#: 10165875001), nicotinamide adenine dinucleotide phosphate(Cat#: N5755), flavin adenine dinucleotide (Cat#: F6625), glucose 6-phosphate (Cat#: G7250), bovine serum albumin (Cat#: 05479),Nonidet P-40 (Cat#: 492016), pterostilbene (trans-3,5-dimethoxy-4-hydroxystilbene) (Cat#: P1499) and diallyl disulfide (4,5-dithia-1,7-octadiene) (Cat#: SMB00378) were procured from Sigma Chemical Company, St Louis, USA. Trizol (Cat#: 15596026; guanidinium isothiocyanate-phenol-chloroform mixture), quantitative real-time PCR reagents, SYBR Green (Cat#: F410L), and cDNA synthesis kit(Cat#: 4374966) were procured from Life Technologies, Carlsbad,USA. Primers were purchased from Sigma Chemical Company.3-(4,5-dimethylthiazole-2-yl)-2,5-diphenyl tetrazolium bromide(MTT) (Cat#: 58945), dimethyl sulfoxide (DMSO) (Cat#: 24075),Tween-20 (Cat#: 13435), and phosphate-buffered saline (PBS)(Cat#: 78529) were procured from Sisco Research Laboratories Chemicals, Mumbai, India. All cell culture plastics were from Techno Plastic Products Pvt Ltd, Bengaluru, Karnataka, India.Dulbecco’s Modified Eagle’s Medium with high glucose (Cat#:AL111), trypsin-2,2’,2”,2”’ (ethane-1,2-diyldinitrilo) tetraacetic acid(EDTA) (0.25%) (Cat#: T001), Dulbecco’s phosphate-buffered saline(Cat#: TL1006), and ciprofloxacin (Cat#: A032) were obtained from HiMedia Laboratories Pvt Ltd, Bengaluru, Karnataka, India.
2.2. Determination of ferric reducing antioxidant power(FRAP)
FRAP assay was performed according to Benzie & Strain[21].Briefly, FRAP reagent containing 2.5 mL of 10 mM 2,4,6-trypyridyl-s-triazine (heated at 50 ℃ for 5 min), 2.5 mL of 20 mM ferric chloride, and 25 mL of 300 mM acetate buffer (pH 3.6), was prepared freshly and kept at 37 ℃. A volume of 190 μL FRAP reagent was incubated with increasing concentrations (0.25, 0.50,2.00, and 4.00 mM) of BA, PA, CA, and CaA for 30 min in the dark and the developed blue color was read at 593 nm. Simultaneously, a ferrous sulphate standard (200 μM to 1 800 μM) was also prepared.The absorbance values were converted to FRAP units and the data were plotted against the concentration of phenolic acid.
2.3. Determination of 2,2-diphenyl-1-picrylhydrazyl(DPPH) radical scavenging activity
DPPH radical scavenging activity was measured according to Aksoy et al[22]. Briefly, 140 μL of DPPH solution (6.2 mg in 100 mL of 100% ethanol) was incubated with 20 μL of increasing concentrations (0.25, 0.50, 2.00, and 4.00 mM) of BA, PA, CA, and CaA, respectively for 30 min in the dark at room temperature, and the absorbance was measured at 536 nm. For the construction of a calibration curve, increasing concentrations of vitamin C (0.25-4.0 μM) was incubated with 140 μL of DPPH solution, and after 30 min,the absorbance at 536 nm was recorded. The results were expressed as % free radical scavenging activity as shown below.
% free radical scavenging activity = [(A-A)/A]×100
Where A= Absorbance of DPPH incubated with solvent, A=Absorbance of DPPH incubated with increasing concentrations of vitamin C or test compounds.
2.4. Cell viability assessment using MTT
MTT assay was performed according to Kumar et al[23]. Briefly, 1×10MIN6 or HCT-116 cells/well were plated in a 96 well plate, then incubated at 37 ℃ in a 5% COincubator until cells reached 60%-70% confluence. The exponentially growing cells were treated with 0.625, 1.25, 2.5 and 5.0 mM of BA, PA, CA, and CaA. MIN6 cells were exposed to treatment agents for 24 h and HCT-116 cells were treated with 0.062, 0.125, 0.25, 0.5, 1.0, 1.5, and 3.0 mM of PA, and CaA for 6 h and 9 h. The cell viability was assessed by the addition of 20 μL MTT (10 mg/mL) to each well. The cells were incubated for an additional 2 h, and the development of formazan crystals was monitored under a microscope. Once the crystal development was complete, the media were removed and the plates were washed once with PBS. Formazan crystals were solubilised by the addition of 100 μL of DMSO to each well. The plate was read in a plate reader at 590 nm. The percentage of cell viability was calculated by comparing the OD values with control using the formula: (OD/OD) ×100.
2.5. Measurement of NQO1 activity
NQO1 activity was measured according to Prochaska et al[24].Firstly, T47D, MDA-MB-231 (breast cancer), A549 (lung cancer)and HCT 116 (colorectal) cancer cells were scraped and washed using PBS. Then 200 μL lysis buffer containing (0.8%) Nonidet P-40 and 2 mM EDTA was added to the cell pellet and mixed well.The total protein content was estimated using the bicinchoninic acid protein estimation kit. Ten micrograms of total protein was incubated with 200 μL of NQO1 cocktail containing 25 mM Tris,0.067% bovine serum albumin, 0.01% Tween-20, 5.0 μM flavin adenine dinucleotide, 1.0 mM glucose 6-phosphate, 2 units/mL glucose 6-phosphate dehydrogenase, 0.3 mg/mL MTT, 3.0 μM nicotinamide adenine dinucleotide phosphate, 0.081% menadione,with and without 20 μM dicoumarol. The absorbance was read at 610 nm for 30 min at 1 min interval. Sample readings with an inhibitor were subtracted from the one without an inhibitor, and the OD value per minute/molar extinction coefficient of MTT was determined (11 300 M/cm), which subsequently was multiplied with a protein concentration of the sample to obtain mol units of NQO1.The NQO1 activity was normalized to the protein concentration and expressed as μmol/min/mg protein. Then Nrf2 activation potential of PA and CaA was tested by treating HCT-116 cell line, which has moderate NQO1 activity, with 250, 500, and 1 500 μM of PA and CaA for 6 h and 9 h followed by analyzing the lysates for NQO1 activity. BA and CA were not tested in HCT-116 cell line due to their(a) poor antioxidant potential when tested using FRAP and DPPH;and (b) toxicity at concentrations above 1.25 mM when tested against MIN6 cells.
2.6. Protein complementation assay
In order to determine the Nrf2 activation potential of phenolic compounds, a reporter complementation assay developed by Ramkumar et al. was used[25]. The transfection of the reporter system, which consists of the pcDNA split-Fluc reporter construct,was carried out using Lipofectamine 2000 (1:3 ratio between lipofectamine and split Fluc reporter plasmid) and 80% confluent MIN6 cells in a 12-well plate. After transfection, cells were incubated with 0.312 5, 0.625, and 1.25 mM of BA, CA, PA, CaA and positive control pterostilbene (10.0 μM) at 37 ℃ and 5% COfor 8 h. Subsequently, cell lysate was collected using ice-cold lysis buffer (Promega), vortexed for 1 min, then centrifuged at 10 000 rpm for 5 min at 4 ℃. The supernatant was collected and transferred to another vial and protein concentration determined by the Bradford method. To analyze luciferase activity, 20 μL of supernatant was mixed with 100 μL luciferase assay reagent (LAR-Ⅱ) substrate(Promega). Luciferase activity was analyzed by counting the number of photons produced for 10 s in a luminometer and expressed in relative luminescence units (RLU) and normalized to protein concentration.
2.7. ARE-Luciferase reporter gene assay
NQO1-ARE-Luc and GST-ARE-Luc reporter constructs were gifted by Donna D. Zhang (College of Pharmacy, University of Arizona, Tucson, AZ) to Dr. Ramkumar. These constructs were used for conducting cell-based reporter gene assay. Experimental procedures pertaining to the construction of these reporter plasmids were performed as described by Ramkumar et al[25]. ARE-Luc constructs (500 ng/well) were transiently transfected into MIN6 cells in 12-well plates using Lipofectamine-2000[25]. After six hours of transfection, the media were replaced with fresh media, and the cells were exposed to phenolic acids 0.312 5, 0.625, and 1.25 mM of BA, CA, PA, CaA and positive control pterostilbene (10 μM) for 24 h. The cell lysates were collected and the luminometric assay was carried out. The increase in the luciferase activity compared with control DMSO-treated cells was observed.
2.8. Analysis of the gene expression using RT-PCR
Total RNA from cultured cells was isolated using Trizol reagent.The quality of isolated RNA was checked using 1% bleach gel by measuring the ratio between 28S and 18S bands. The quality of isolated RNA was rated good if the ratio between 28S and 18S bands was 2:1. In addition, the purity of RNA was also checked by measuring the 260/280 ratio in a nanodrop spectrophotometer(DeNovix, Wilmington, DE, USA). Complementary DNA (cDNA)was prepared by reverse transcription reaction using High-Capacity cDNA Reverse Transcription Kit, following manufacturer’s instructions in a final volume of 20 μL containing 1 000 ng of total RNA, 100 ng of random hexamers, 2 μL reverse transcription buffer, 2.5 mM MgCl, 1 mM dNTP, 20U of SuperScript reverse transcriptase, and nuclease-free water.
Quantification of human Nrf2 and NQO1 was performed by using a commercially available Kit following manufacturer’s instructions.Briefly, the reaction mixture (in a total volume of 20 μL), containing 50 ng of template cDNA and primers was prepared in each tube. The samples were analyzed in duplicates to determine the reproducibility.Primers listed in Table 1 were used for measuring the expression of Nrf2, Keap-1, and Nrf2-target genes NQO1, GCLC, GCLM, HO-1,and HIF-1α. GAPDH was used as an internal control.
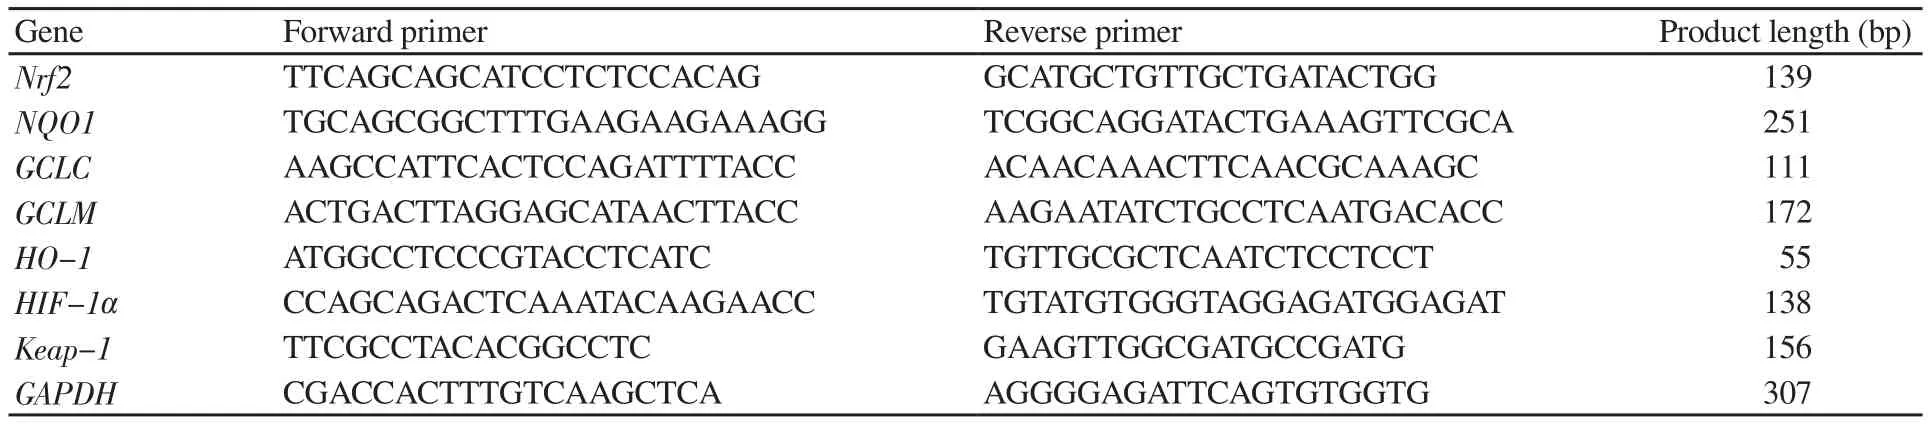
Table 1. Details of primer sequences and product length[26-30].
The RT-PCR reaction mixture contained (a) SYBR green dye -10 μL; (b) forward and reverse primers for each target gene - 0.2 μM each; (c) cDNA template - 50 ng and (d) nuclease-free water.The primer sequences were selected based on prior publications.No template control containing all except cDNA template was also analyzed to determine whether the mixture forms any primer dimers and also to confirm the absence of contamination.
RT-PCR experiment was performed using the Qiagen Rotor Gene-Q (Germantown, MD, USA) and the relative fold change(Fold change due to treatment =2) determined using the method described by Livak et al[31].
2.9. Evaluation of the efficacy of PA and CaA against EAC cell growth in mice
Six- to eight- weeks old female Swiss albino mice were procured from a Committee for the Purpose of Control and Supervision of Experiments on Animals approved breeder (Biogen Laboratory Animal Facility, Bengaluru, Karnataka). The mice were housed at the quarantine facility of JSS College of Pharmacy, Mysuru,Karnataka, India. Mice were provided with adequate food and water and kept under normal temperature (23 ± 2) ℃ with a 12 h light/dark cycle as per the guidelines. After quarantine, thirty-six mice weighing around 25-28 g were divided into 6 groups (n=6 mice in each group). GroupⅠreceived 50% DMSO in PBS as the vehicle control group. Groups Ⅱ and Ⅲ were treated with PA at a dose of 10 mg/kg and 20 mg/kg body weight, respectively. Groups Ⅳ andⅤ were treated with CaA at a dose of 10 mg/kg and 20 mg/kg,respectively. Group Ⅵ received diallyl disulfide (DADS) 50 mg/kg body weight (as positive control). PA, CaA, and DADS were dissolved in 50% DMSO. Prior to induction of EAC, mice were injected intraperitoneally (50 μL) with two doses (every alternate day) of each compound (Groups Ⅱ to Ⅵ) or vehicle (GroupⅠ)(Supplementary Figure 1). Tumor cells were collected from EAC bearing mice and diluted with PBS for measuring viable cells using Trypan blue exclusion method. The mice were injected once with 1 ×10viable cells intraperitoneally on day-3 to develop a liquid tumor.The treatment with various compounds continued for 18 d (9 times)by injecting the drugs on alternate days. Bodyweight was recorded every other day, and average body weight gain (an indicator of tumor growth due to increase in tumor cell number as well as peritoneal fluid) compared with untreated control was obtained[32]. On the 15th day (from the day of EAC injection), mice were sacrificed by carbon dioxide asphyxiation followed by cervical dislocation and the ascites were collected. In addition, the blood vessel density in the skin layer covering the peritoneal cavity was photographed to determine the effect of compound administration on angiogenesis[33].
2.10. Statistical analysis
To determine the significance between groups, a simple student’s t-test was carried out. Moreover, to determine the significance among multiple groups, one-way analysis of variance (ANOVA)with Tukey’s post hoc test was performed. P values < 0.05 were considered significant. All the statistical analyses were carried out using GraphPad Prism Version 5.0. from GraphPad Software, Inc.USA.
2.11. Ethical statement
Animal study was carried out after receiving the approval from the Institutional Animal Ethics Committee, JSS College of Pharmacy(208/2016), Mysuru. The animal experiments were conducted according to the guidelines established by Committee for the Purpose of Control and Supervision of Experiments on Animals,Ministry of Fisheries, Animal Husbandry and Dairying Department of Animal Husbandry and Dairying, Government of India.
3. Results
3.1. PA and CaA exhibited moderate antioxidant activity
PA and CaA showed a significant increase in the FRAP assay with increasing concentrations (Figure 1B). In contrast, BA and CA had minimal effect on ferric (Fe) ion reduction power (Figure 1A).Similarly, a dose-dependent increase in DPPH radical scavenging potential was also observed with PA and CaA (Figure 1D). NoDPPH radical scavenging activity was exhibited by BA even at the highest concentration tested in this experiment (Figure 1C). CA demonstrated a very low DPPH radical scavenging activity (8.2% inhibition) even at 4.0 mM concentration (Figure 1C).
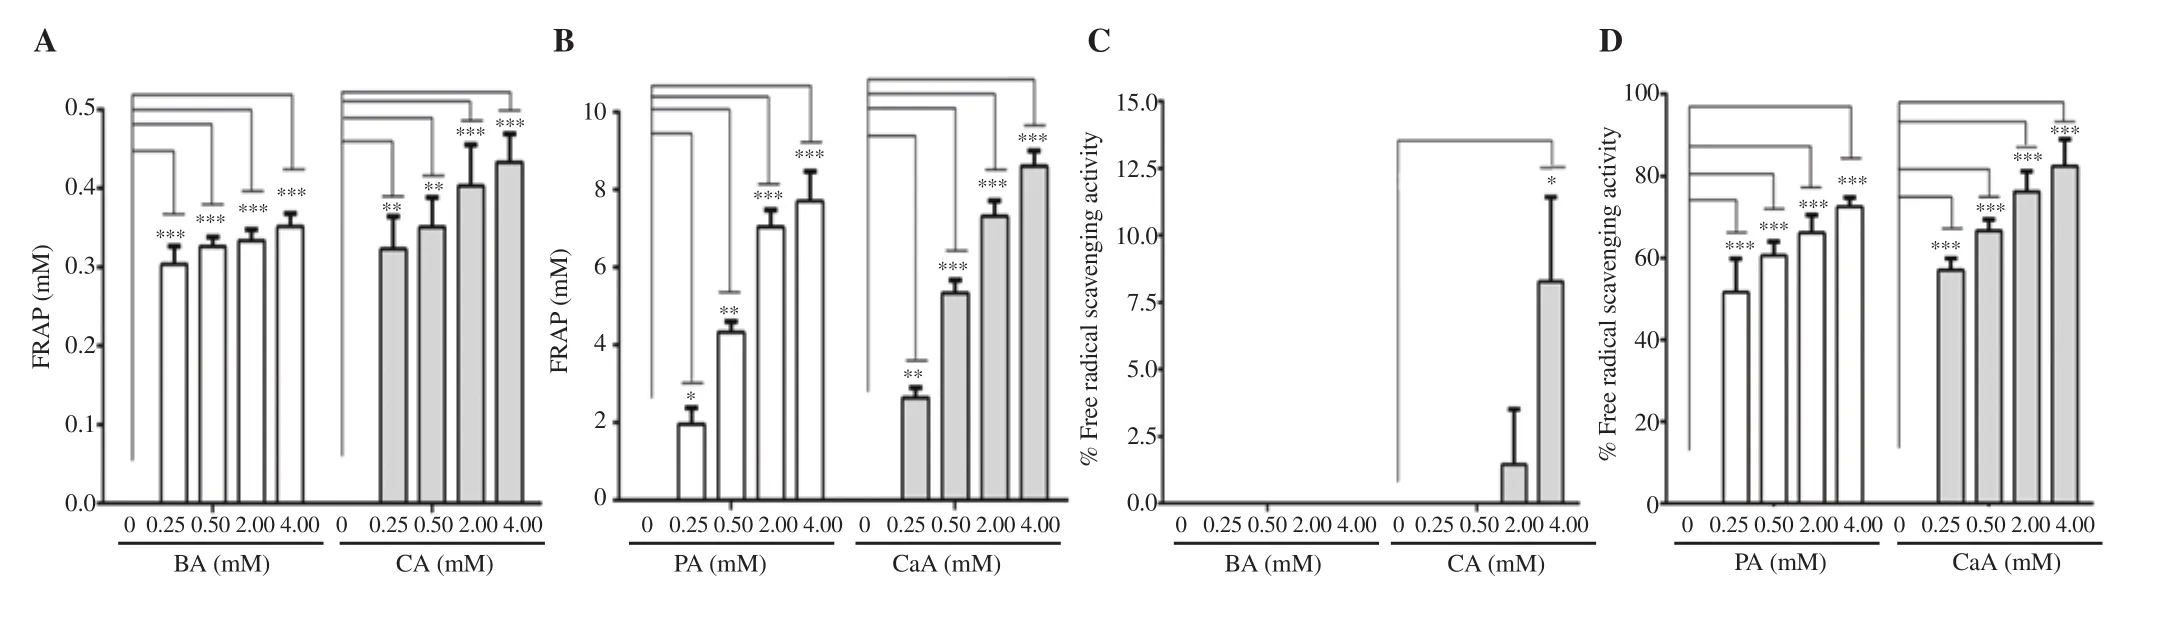
Figure 1. Antioxidant potential of BA, CA, PA and CaA by FRAP (A-B) and DPPH assays (C-D). The data represent the average of two independent experiments with at least 3 replicates and are expressed as mean ± SD. *P<0.05, **P<0.01, ***P<0.001, compared with the control group. BA: benzoic acid; CA:cinnamic acid; PA: protocatechuic acid; CaA: caffeic acid; FRAP: ferric reducing antioxidant power (mM ferrous sulfate equivalent).
3.2. BA and PA exhibited better Nrf2 activation potential compared with CA and CaA
The cytotoxic potential of phenolic compounds against MIN6 cells was determined. The results revealed that both BA and CA produced a significant ~ 40% to 50% decrease in cell viability at 5.0 mM concentration after 24 h treatment (Figure 2A). However, PA,a known BA derivative, was less cytotoxic to MIN6 cells even at 5.0 mM (Figure 2B). CaA, a known CA derivative, produced about 25% cell death at the highest concentration (Figure 2B). Hence,subsequent luciferase complementation reporter assays were carried out with concentrations below 5 mM of each phenolic acid (Figure 3).
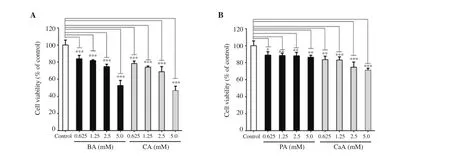
Figure 2. Cytotoxicity assessment of BA, CA (A), PA and CaA (B). The data represent the average of 3 independent experiments with at least 2 replicates and are expressed as mean ± SD. *P<0.05, **P<0.01, ***P<0.001, compared with the control group.
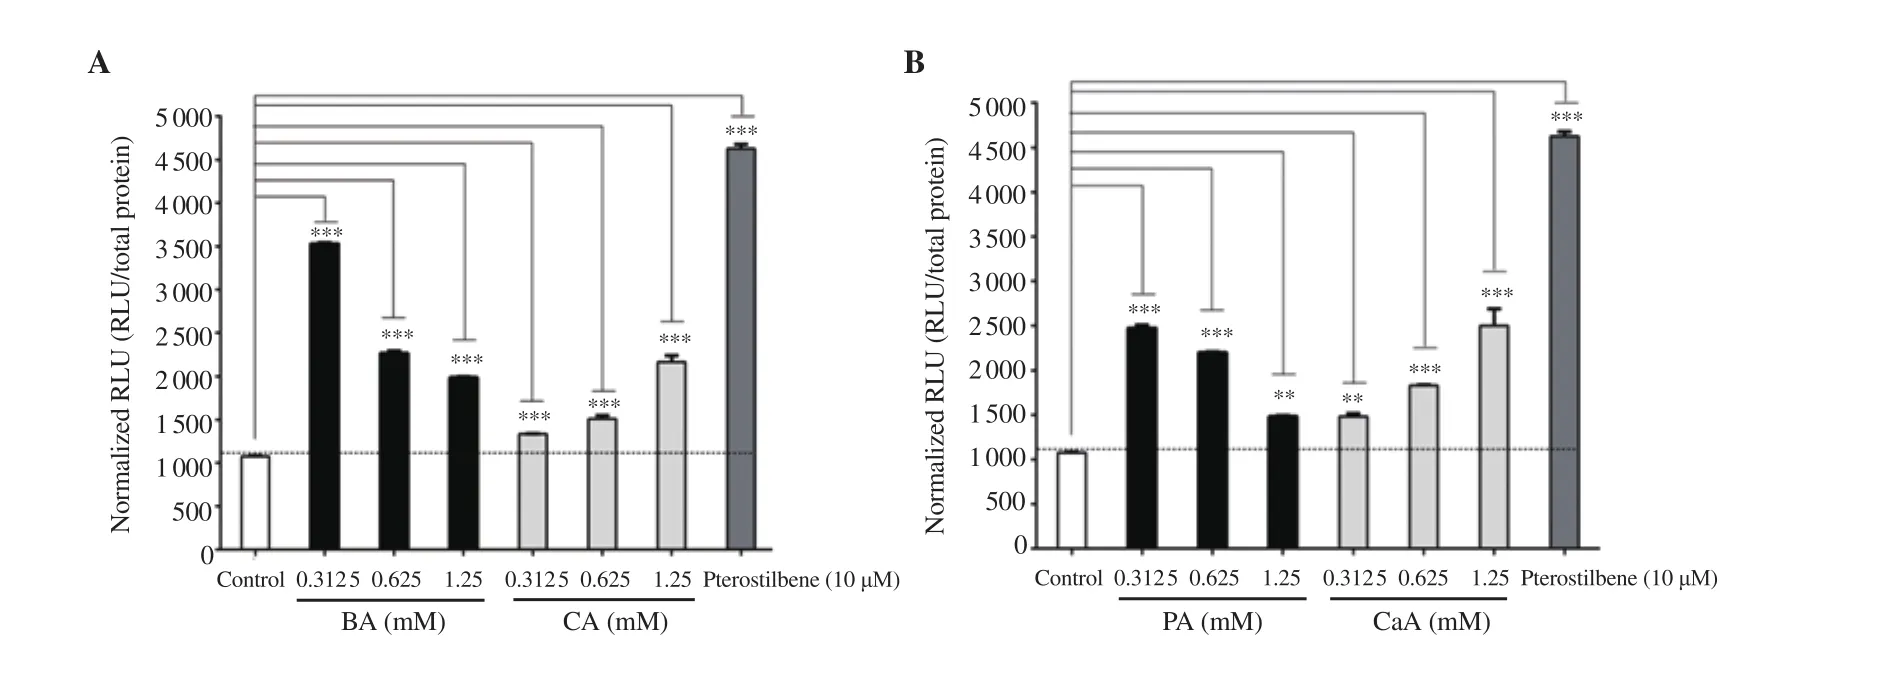
Figure 3. Nrf2 activation potential of BA, CA (A), PA and CaA (B). Phenolic compounds BA, CA, PA, and CaA were tested for their ability to activate Nrf2 using a split luciferase complementation assay system. The data are expressed as mean ± SD. **P<0.01, ***P<0.001, compared with the control group.
The Nrf2 activation potential of BA, PA, CA, and CaA was assessed using a stable split-Fluc-Nrf2 transfected MIN6 cell line. A dose-dependent decrease in RLU was observed with increasing BA concentration (Figure 3A). However, in contrast to BA, CA increased RLU dose-dependently (Figure 3A). Pterostilbene at a dose of 10 μM (positive control) produced more RLU compared with BA and CA (Figure 3A). PA and CaA also exhibited similar RLU pattern as in BA and CA (Figure 3B). Moreover, pterostilbene produced more luciferase activity compared with PA and CaA (Figure 3B). It can be concluded that BA and CA, and their derivatives PA and CaA exhibited Nrf2 activation potential with varied efficacy.
3.3. Nrf2 activating phenolic compounds increased the expression of Nrf2-target genes NQO1 and GST
The ability of BA, CA, PA, and CaA to induce the expression of Nrf2-target genes NQO1 and GST was studied using MIN6 cells transfected with hNQO1-ARE-Luc and hGST-ARE-Luc reporters.Similar to Nrf2 activation, a lower concentration of BA produced maximal NQO1 activation compared with a higher concentration of BA and the control cells transfected with empty plasmid (Figure 4A). A 5-, 3.5-, and 3-fold activation of NQO1 was observed in cells treated with 0.312 5, 0.625, and 1.25 mM of BA, respectively. Cells treated with PA also showed a similar pattern to BA (Figure 4A and 4B). Unlike BA, CA showed a much lower NQO1 activation at all the concentrations tested (Figure 4A). CaA also showed 2.20-,3.15-, 2.91-fold activation of NQO1 at 0.312 5, 0.625 and 1.25 mM concentrations, respectively (Figure 4B). Pterostilbene exhibited maximal NQO1 activation (Figures 4A and 4B).
Similar to the NQO1 reporter assay, the GST activation potential of phenolic compounds was studied using a GST-ARE-Luc reporter system. Cells treated with 0.312 5, 0.625, and 1.25 mM of BA exhibited activation of 2.8-, 1.8-, and 1.5-fold (compared with control cells), respectively (Figure 4C). PA also showed a similar pattern of response with a 1.7-, 1.4-, and 1.2-fold increase in GST activation (compared with control cells) at 0.312 5, 0.625, and 1.25 mM, respectively (Figure 4D). CA and its derivative CaA showed minimal activation of GST (Figures 4C and 4D). BA showed better GST activation potential compared with other compounds.Pterostilbene exhibited maximal activation of GST (Figures 4C and 4D).
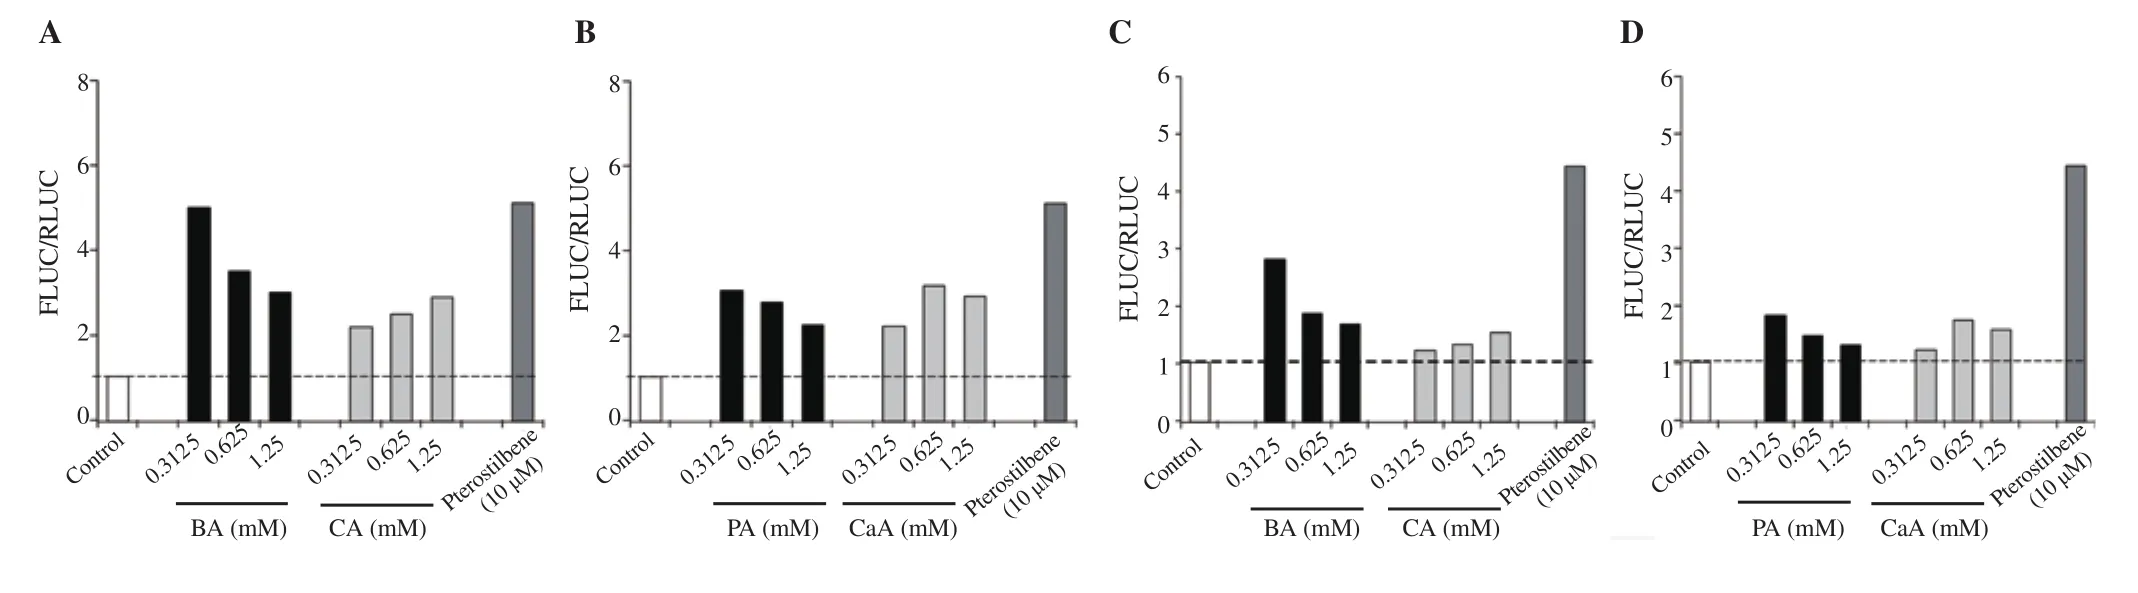
Figure 4. Nrf2 activation potential assessment of BA, CA, PA and CaA using NQO1 (A & B) and GST (C & D) reporter systems compared with the control group. The data represent the analysis of a single experiment with 2 replicates.
3.4. PA and CaA induced NQO1 activity in HCT-116 cells
HCT-116 is a colorectal carcinoma cell line with moderate Nrf2 activity (in terms of NQO1 enzyme) compared with breast cancer cell lines T47D and MDA-MB-231 (low NQO1 activity); and lung cancer cell line A549 (high NQO1 activity) (Supplementary Figure 2).
Treatment of HCT-116 cells with PA induced NQO1 activity at 6 h and 9 h with a varied response at different doses (Figure 5).At 6 h, NQO1 activity was markedly increased only at 1 500 μM while about 1.77-, and 2.5-fold increases in NQO1 activity were observed respectively at 250 μM and 500 μM concentration of PA at 9 h. However, at 1 500 μM, a significant decrease in NQO1 activity was noticed (Figure 5). In contrast, CaA decreased NQO1 activity significantly at all concentrations at 6 h while increasing the activity at 1 500 μM at 9 h (Figure 5).
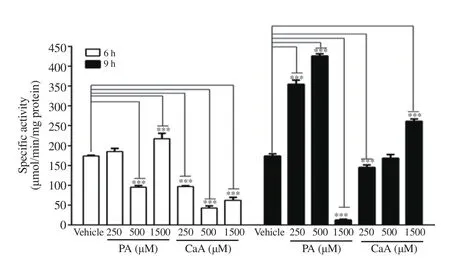
Figure 5. NQO1 activity in HCT-116 cells treated with PA and CaA. The data represent the average of two independent experiments with at least 3 replicates and are expressed as mean ± SD. ***P<0.001, compared with vehicle.
3.5. CaA effectively induced the expression of HO-1, GCLC and GCLM in HCT-116 cells
The effect of PA and CaA on the expression of Nrf2 and Keap-1,and Nrf2 target genes NQO1, GCLC, GCLM, HIF-1α, and HO-1 were studied using real-time PCR by treating HCT-116 cells with 1 500 μM PA and CaA for 6 h and 9 h. CaA and PA at 1 500 μM concentration did not exhibit any cytotoxicity at 6 h and 9 h(Supplementary Figure 3). There were no significant differences in the Nrf2, NQO1, HIF-1α, and Keap-1 expression in HCT-116 cells following the treatment with CaA and PA (Figure 6 and Supplementary Figure 4). However, CaA and PA induced a significant increase in the expression of GCLC, GCLM, and HO-1 compared with untreated control. Interestingly, HO-1 expression was elevated more significantly compared with other genes. Treatment with CaA increased the expression of HO-1 more than PA.
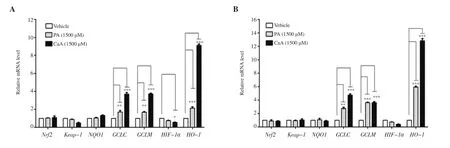
Figure 6. Expression of Keap-1, Nrf2 and its target genes (NQO1, GCLC, GCLM, HIF-1α, and HO-1) in HCT-116 cells treated with PA and CaA for 6 (A) and 9 h (B). The data represent the average of two independent experiments with at least 2 replicates and expressed as mean ± SD. *P<0.05, **P<0.01, ***P<0.001,compared with the control group.
3.6. PA and CaA suppressed the proliferation of EAC cells in mice
The effect of PA and CaA on inhibition of tumor cell growth in the peritoneal cavity of mice was assessed. CaA at a dose of 20 mg/kg body weight showed better tumor growth inhibition as evidenced by an about 34% decrease in body weight among treatment groups(Figure 7A), the effect of which was similar to that of positive control DADS with a ~41% decrease in body weight compared with untreated mice (Figure 7A).
3.7. PA and CaA inhibited angiogenesis in the peritoneum of EAC bearing mice
To evaluate the anti-angiogenic ability of PA and CaA, the peritoneum of EAC bearing mice was examined and photographed.PA and CaA reduced the number of vessels in a dose-dependent manner, showing their prominent inhibitory effect on angiogenesis.CaA was more potent with higher inhibition (Figures 7B and 7C).DADS suppressed the angiogenesis more efficiently than PA and CaA (Figures 7B and 7C).
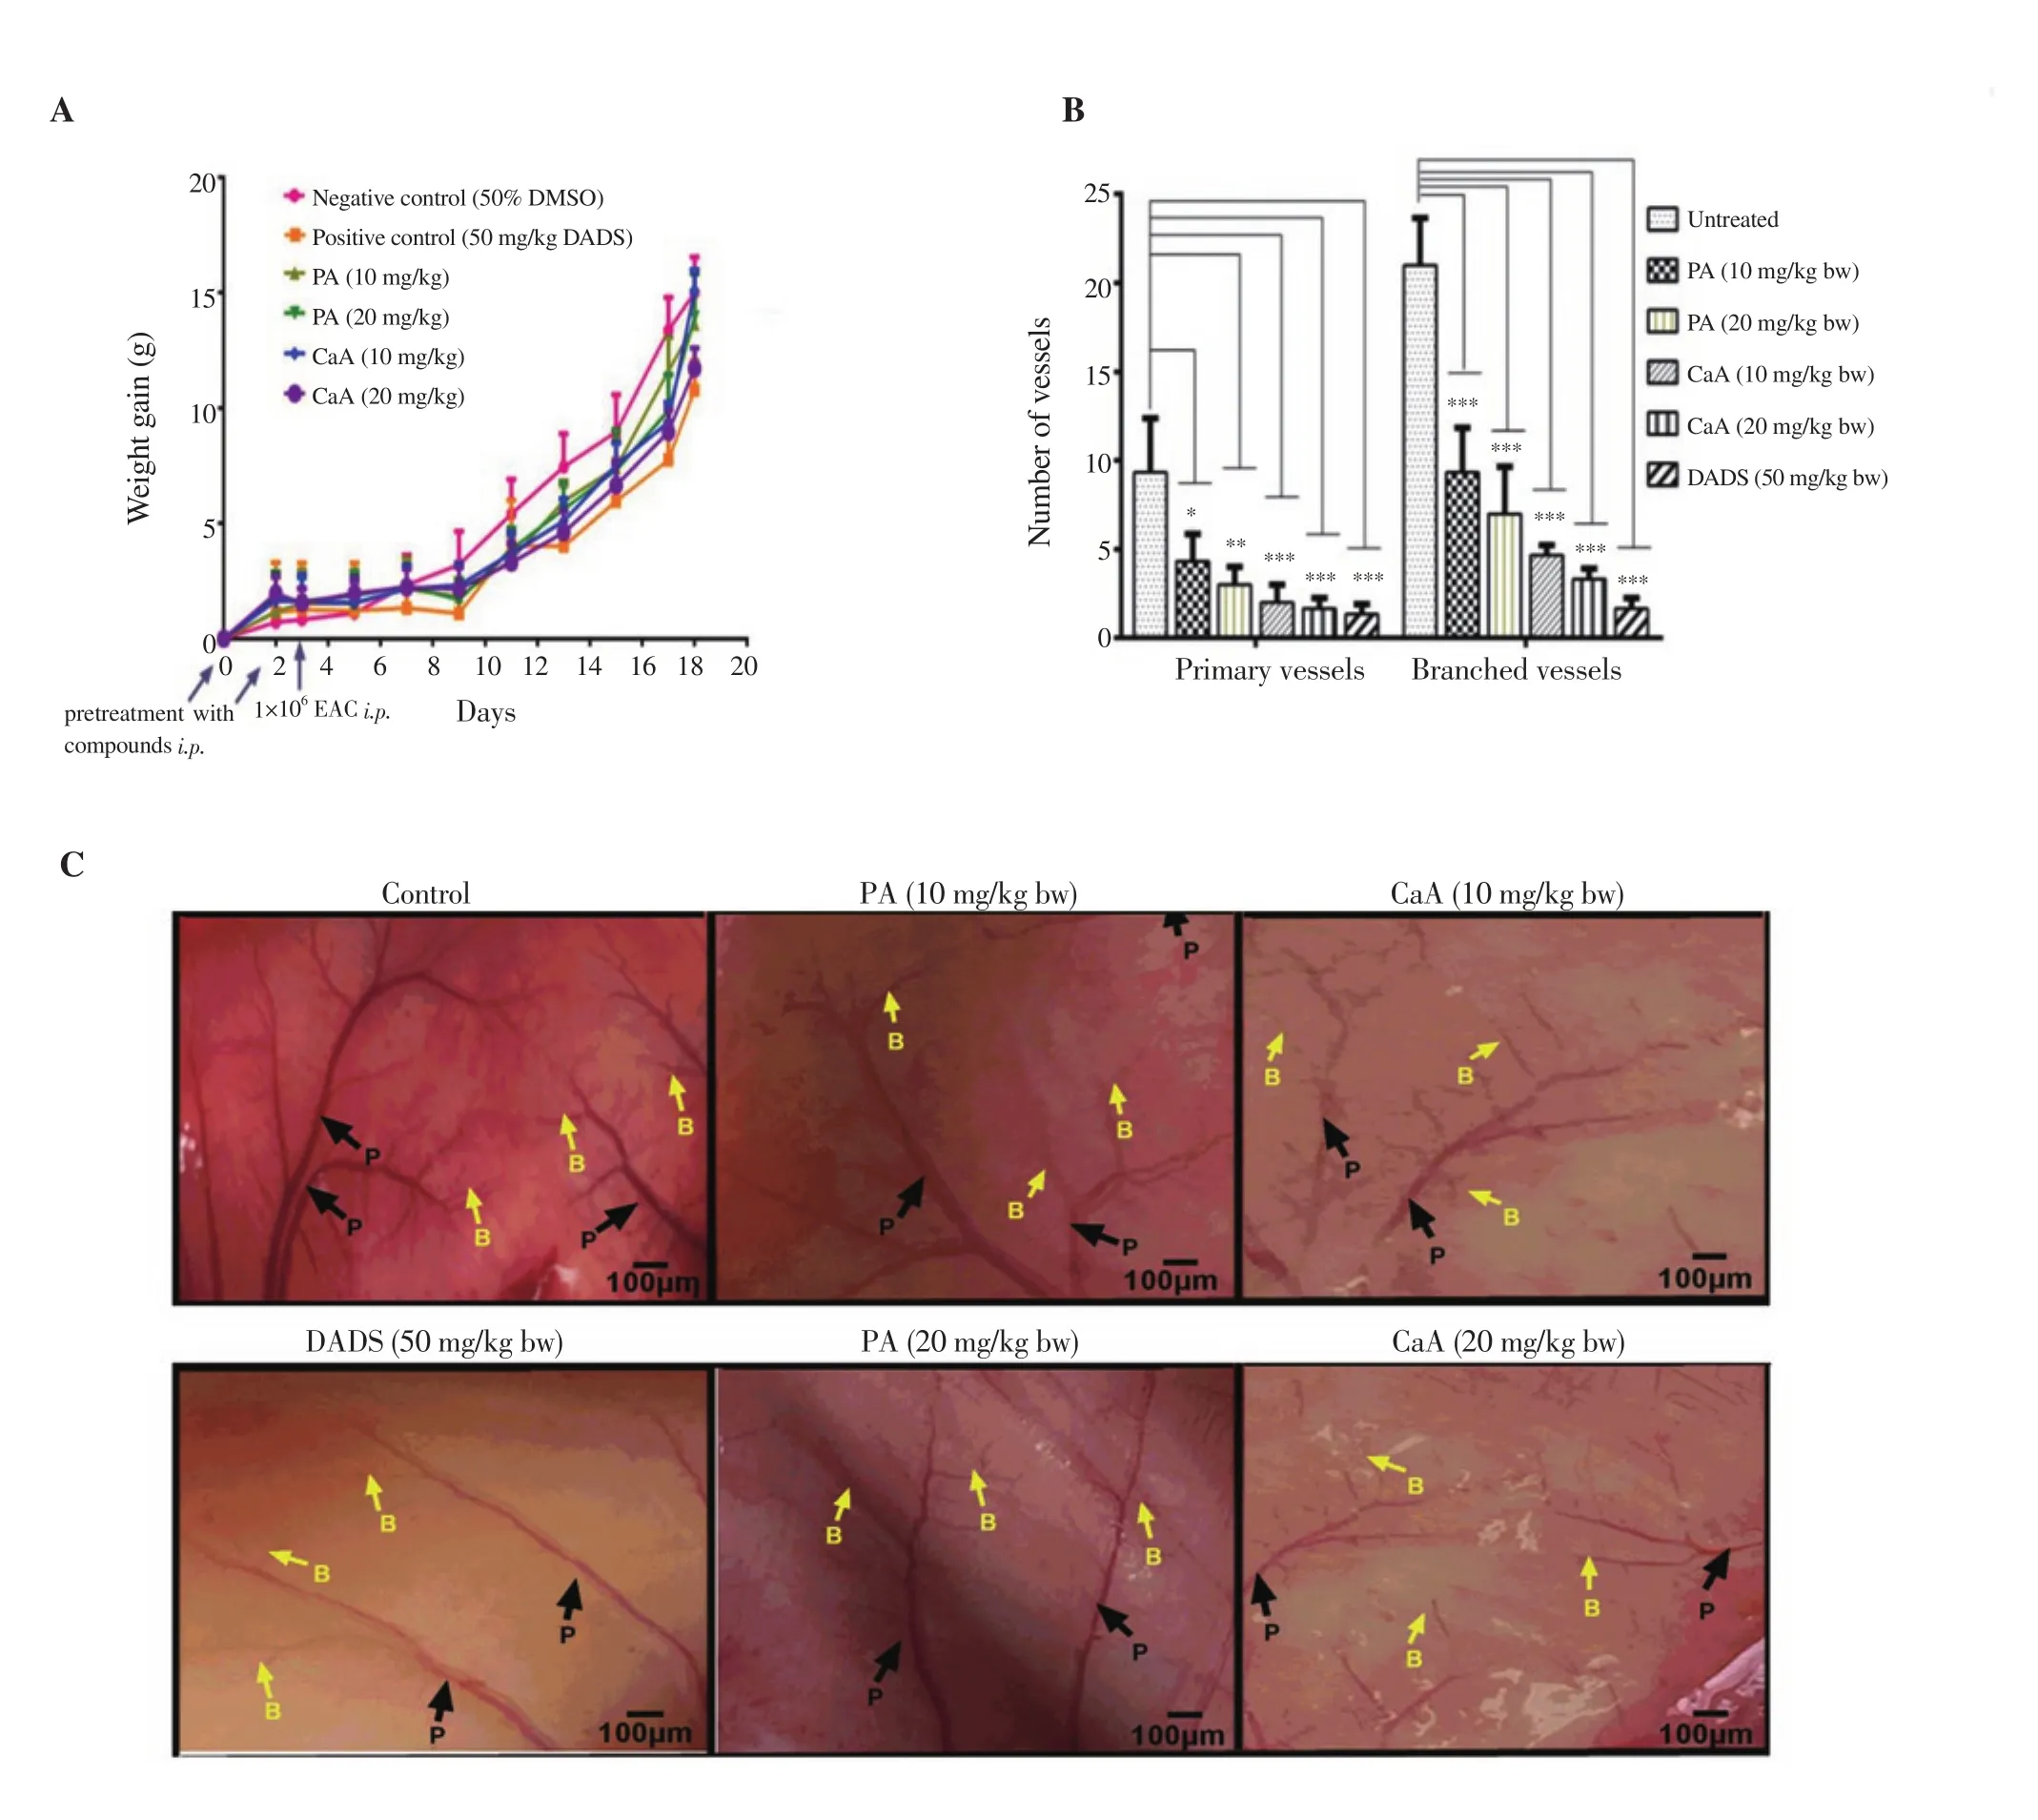
Figure 7. Inhibition of tumor cell growth (A) in the peritoneum and the formation of new blood vessels (B and C) in EAC bearing mice treated with PA and CaA (4× magnification). Swiss albino mice (n=6) bearing EAC cells in the peritoneum were treated with PA, CaA, and DADS for 18 d. *P<0.05, **P<0.01,***P<0.001, compared with the untreated group. P: primary vessels; B: branched vessels.
4. Discussion
Prevention of diseases including cancer through nutrition is widely studied and attributed to the presence of various antioxidant phytochemicals in diet[34]. For instance, in a recent study, Senger et al. showed that ancient foods rich in aryl catechols effectively increased the Nrf2 defense system, thereby protecting cells from various diseases induced by oxidative stress[35]. The protective effects of diets and dietary sources rich in secondary metabolites are primarily attributed to the presence of vitamins, minerals, and phenolic compounds ferulic acid, gallic acid and CaA[36]. Phenolic compounds exert their function by promoting a set of signaling cascades that inhibit the rapid proliferation of cancer cells and mitigate oxidative stress[10,34]. Phenolic compounds substituted with more number of hydroxylic groups are reported to exhibit better antioxidant and anti-cancer properties compared with the ones with no hydroxylic group substitution or -OCH3 derivatization[10]. A study by Natella et al. demonstrated that CA are more potent than BA in exhibiting antioxidant activity[37]. Overall, CA with more number of hydroxylic groups show better antioxidant potential compared with BA. Our results also revealed that hydroxylic groups showed an increase in free radical scavenging activity.
Molecularly, phenolic compounds and their derivatives are known to promote Nrf2 expression and activity in a dose-dependent and time-dependent fashion. Resveratrol and its dimethoxy derivative pterostilbene are known to upregulate Nrf2 and thereby mitigate diabetes[38]. Since Nrf2 is a master regulator of oxidative stress in cells, controlling its expression plays an important role in regulating various diseases[6]. Rajappa et al. revealed that naringenin reduced diabetes in vitro and in vivo via promoting Nrf2[39]. Similarly, Yeh and Yen demonstrated that gallic acid has elevated the Nrf2 nuclear accumulation, thereby promoting phase-Ⅱ enzyme P-form phenol sulfotransferase expression to protect cells from oxidative stress[40].Many other studies have also provided pieces of evidence about the ability of phenolic acids to protect cells from oxidative damage[34].Similar to these studies, the results of the current study also provided a mechanistic basis for cytoprotection. PA and CaA protected MIN6 and HCT-116 cells by elevating Nrf2 target genes activity(NQO1 activity) and/or the expression of HO-1, GCLC, and GCLM.Martinez-Huelamo et al. also indicated that polyphenols have the capability to induce antioxidant defense mechanisms through the activation of Nrf2[41].
Administration of phenolic compounds, in particular, CA and its derivatives was demonstrated to inhibit the growth of tumors in preclinical mouse models[42]. Furthermore, phenolic compounds obtained from several natural sources have also been used as adjunct therapeutics to protect from the toxic side effects of anticancer agents as well as radiation[43]. In addition, polyphenols were shown to boost the immune system, thereby acting in synergism with anticancer agents to retard various tumors[44]. In this study, we have demonstrated that intraperitoneal administration of phenolic compounds CaA and PA decreased body weight compared with control mice. Reduction in the tumor cells could be due to reduced supply of nutrients as there was a significant decrease in blood vessels upon treatment with CaA and PA. Consistent with this result,many prior studies have demonstrated the anti-angiogenic potential of phenolic compounds isolated from natural sources[45]. Therefore,we conclude that the anti-tumor properties of CaA and PA could be mediated at least in part through angiogenesis inhibition. Even though current study reported the activation of antioxidant genes regulated by Nrf2 in cell-based systems using reporter assays, further studies are warranted to measure the expression and activity of these proteins using Western blotting and enzyme assays. Similarly, the current study lacks the results pertaining to the efficacy of CaA and PA on tumor cells migration and cell cycle progression. Addition of these results helps in determining the efficacy of these compounds on controlling metastatic spread of tumor cells. Future studies should also test whether these compounds could be combined with other pharmacological agents for inhibiting tumor growth in a synergistic fashion. Moreover, the ability of PA and CaA for inhibiting solid tumors growth and metastasis should be studied as the majority of cancer-related deaths are due to solid tumors and associated metastatic spread.
In conclusion, PA and CaA showed antioxidant activity and activated Nrf2. Moreover, both PA and CaA inhibited EAC cell growth by suppressing angiogenesis with CaA slightly potent than PA. Therefore, PA and CaA may be used as a potent antioxidant and antitumor agent, which needs to be further explored in future studies.
Conflict of interest statement
We declare that there is no conflict of interest.
Acknowledgments
Authors would like to acknowledge (a) the infrastructure support provided by Department of Biochemistry; (b) the laboratory facilities provided by CEMR laboratory (DST-FIST supported center), JSS Academy of Higher Education & Research, Mysore,Karnataka, India. Mr. Venugopal R. Bovilla and Mahadevaswamy G. Kuruburu would like to thank Indian Council of Medical Research, Government of India, for Senior Research Fellowship(Fellowship sanction no:3/2/2/5/2018/online Onco Fship/NCD-III and no:3/2/2/105/2019/NCD-III).
Authors’ contributions
VRB carried out most of the experiments, and prepared the draft manuscript. PGA, SD, PMV, MGK, and VGB contributed partly in the experimental design and execution. KMR and SVM have analyzed the data and edited the manuscript. All authors have approved the article and accepted to communicate to the journal.
 Asian Pacific Journal of Tropical Biomedicine2021年6期
- Asian Pacific Journal of Tropical Biomedicine的其它文章
- Total flavonoids from Saussurea involucrata attenuate inflammation in lipopolysaccharide-stimulated RAW264.7 macrophages via modulating p65, c-Jun,and IRF3 signaling pathways
- Immunostimulatory effect of ethanol extract of Chondracanthus tenellus in RAW 264.7 macrophages in vitro
- Ginseng ameliorates pulmonary toxicity induced by silicon dioxide nanoparticles in rats
- Potential of polyphenols in curbing quorum sensing and biofilm formation in Gramnegative pathogens