Preparation and optoelectrical performance of transparent conducting titanium-magnesium codoped zinc oxide thin films
2021-10-22 02:11:54ZHONGZhiyouTIANYuLONGHaoCHENShoubuYANGChunyongCollegeofElectronicInformationEngineeringSouthCentralUniversityforNationalitiesWuhan430074ChinaHubeiKeyLaboratoryofIntelligentWirelessCommunicationsSouthCentralUniversityforNa
ZHONG Zhiyou, TIAN Yu, LONG Hao, CHEN Shoubu,YANG Chunyong( College of Electronic Information Engineering, South-Central University for Nationalities, Wuhan 430074, China;2 Hubei Key Laboratory of Intelligent Wireless Communications, South-Central University for Nationalities, Wuhan 430074, China)
Abstract The titanium-magnesium codoped zinc oxide (TMZO) transparent conductive oxide (TCO) thin films were deposited by magnetron sputtering technique.The effect of gas pressure on the optical and electrical performance of the thin films was investigated by ultraviolet-visible spectrometer, four-point probe and optical characterization methods.The results show that all the deposited films possess the normal dispersion characteristics in the visible region, and the refractive index dispersion curves of the thin films obey the single oscillator model.The gas pressure significantly affects the optoelectrical performance of the deposited films.When the gas pressure is 0.6 Pa, the TMZO thin film exhibits the best optoelectrical performance, with the lowest resistivity of 1.60×10⁻² Ω·cm, the highest average transmittance in the visible range of 84.25 % and the maximum figure of merit of 3.65×10² Ω-1·cm-1.
Keywords transparent conductive oxide; doped zinc oxide; thin film; optoelectronic performance
Research on transparent conductive oxide (TCO) thin films has been quite emphasized in the recent years, largely due to an increasing demand for optoelectronic devices such as light-emitting diodes[1-4], solar cells[5-7], flat-panel displays[8], thin-film transistors[9]and sensors[10-11].Among the different materials belonging to TCO, zinc oxide (ZnO) is a promising alternative to tin-doped indium oxide (ITO) in TCO applications, due to its low cost, nontoxicity and high electro-chemical stability[12-15].ZnO is an n-type semiconductor with wide direct band gap of 3.27 eV and large exciton binding energy of 60 meV at room temperature (RT).The electrical and optical properties of ZnO can be changed by doping conditions with impurities.The dopants that have been used for the ZnO-based binary TCO thin films are Ga, Al, Ti, B, Zr, In, Y, Sc, V, Mg, Ge, Mo, Mn and Hf[16-24].In order to further improve the physical and chemical properties of ZnO-based TCO thin films, the codoping with two elements such as Al-Ga, Ga-Ti, Sb-Al, Mg-Ga and Ti-Al were used[25-29].Up to now, however, many previous studies mainly focus on the investigation of the structural and electrical properties of the codoped ZnO thin films.Few reports have been devoted to the optical constants and its dispersion behaviour of the codoped ZnO thin films.In this paper, titanium-magnesium codoped ZnO (TMZO) TCO thin films were prepared at different gas pressures.The optical and electrical characteristics of the deposited films were studied by ultraviolet-visible spectrometer, four-point probe and optical characterization methods.The effect of gas pressure on optoelectrical properties was systematically investigated.
1 Experiment
The TMZO ceramic target were prepared by mixing TiO2(99.99 %), MgO (99.99 %) and ZnO (99.99 %) powders.The contents of TiO2, MgO and ZnO are 2 wt%, 2 wt% and 96 wt% in the TMZO target, respectively.The TMZO thin films were deposited onto the cleaned glass substrates by magnetron sputtering system (MS-560C), using a radio-frequency (RF) of 13.6 MHz.The base pressure in deposition chamber was kept blow 4.2×10⁻⁴Pa and high purity argon(99.999% purity) was used as the sputtering gas.Before the TMZO thin films deposition, the pre-sputtering was conducted for 20 min to attain stability and to remove impurities.The TMZO samples were prepared under the following processing parameters: 75 mm of target-to-substrate distance, 190 W of RF power, 560 K of substrate temperature and 30 min of deposition time.The gas pressure was varied from 0.2 to 0.8 Pa.
The optical transmission spectra of the TMZO samples were recorded by a double beam ultraviolet-visible spectrophotometer (TU-1901) at RT in ambient air, using air as reference.The optical constants and thickness of the TMZO samples were obtained using the method of optical spectrum fitting from the measured transmittance spectra.The sheet resistance of the TMZO samples was measured by a four-probe meter (SZ-82), and the film resistivity was determined by taking the product of sheet resistance and film thickness.
2 Results and discussion
2.1 Optical transmittance and band gap of the thin films
Fig.1 shows the transmission spectra of the samples prepared on glass substrates (TMZO/substrate) at different gas pressures.Obvious interference fringe can be observed in each spectrum, indicating that the TMZO thin films have a very homogeneous and smooth surface in our present work.The average transmittance (Tav) of the samples in the visible range has been calculated and is plotted in
Fig.2 as a function of the gas pressure.As can be seen in
Fig.2, theTavvalue rises with the increase of gas pressure from 0.2 to 0.6 Pa, and then falls when the gas pressure exceeds 0.6 Pa.The maximumTavof 84.25% is obtained at the gas pressure of 0.6 Pa.Such an increase in the optical transmittance may be attributed to the improvement of crystalline quality of the TMZO thin film.
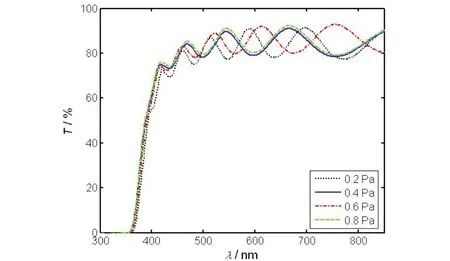
Fig.1 Transmission spectra of all the samples圖1 所有薄膜樣品的透射譜
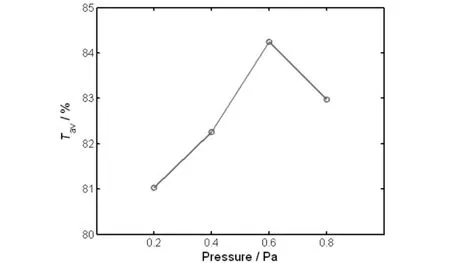
Fig.2 Average visible transmittanceof all the samples圖2 所有薄膜樣品的可見光平均透過率
Using the transmittance spectra, the optical band gap (Eg) of the deposited films was evaluated using the following relationship[26,30]:
(α·E)p=C·(E-Eg),
(1)
whereCis an energy-independent constant,Eis the incident photon energy,αis the absorption coefficient of thin film, andpis an exponent.As ZnO is a direct band gap semiconductor, thepvalue is taken as 2.TheEgof the TMZO thin films can be calculated from the intercept of (α·E)2versusE(Tauc plot) for direct transitions.Fig.3 presents the Tauc plots of (α·E)2versusEfor the samples prepared at different gas pressures, in which (a), (b), (c) and (d) are the samples deposited at the gas pressure of 0.2, 0.4, 0.6 and 0.8 Pa, respectively.Better linearity for the Tauc plot was observed and theEgwas determined by extrapolating the linear absorption edge part of the curve.The values of optical band gap, ranged between 3.37 eV and 3.38 eV, vary slightly with gas pressure.They are all larger than that of undoped bulk ZnO (3.27 eV)[31].The widening of optical band gap may be attributed to Moss-Burstein effect[32]in which the absorption edge shifts towards higher energy with an increase of carrier concentration.Similar results for the doped ZnO thin films have been reported in the literature[33-35].

Fig.3 Tauc plots of (aE)2-E for all the samples圖3 所有薄膜樣品的(aE)2-E曲線圖
2.2 Optical constants of the thin films
From the measured transmittance spectra, the refractive index (n) and extinction coefficient (k) of the samples were determined using the method of optical spectrum fitting[26].Fig.4 shows the fitting curves of transmittance (Tfit) for the thin films prepared at different gas pressures.From
Fig.4, it is observed that the fitting results are in good agreement with the measured data (Texp).

Fig.4 Fitting curves of transmittance of all the samples圖4 所有薄膜樣品的透過率擬合曲線
Fig.5 presents thenvalues of all the samples prepared at different gas pressures.Thendecreases with the increase of wavelength (λ), indicating that the thin films possess the normal dispersion characteristics in the visible region.Meanwhile, thenis closely related to the gas pressure.For the samples prepared at the gas pressure of 0.2, 0.4, 0.6 and 0.8 Pa, thenvalues are 2.003, 2.015, 2.071 and 1.965, respectively, when the wavelengthλ=510 nm.As the gas pressure increases, theninitially rises and then falls.

Fig.5 Refractive index versus wavelength of all the samples圖5 所有薄膜樣品的折射率隨波長而變化的曲線
Fig.6 displays thekvalues of all the samples prepared at different gas pressures.As can be seen from
Fig.6, thekvalue is found to be very small in the visible region, which indicates that the TMZO thin films are almost transparent in the visible region.At the wavelengthλ=530 nm, for the samples prepared at 0.2, 0.4, 0.6 and 0.8 Pa, thekvalues are 6.65×10⁻⁵, 4.96×10⁻⁵, 1.73×10⁻⁴and 1.29×10⁻⁴, and the corresponding values ofαdetermined by the formulaα=4πk/λare 15.77, 11.77, 40.92 and 30.52 cm-1, respectively.The observed results are in agreement with the earlier reports[26,36,37].

Fig.6 Extinction coefficient versus wavelength of all the samples圖6 所有薄膜樣品的消光系數(shù)隨波長而變化的曲線
2.3 Refractive index dispersion of the thin films
The refractive index dispersion of the samples was studied according to the single oscillator dispersion model.The refractive indexn(λ) of the samples in the region of low absorption can be expressed by the following relationship[26]:
(2)


Fig.7 Experimental values and single oscillator model of all the samples圖7 所有薄膜樣品的實(shí)驗(yàn)值和單振子模型擬合結(jié)果
(3)
wherecis the velocity of light,his the Plank constant, andqis the charge of the electron.The obtained parameters ofSo,λo,EoandEo/So(the refractive index dispersion parameter) for the thin films are listed in
Tab.1.As seen from this table, these parameters are subjected to the gas pressure.The obtained values ofEo/Soare observed to be 9.68×10⁻¹⁴~11.56×10⁻¹⁴eV·m2, which are of the same order as those obtained by Wemple and DiDomenico for a number of materials[38].

Pressure /PaSo /m-2λo /nmEo /eVEo/So /(eV·m2)0.25.18×1013217.735.7111.02×10-140.45.77×1013210.575.9010.23×10-140.66.06×1013211.895.879.68×10-140.84.94×1013217.745.7111.56×10-14
2.4 Electrical and optoelectronic performance of the thin films
Fig.8 presents the resistivity (ρ) of the samples prepared at different gas pressures.As the gas pressure increases from 0.2 to 0.8 Pa, theρa(bǔ)lue firstly fall and then rises.When the gas pressure is 0.4 Pa, the lowestρof 1.60×10⁻²Ω·cm are achieved.In order to quantify the optoelectronic performance of the TMZO thin films, the figure of merit (Φ) is given by the following formula[39]:

Fig.8 Resistivity of all the samples.圖8 所有薄膜樣品的電阻率
(4)
whereρis the resistivity, andTavis the average transmittance in the visible range.Fig.9 shows the variation ofΦwith gas pressure for the deposited films.From
Fig.9, it was seen that theΦincreases with the gas pressure rising from 0.2 to 0.6 Pa, and then decreases sequentially from 0.6 to 0.8 Pa.The highestΦvalue of 3.65×10²Ω-1·cm-1are obtained when the gas pressure is 0.6 Pa.The increase inΦwith gas pressure was due to increase inTavand decrease inρ.It is known that the higher theΦ, the better quality of the TCO thin film.Thus, in this study, it can be concluded that the optimum gas pressure is 0.6 Pa.

Fig.9 Figure of merit of all the samples.圖9 所有薄膜樣品的品質(zhì)因數(shù)
3 Conclusion
The transparent conducting TMZO thin films were prepared onto glass substrates by magnetron sputtering at different gas pressures.The influence of gas pressure on the optical and electrical performance of the samples was investigated.The highest average visible transmittance of 84.25 %, the lowest resistivity of 1.60×10⁻²Ω·cm, and the maximum figure of merit of 3.65×10²Ω-1·cm-1are obtained when the gas pressure is 0.6 Pa.The optical constants were calculated by the method of optical spectrum fitting from the measured transmittance spectra.It is found that the refractive index and extinction coefficient tend to decrease with increasing wavelength.Furthermore, the dispersion behaviour of the refractive index was analyzed by the single oscillator dispersion model, and the oscillator parameters and optical band gaps were obtained.The results demonstrate that the gas pressure is one of the most important deposition parameters to affect the optoelectrical characteristics of TMZO thin films.
猜你喜歡
礦山安全信息(2021年21期)2021-07-04 06:33:32
中學(xué)生數(shù)理化·自主招生(2021年8期)2021-05-30 10:48:04
礦山安全信息(2020年37期)2020-12-26 07:25:58
礦山安全信息(2020年2期)2020-03-05 05:13:56
礦山安全信息(2020年3期)2020-03-04 10:18:08
數(shù)學(xué)物理學(xué)報(bào)(2018年1期)2018-03-26 08:16:58
江蘇農(nóng)業(yè)科學(xué)(2017年7期)2017-05-23 13:59:12
現(xiàn)代工業(yè)經(jīng)濟(jì)和信息化(2016年8期)2016-05-17 05:37:35
電測與儀表(2016年18期)2016-04-11 11:30:30
物理實(shí)驗(yàn)(2015年10期)2015-02-28 17:36:55