Fault Identification and Health Monitoring of Gas Turbine Engines Using Hybrid Machine Learning-based Strategies*
2022-03-16 05:44:38YanyanShenKhashayarKhorasani
風(fēng)機(jī)技術(shù) 2022年1期
Yan-yan Shen Khashayar Khorasani
(Department of Electrical and Computer Engineering,Concordia University,Montreal,Canada.)
Abstract:A health monitoring scheme is developed in this work by using hybrid machine learning strategies to identify the fault severity and assess the health status of the aircraft gas turbine engine that is subject to component degrada-tions that are caused by fouling and erosion.The proposed hybrid framework involves integrating both supervised recur-rentneural net work sand unsupervised self-organizing maps methodologies,where the formerisdevel oped to extract effective features thatcan be associated with the engine health condition and the latter is constructed for faultseverity modeling and tracking of each considered degradation mode.Advantages of our proposed methodology are that it accomplishes fault identification and health monitoring objectivesby only discovering in here nthealth information that areavailable in the system I/O dataateach operating point.The effectiveness of our approach is validated and justified with engine data under various degradation modes in compressors and turbines.
Keywords:Gas Turbine Engines;Health Monitoring;Fault Identification;Self-organizing Maps;Machine Learning;Recurrent Neural Networks.
Nomenclature
SOM Self-organizingmaps
GTE Gas turbineengine
CC Combustion chamber
HPC High pressure compressor
LPC Low pressure compressor
HPT High pressure turbine
LPT Low pressure turbine
nNozzle
PPressure
TTemperature
VVolume
N1Rotational speed of the spool connecting the HPC to the HPT
N2Rotational speed of the spool connecting the LPC to the LPT
ηCCEfficiency of the combustion chamber
cpSpecific heatat the constantpressure
cvSpecific heatat the constantvolume
Mechanical efficiency forN1
Mechanical efficiency forN2
HuFuelspecific heat
J1Inertia of the high-pressure shaft
J2Inertia of the low-pressure shaft
βBypass ratio
TMTemperatureof themixer
VMVolumeof themixer
RGas constant
0 Introduction
Gas turbine engines(GTE)as safety-critical systems for aircraft require effective and intelligent faultseverity identification and health monitoring strategies to enable one to achieve early identification and quantification of anomalies and malfunctions.The capabilities of diagnosing the faultexistence and assessing the corresponding severity levels during the GTE real-time operation is a crucial task for guaranteeing operational reliability since an unexpected failure can lead to unacceptable long maintenance shutdown and deteriorated functionalities and performance,which consequently threaten the GTE safe operation.The increasing design complexities and demands on strict security and safety concerns with expectations in decreasing the life cycle costhave driven and motivated the necessity of developing autonomous,reliable and efficient diagnosis and health monitoring of GTE systems.
Techniques on addressing critical fault diagnosis problems are mostly categorized into model-based and data-driven approaches.Although the model-based methodologies have been extensively studied in the literature,their main drawback is the difficult realization of a high-fidelity mathematical model.The increased modeling uncertainties and nonlinearities can decrease the reliability of the faultdiagnostic decision-making processes.Data-driven methodologies are expected to be an alternative to and also promising solutions for such practical problems.As a commonlymentioned data-driven method,artificial neural network-based approaches have been extensively studied in the field of fault diagnosis,such as the feed-forward neural networks of Lu and Basar(1998)[1],the auto-associate neural network of Siegeland Lee(2011)[2],the dynamicneuralnet works of Tayaeani-Bathaie et al.(2014)[3],Vanini et al.(2014)[4],and the support vectormachine of Widodo et al.(2009)[5].The main shortcomings of the above artificial neural net work based faultdiagnosis approachesare summarized as follows:
1)Majority of the above existing artificial neural network-based approaches for fault diagnosis can only make reasonable detection and isolation in certain scenarios;however,they might fail to detect the slow ly-varying incipient faults in early degradation stages(Hu etal.(2013))[6].
2)Supervised learning-based approaches in the above literature usually aim to enhance performance by achieving specific classification ratios or targetswhich potentially lead to over-fitting issues,i.e.poor capability of the classifier to generalize to novel data under realtime measurements and scenarios.Additionally,supervised approaches always require a large number of samples corresponding to various health conditions,however,when the samples in practice that are used to train the model are not adequate,the constructed models usually diverge from reality leading to misjudgments in the decision-making processes.
3)The aforementioned research works deal with the fault detection problemin order to identify the present status between the healthy and faulty conditions,and then the fault isolation problem to indicate the defective components of the gas path(mainly the compressors and turbines).However,the fault identification problemis still an important problem since it enables one to quantize and estimate the existing magnitude or the faultseverity level to provide efficient support in the condition-based maintenance decision-making processes.
Unsupervised machine learning methodologies usually focus on recognition of the natural structure and mutual dependencies in the data bymeans of discovering common hidden patterns and properties and are expected to represent as more reliable and robustalternatives.According to Shannon’s rate-distortion theory,such mutual dependencies contain the actual intrinsic dimension of the data and allow one to avoid over-fitting responses associated with the classification algorithms(Leiva-Murillo etal.(2007)[7].In this sense,application of unsupervised techniques represents as powerful processing procedures to retain the underlying physical phenomenon of the gas turbine engine undermonitoring.Therefore,data resulting from healthy or faulty conditions can be analyzed and the degradation severity levels can bemined.
Unsupervised methods,such as K-means in Celebietal.(2013)[8],density-based clustering in Bhuyan and Borah(2013)[9],spectral clustering in Von Luxburg(2007)[10],non-parametric clustering in Blei and Frazier(2011)[11]or self-organizing maps in Kohonen(1990 and 2013)[12,15],each have their own advantages and limitations.For instance,the K-means algorithm needs the prior know ledge about the number of clusters to start with and its performance highly dependson the initialization of the neuron centroids;the spectral clustering ishighly dependenton building the proximity graph and is quite sensitive to noise;and the non-parametric clustering algorithm requires known data probabilistic distributions and the number of clusters for the corresponding datasetunder study.
The self-organizing maps(SOM)is neural networks with unsupervised competitive learning algorithm,which performs vector quantization that divides a continuous input spaceofn-dimensionaldata vectors space into a reduced subset of prototype vectors that are organized in a regular pattern.SOM s have been shown to be effective due to these advantages:(i)preserving the topological properties of the inputs by mapping the close points in the input space to the same or neighboring processing elements in the output space and(ii)simple structure and capability of dealing with highdimensional problems through converting theminto low dimensions,which facilitates the discovery of hidden patterns of the input data(Kohonen(2013)[15].These features can help to identify hidden patterns in the data,discover similarity or dis-similarity between groups of data,and visualize the data’s natural structure,which cannot be observed through utilizing other clustering methods.
Several research work on SOM networks in the domain of faultdiagnosishave been proposed in the literature.For instance,Yen etal.(2013)[16]have developed a SOM network for acoustic emission signal-based wear monitoring for amicro-milling process that provides amore accurate classification rate and a more reliable methodology for reducing effects on the system performance as contributed by noise or variations in the cutting system than other networks they compared with.However,although impressive performance has been achieved in the literature,mostof thework have focused on the fault detection problem by distinguishing similarities and dissimilarities between healthy and faulty datasets.Fault identification is still of vital research importance since itenablesone to indicate and quantize the existing degradation severity in order to providemore reliable and timely support for maintenance tasks and operations.
Fault identification is usually performed based on analysis of the fault signatures.Fault signatures of gas turbine engines are vectors of symptoms for each faultmode that can be related to extraction of specific features from the analyzed signals,such as available pressures,temperatures or spool speeds.The raw measurements from sensors cannot directly be regarded as features to be used in the fault identification and health monitoring scheme since their values are usually affected by environmental factors,such as external environmental disturbances,altitude and the Mach number,which can lead to variations inmeasurements that are not originated due to faults or degradations.In this case,the commonly designated“residual signals”thatare derived from differences between real-time spool rotational speeds,temperatures and pressures against their normal or healthy conditions,are expected to be extracted aseffective features.
However,residual feature generation isnota trivial task since precise residual signals should reduce irrelevant impacts from other sources such as uncertainties,noise and disturbances.Therefore,utilizing an appropriatemodeling technique is of a significant concern,especially in our application of a highly nonlinear gas turbine engine.
Towards the above objectives and challenges,in this work a hybrid machine learning scheme is proposed to accomplish design and implementation of the fault severity identification problem.From the data analysis pointof view,our goal is to design a self-mining“smart”fault identification system tomonitor the health status,and to improve reliability of the aircraft gas turbine engine by only concentrating on the real-time data characteristics.
In view of the above discussion,the contributions of thiswork can be summarized as follows:
1)A hybrid machine learning-based methodology is developed to tackle the problem of fault identification by utilizing two different machine learning paradigms,namely recurrentneuralnet works(RNN)and self-organizing maps(SOM).The proposed scheme accomplishes the degradation severity quantization and dynamical health monitoring objectives by only discovering inherent health information that are available in the system I/O data ateach operating point.
2)The developed visualized fault identification structures are not only intuitively easy to understand the clustering for similar and dis-similar health status conditions,butalso have a vivid visualization effects on unlabeled and unseen datasets from unknown fault sources.This feature and capability cannot be accomplished by the w idely studied supervised neuralnet work-based health monitoring schemes.
1 Gas Turbine Engines and the Degradation Problem
The schematic of a tw in-spoolgas turbine enginemodel that is depicted in Fig.1 is constructed and validated based on the works of Meskin et al.(2010 and 2011)[17,18].Both the rotor dynamics and the volume dynamics are considered in order to represent the gas turbine engine nonlinear dynamical characteristics.A lthough heat transfer dynamics also contribute to the nonlinear behavior of the gas turbine engine particularly when considerable discrepancies exist between temperatures of the air stream and components due to a large power excursion,e.g.,during the takeoff or rapid maneuvers of an agile aircraft(Meskin etal.2010)[17],this effect is neglected since we consider a commercial tw in-spool gas turbine engine at normal operating condition in this work.A brief review of the system mathematical model is provided in the Appendix as a reference for the reader.The physical significance of the model parameters and details are provided in the Nomenclature section.
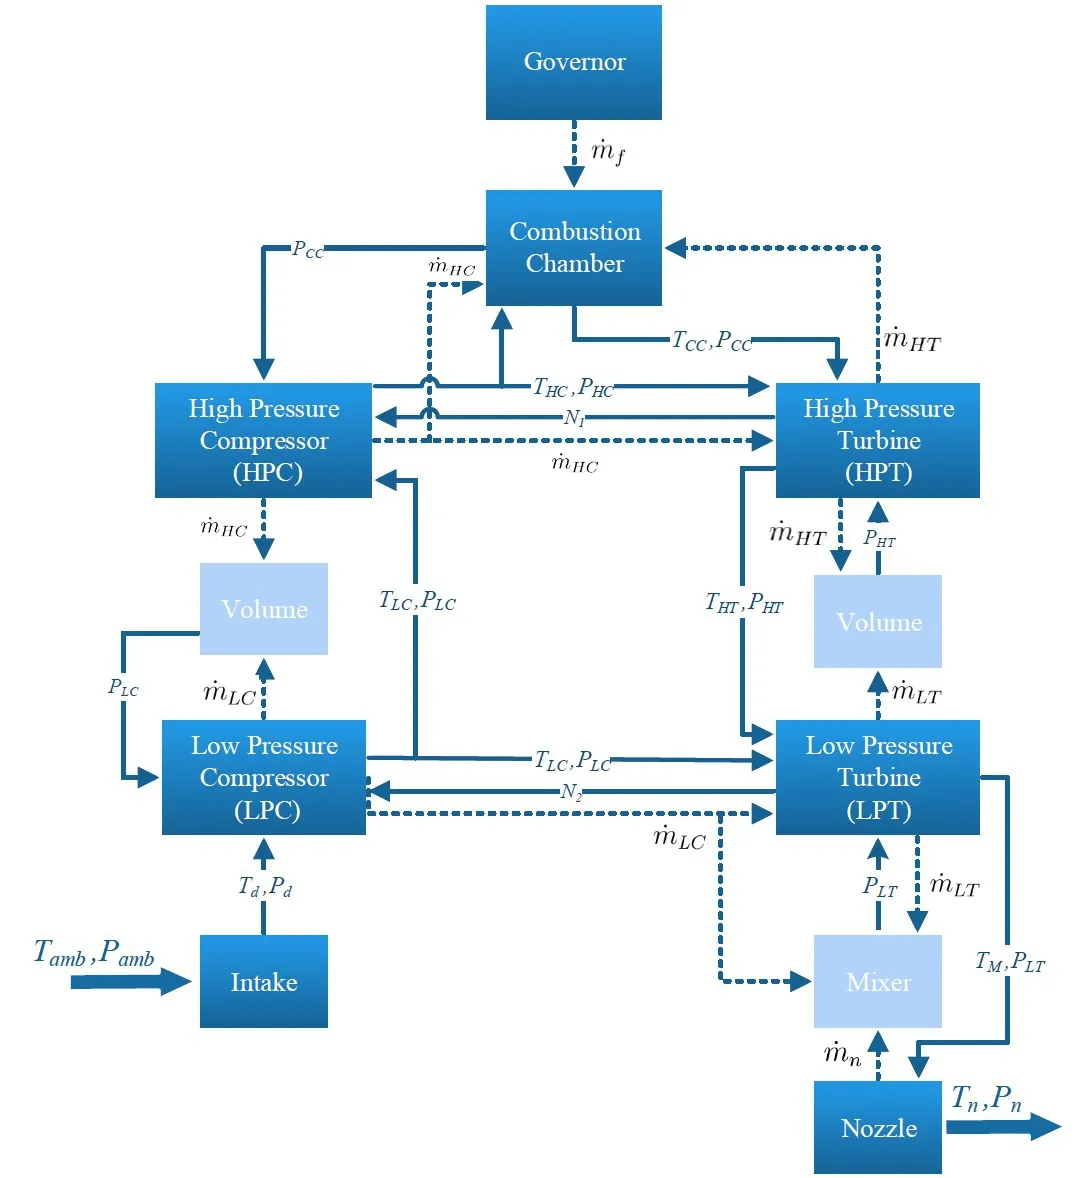
Fig.1 Sche matic module of a twin-Spoolgas turbine engine(Meskin etal.2010 and 2011)[17,18].
During the engine lifetime,compressors and turbinesex perience degradations that can be originated from effects of fouling,erosion,or corrosion,which are aerodynamic or performance-related issues(Volponi 2014)[19].These performance-related anomalies can affect the component level behavior and eventually the overall performance of the gas turbine engine.The fouling phenomena in the compressor is a common reason for the gas path deterioration and it can be known as a source of approximately 70%~85%of performance degradations in the overall gas turbine engine system(Diakunchak 1991)[20].Meanwhile,damage due to erosion phenomena in the turbine section is also typically considered as an issue and can particularly be severe in certain stagesof the gas turbine engine life cycle.The gas turbine engine performance deteriorates and leads to increased fuel consumption,uneconomical operation,and increased risk of mechanical failures during the gas turbine engine operating time due to these anomalies and degradations.
The component faults that are considered in this work are caused by the fouling and erosion.Fouling phenomenon alway soccurs in compressors(both in the HPC and LPC segments),which causes degradation of the mass flow rate and efficiency in the gas turbine engine.Erosion phenomenon has significant effects on reduction of efficiency and increase of the mass flow rate in the HPT or LPT segments.
Consequently,health parameters in this paper relate to efficiency and mass flow rates in the HPC and LPC segments that are caused by fouling,and HPT and LPT segments that are caused by erosion,respectively.The schematic diagram depicted in Fig.1 explicitly considers values of efficiencies,compressor mass flow rates and pressure ratios,and turbine inlet temperatures that can be adapted to consider degradation of the engine performance due to compressor fouling or turbine erosion.The considered componentde gradations and the definition of fault indicators are provided in Tab.1.

Tab.1 Considered componentde gradations and fault indicators
The problem considered in this work deals with developing a fault identification and heal thmonitoring methodology for aircraft gas turbine engines that are subject to presence of slow ly time-varying component degradations by utilizing only the available I/O sensor measurements and by usingmachine learning strategies under the follow ing assumption:The faults considered represent as slow ly time-varying degradations and that the tw in-spoolgas turbine engine is assumed to be at normal or healthy operating condition at the beginning of themonitoring process.
2 HyBRID Machine Learning Strategies based Health Monitoring
The proposed fault identification and health monitoring scheme is constructed by developing hybrid machine learning approachesas depicted in Fig.2.The term“hybrid”indicates thatour proposed methodology involvesboth the supervised learning-based and unsupervised learning-based methodologies.
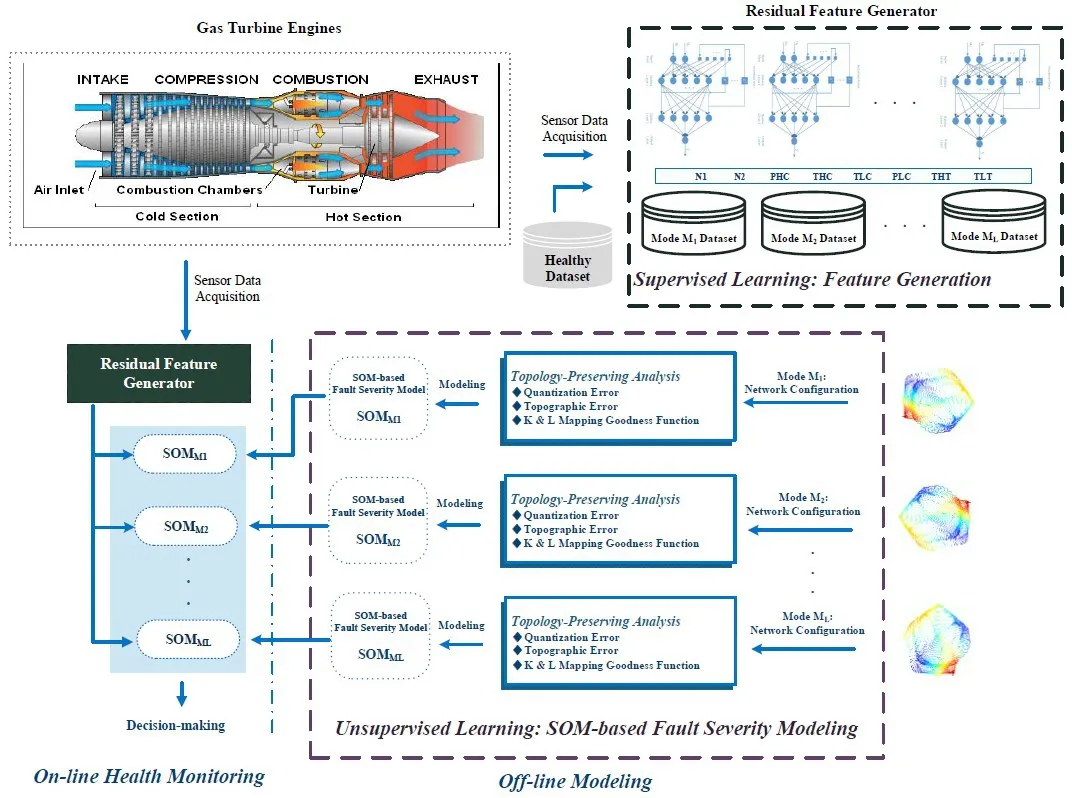
Fig.2 Hybrid machine learning-based fault identification and health monitoring of the gas turbineengines.
In terms of the supervised learning-based approach,a bank of recurrent neural networks is developed to generate effective health-related features.These are accomplished in the residual feature generator module,asone critical premise of developing a reliable health monitoring scheme.Themain reason for constructing the generators based on recurrentn eural networks is their advantageous characteristics in coping with temporal information,uncertainties,and disturbances.
In terms of the unsupervised learning-based approach,a bank of self-organizing maps is constructed to develop fault severitymodels in order to address the problem of fault identification.Each of the fault severity models is associated with one of the fault modes and is developed for determining the presentde gradation severity level by distinguishing similarities and dis-similarities between the patterns under various faulty conditions.
Our objective is to demonstrate thatby utilizing our proposed hybrid machine learning paradigms one can obtain quantized degradation severity stages and track the degradation evolving trajectories by observing the constructed fault severitymodels.During the real-time health monitoring process,extracted patterns thatareobtained by the featuregenerator module over new measurements are presented to the fault identification module,and consequently the associated degradation severities can be discovered and identified.
Recurrentneuralnet work(RNN)-based featuregenerator The feature vectors that are used for determining the health status of compressors and turbines segments of the gas turbine engine in thiswork are derived from differences between the real-time spool rotational speeds,temperatures,and pressures against their normal and healthy conditions.The raw measurements from sensors cannot directly be regarded as features to be used in the fault identification and health monitoring processes since their values are usually affected by environmental factorswhich can lead to variations inmeasure ments thatare notoriginated due to faults or degradations.In this case,the“residual signals”(Isermann 2005)[21]are generated as patterns to be used for the gas turbine engine component fault identification and health monitoring processes.
In order to weaken the irrelevant impacts from uncertainties,noise and disturbances and generate accurate residual signals,selecting an appropriate modeling technique represents as a significant task for our highly nonlinear gas turbine engine.In this work,recurrent neural networks(RNN)are developed for the engine systemidentification under normal operating circumstances based on the extended Kalman filter(EKF)training algorithm.The utilization of RNN for identifying the dynamical systeminstead of using amathe matical model of the systemismotivated by the advantages that the former can handle presence of inevitable un-modeled dynamics,uncertainties,modelmismatches,noise,disturbances,and inherent nonlinearities that can cause inaccurate mathematical model representation and that could affect the subsequent faultidentification decisions.
Therefore,a bank of RNN-based residual feature generators are implemented as identifiers for the nonlinear gas turbine engine by taking advantages of the multiple model(MM)approach.Themth generator produces the residual signalsrmthat is constructed between themth real-time sensor and the corresponding data from themth identified healthy network model,withm=1,…,mdenoting the number of available sensors in the engine(Tab.2).
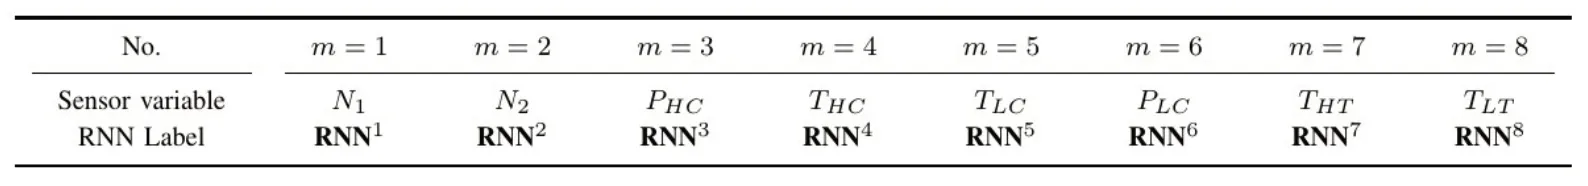
Tab.2 The developed bank of RNNsand the corresponding represented sensor variables
Mathematically,themth RNN-based generator is de-signed as follows:
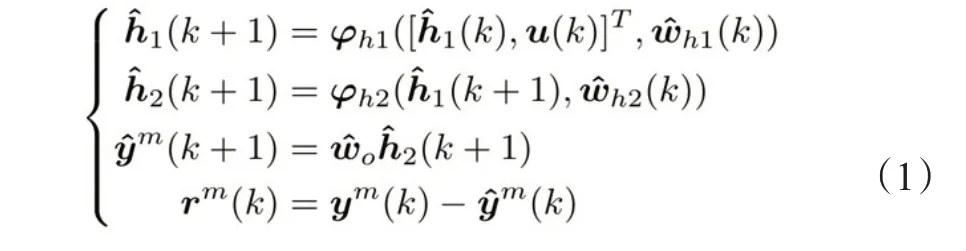
wherey^m(k+1)andy^m(k)denote the outputs from themth RNN network and the real-time engine sensor given the inputu(k),respectively.The architecture of the developed RNN-based generators is constructed as follows.Two hidden layers are designed where the outputof the1sthidden layer is fed back to form a context layer.The(k+1)and(k+1)denote the two hidden layer outputs,φh1andφh2represent activation functions for the1stand the2ndhidden layers,and(k),(k),and(k)represent the weight matrices,respectively.The network weights are trained by invoking the w idely used EKF which is characterized by its rapid convergence rate,well-suited capability to handle noisy training data and significantly reduced computational time(Pourbabaee etal.(2016)[22].
Self-Organizing Maps-based Fault Severity Identification
The SOM network is initially inspired by the biological selectively response mechanism of the brain neuron cells.The algorithm that was proposed by Kohonen(1982)[12]can be described as a nonlinear,smooth mapping of a highdi mensional input space onto a low-dimensional output space.The learning mechanism of the SOM network is briefly introduced for sake of completeness and more details can be found in Kohonen(1982,2012,2013)[12,14,15].
Consider a two-dimensional lattice in the output space that is arranged asqrrows andqccolumns,with the random ly given input patternr.Two learning steps are now presented as follows:
Competitive learning step:
The main goal is to identify the best matching unit(bmu).Letc(r)denote thebmuindex to the inputrwhich is obtained byc(r)=arg,wheremjis the weight vector of theneuronj.
Cooperative learning step:
Thebmucand its neighbors are adapted using a timevarying learning rateη(t)and a topological neighborhood functionΘj,c(r)(t)between the unitjand the unitcandt=0,1,2,…denotes the iteration step.The adaptation process is now specified as follows:

Inspired by the SOM learning algorithm the motivation behind developing our proposed SOM-based fault severity identification scheme can be justified by follow ing the observations below.First is the dimension reduction capability that is achieved by dealing with the high-dimensional input space onto a lower-dimensional output space.In case that input patterns represent effective information related to the aircraftengine faulty severity stages of a certain fault mode,the projected map can be regarded as a fault severity map on which differentbmuareas representseparated regions of similar health conditions.Another important capability is the topology preservation that enables adjacent nodes in themap grid lattice representsimilar prototypes in the inputs pace.
One problem confronted for achieving a reliable fault severity decision-making process is caused by that certain neurons of the trained SOM network risk that they can never be thebmuduring the training processwith the given dataset,however,these unlabeled neurons high likely become the w inning neurons over the assessment of new available engine measurements.Therefore,in order to construct a more robust network and a fault severity model,the approaches thatare proposed to address the above issue are as follows.
First is defining the appropriate network architecture configuration.The network architecture plays an important role in the finalgridmap and the decision-making process.If the network size is too big,then the trained map w ill be too specific,whereas if the network size is too small,the trained map w ill be too generic.Therefore,one ofmain discussions in this work is the architecture design.Second is the adjustment of the network neighborhood function.The neighborhood function enables one to control the impact of each inputpattern onto the SOM network.The sensitivity of each input pattern can be fine-tuned by the neighborhood function(Huang et al.(2007)[23].In this case,the chance of leaving certain unlabeled neurons in the trained SOM network can be minimized.Moreover,the SOM model can be more robustby enlarging the populations of the training dataset.
Based on the above considerations to improve the robustness and given our objective of constructing the fault severitymodels for each faultmode,the fault severity model is trained and developed in the nextsubsection.
The Proposed Fault Severity Model
An appropriate SOM network architecture for the fault severity identification is conceived as one that is capable of best representing the input space that is associated with the generated residual patterns.On the other hand,not properly configuring the network architecture can lead to erroneous hypothesis on the decision-making process.The dimension of the SOM should be decided according to the characteristics of the training data rather than on the pure empirical or the trial-and-error approach.Towards the above end,three metrics for evaluating the network topology-preserving capabilitiesare utilized in thiswork to justify and compare the effectiveness of different network structures and configurations.These evaluationmetrics enable one to verify and demonstrate the accuracy and continuity of the constructed prototypes for a given residual pattern by which the proper network architecture for the fault identification is developed and constructed.
K&Lmapping goodness function:Let us denoteD(r)as the distance between the patternrand its second closest prototype vectormc′(r),where the distance is measured follow ing the path of firstly passing fromrto its closest prototypemc(r)and thereafter along the shortest pathτitomc′(r)through a seriesof prototypes.TheK&Lmapping goodness function proposed by Kaski and Lagus(1996)[24]is represented as the average of the distanceD(r).The topology preservation capability by evaluating the above function is reflected by the fact that if there exists a fold in the map between c andc′due to topology violation,the distance of the path w ill be generally large by passing through more units,while if they areneighbors the distancew illbe smaller.
Quantization error denotes an average distance measure between patterns and the map nodes to which they are mapped to,with smaller values indicating a better fit.Kohonen(2012)[14]suggested it as the basic quality measure for evaluating SOM s.However,the value reported is on the same scale as the input pattern and therefore it can only be used to compare maps to one another.
Topographic error aims tomeasure the continuity of the mapping that is obtained by summing up the number of local topographic errors over all patterns and its normalization,that is,whencandc′are non-adjacent units,then,withu(ri)=1,otherw iseTe=0.The benefit behind this measure as indicated by Kiviluoto(1996)[25]is that itgivesone an idea ofwhatportion of the loca lneig hborhoods are mapped correctly.
Based on the above three topology-preserving metrics,the architecture design of the fault severity models is developed as follows.Let the grid map of themodel be arranged asqrneurons in rows andqcneurons in columns.In order to achievean appropriate configurationqr*qcthatcan best represent the fault severity patterns,a bank of network structures is selected and then compared with and evaluated by utilizing themetrics ofK&Lmapping goodness function,quantization error and the topographic error.Specifically,the quantization error and topographic error are utilized to compare among different SOM structures and configurations,whereas the metricK&Lmapping goodness function is utilized to compare the mapshaving the same structure butdifferentnet work initializations.The significance of utilizing themetricK&Lmapping goodness function is due to the randominitialization problem that could configure slightly different maps thatwould lead to non-deterministic fault severity results.Therefore,multiple training runs for the same structure are performed and the one having the lowestK&Lmapping goodness function value is selected as the“optimal”mapping resultat the given present instant.
3 Case Studies
In this section,capabilities of our proposed hybrid machine learning-based methodology,including the RNN-based residual feature generators are investigated and the faultseverity model foreach fault modeare constructed and presented.
4 Capability of the Feature Generators
Residual feature generator plays an important role in the capability of the overall fault identification and health monitoring scheme.The goalof the generators is to effectively indicate and identify accurate residual patterns that essentially depend on the proposed supervised machine learning based systemidentification competency of the developed RNNs.Taking advantage of the multiple-model(MM)-based approach,each generator in the bank representsonly one sensoras depicted in Tab.2.
The normalization method in each generator design is max-min processwhich isoperated on both the inputand output data.The bank of network specifications that are designed for the eight trained sensors under the healthy condition are provided in Tab.3.This table provides the network structure(nh1andnh2denote the number of neurons in the 1stand 2ndhidden layers,respectively)and performance indices for the training,testing and validation processes.The corresponding two performance indices,JtrainandJtestare defined according to,whereyandare defined in Eq.(1)andndenotes the size of the training or the testing dataset.
The network performances are compared with those that are obtained by the state-of-the-art dynamic neural networks(DNN)in Vanini et al.(2014)[4](provided the errors regardingN1,PLC,THCandTHT)and the conventionalmultilayer perceptron(MLP)with also two hidden layers and the same number of neurons as our developed RNNs.It follows from Tab.3 that the evaluation indices corresponding to bothJtrainandJtestof the bank of RNNs are not inferior to those of DNNs and LSTM s,however they behave much better that those obtained by theMLPs.
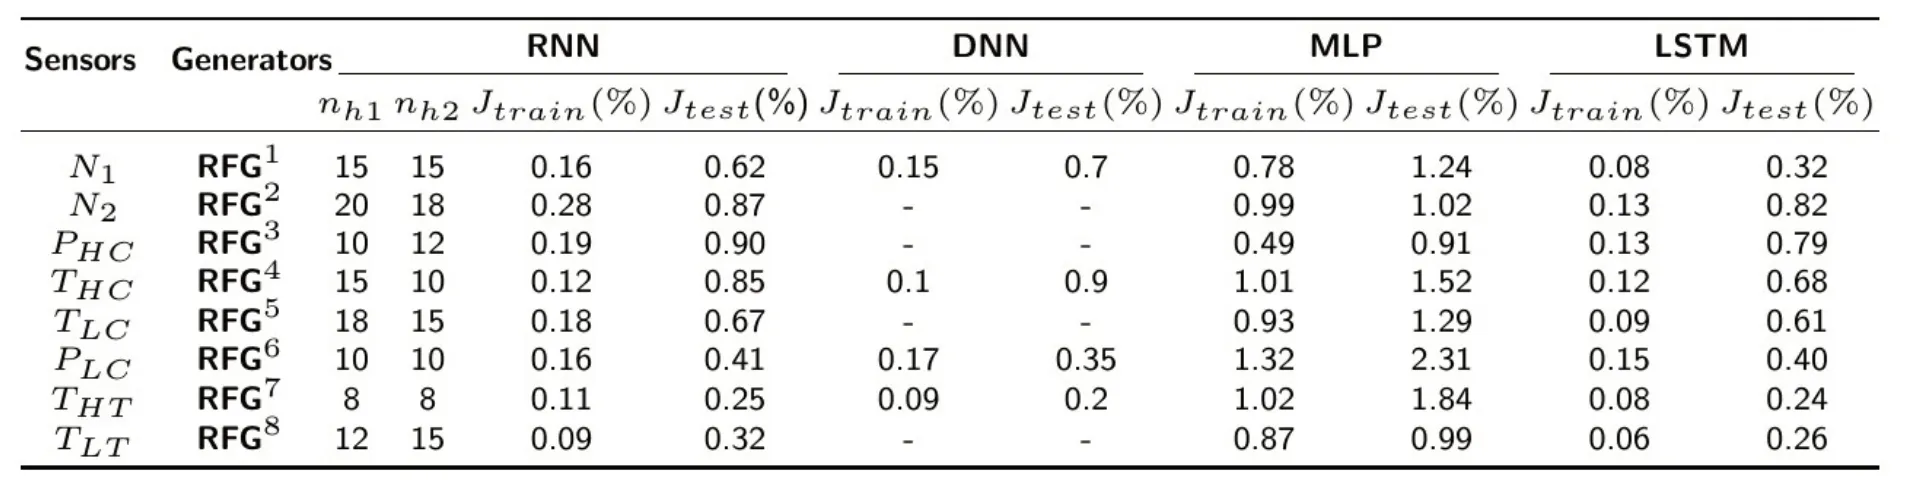
Tab.3 Feature generators,parameters with respect to the bank of RNNs,and performance comparisons to DNNs,MLPs,and LSTMs.
5 Fault Severity M odeling
The corresponding feature set is produced by the RNNbased feature generators,where the dataset for the fault identification module has eight attributes.In this subsection,we construct the fault identification models based on the above dataset,by which the health status regarding whether degradations are present or are not analyzed.Due to space limitations,we only present the details corresponding to themodeling formodesM1andM8.
ModeM1:Fault Severity Model SOMM1with Respect to Efficiency Degradation of the LPC
For configuring the appropriate SOM architecture to preserve the topology of the given dataset,various network architectures have been trained.Specifically,the row of the network is selected withinis not necessarily equal toqc).The architecture is quantitatively determined by comparing the topographic preservation capabilities among various sizes and configurations.Due to the randominitialization problem the outcomes of the net works are non-deterministic,therefore,50Monte Carlo training runs are implemented for each trial regarding each given size.For each of the fault modes,we collect560 patterns(10 samples per mode per severity level)for training and testing.The minimum number of both rows and columns for each fault mode are selected as four(4),and the maximum num bersare chosen as20 for both row sand column.
Given the patterns associated with the fault modeM1,the SOM having a network architecture SOMM1=SOM18*6(themap grids arranged as 18 rows and 6 columns)exhibits the best performance with respect to the evaluation metrics of K&Lmapping goodness function,topographic error and quantization error.For analyzing the constructed fault severity model SOMM1,the U-matrix is utilized and provided,which enables one to visualize the Euclidean distance between the codebook vectors of the neighboring neurons.Fig.3(a)shows the U-matrix of the resulting SOM18*6,and effectively,several regions can be obviously identified and observed.
The U-matrix describing the eight running stages from the trained SOM networks are shown in Fig.3(b).The eight degradation stages are ranging from normal condition(S0),1%severity condition(S1)to the severest condition of 7%(S7)degradations.The U-matrix is considered as the degradation mapping which integrates all the residual features that are extracted from the RNN-based generators to reflect the overall degradation trend.The degradation trajectory can be drawn according to development of its severity.By continuously tracking these trajectories,one can monitor the degradations in residual feature space for performing proactive condition-based maintenance.
In order to further observe trajectories for different defined degradation stages,another five severity stages are selected as the SOM outputs during the training process.The severity levels are defined by:S0 stage(normal),S1 stage(severity satisfying<2%),S2 stage(severity satisfying[2%,4%]),S3 stage(severity satisfying(4%,6%]),to the severest case S4 stage(severity satisfying(6%,7%]).The result is shown in Fig.3(c).There are some common characteristics in Fig.3(b)with those in Fig.3(c),which are summarized as follows:
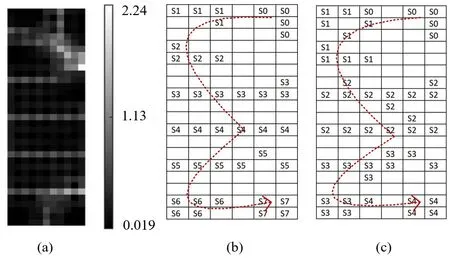
Fig.3 Faultseveritymodel SOMM1 for themode M1:SOM18*6(a)U-matrix of the faultseverity modelSOMM1,(b)U-matrix labels and the trajectory with respect to theeightseverity levels(S0 to S7),(c)U-matrix labelsand the trajectorywith respect to the five severity levels(S0 to S4).
1)The normal condition is located at the top right area in the U-matrices and has an obvious boundary with all the other fault conditions.Hence,the fault detection task which aims to determine whether the present efficiency capability of the low-pressure compressor is in the normal condition or not can be easily accomplished without any additional complex computations.
2)The degradation trend is followed from the normal condition in the top rightarea to the bottom right area along the same red and dotted trajectory lines in both figures.
3)The severer levels of degradation both occupy the bottom area,therefore the trajectory w illmove downwards.Both severest levels are located in the bottom righthand side of the figures.
Mode 8:Fault Severity Model SOMM8with Respect to Mass Flow Rate Degradation of the HPT
For configuring the appropriate SOM architecture to maintain the topology of the given dataset with respect to the fault modeM8,various network architectures have been trained.The optimal architecture is quantitatively determined by comparing the topographic-preserving capabilities among various sizes and configurations.Given the patterns it is determined that the SOM having a net work architecture SOMM8=SOM18*18(themap grids arranged as 18 rows and 18 columns)yields the best performance in terms of the evaluation metrics K&Lmapping goodness function,topographic error and quantization error.Due to space limitations,the detailson the comparison analysesareo mitted here.
For analyzing the constructed fault severity model,the U-matrix is depicted in Fig.4(a),which enablesone to visualize the Euclidean distance between the codebook vectors of the neighboring neurons.The U-matrix describing the eight running stages from the trained SOM networks are shown in Fig.4(b).The eight degradation stages range from the normal condition(S0),1%severity condition(S1)to the severest condition of 7%(S7).In Fig.4(b),several regions are identified and observed.Fig.4(c)shows the results considering different degradation stages from the SOM outputs during the training process.The severity levels are defined the same as in the previous case study,which is ranging from the S0 stage(normal),S1 stage(severity satisfying<2%),S2 stage(severity satisfying[2%,4%]),S3 stage(severity satisfying[5%,6%]),to the severest S4 stage(severity satisfying[6%,7%]).
The degradation trajectory can be obtained by observing the elevation of the degradation severity.There are some common characteristics that can be observed in Fig.4(b)and Fig.4(c),which are summarized as follows:
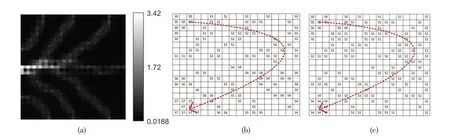
Fig.4 Faultseverity modelSOMM8 for themodeM8:SOM18*18(a)U-matrix of the faultseverity modelSOMM8,(b)U-matrix labelsand the trajectory with respect to eightseverity levels(S0 to S7),(c)U-matrix labelsand the trajectory with respect to fiveseverity levels(S0 to S4).
1)The normal condition occupies the top leftarea in the U-matrices and can be distinguished from the other fault modes that can benefit the fault detection objective since no complex algorithmis required to be developed for achieving thisgoal.
2)The severer degradation levels are located in the bottom areas therefore the trajectories w ill move downwards from the top leftareaalong the red and dotted plots.
3)The severest states are located in the bottom left areas that indicate immediate repair and maintenance actions have to be conducted.
During the real-time health monitoring process,extracted patterns that are obtained by the feature generator module over new measurements are presented to the fault identificationmodule.Consequently,the associated degradation severity can be evaluated and identified.The new residual feature data can be projected onto the fault severity maps by the trained SOM networks in order to determine in which area they are pointed out.Therefore,the faultseverity can be identified and analyzed that provides optimal information for maintenance decision making polices.
In order to test the effectiveness and reliability of the proposed method,20 samples with unknown fault severity levels for each faultmode are employed.The confusionmatrix results for the fault modesM1andM8are shown in Tab.s 4 and 5,respectively.Overall the accuracy of our proposed methodology that uses hybrid machine learning based on integration of supervised and unsupervised learning strategies can reach to 86.25%for themodeM1and to 88.75%for the modeM8,respectively.
As shown in both Tab.4 and 5,themis-classifications in the testing procedure have occurred between the adjacent health conditions.For instance,the testing patterns corresponding to the S1 severity stage for bothmodes can bemisclassified as the normal condition or the S2 severity condition,however it has not been judged as severer or unacceptable conditions.Since the implementation process of the gas turbine engine starting from healthy to the complete failure is slow ly progressing,and given that there are basically no definitely clear boundary between each adjacent condition,the outcomes obtained above can be considered as acceptable from the perspective of maintenance decision-making policies in industrialapplications.
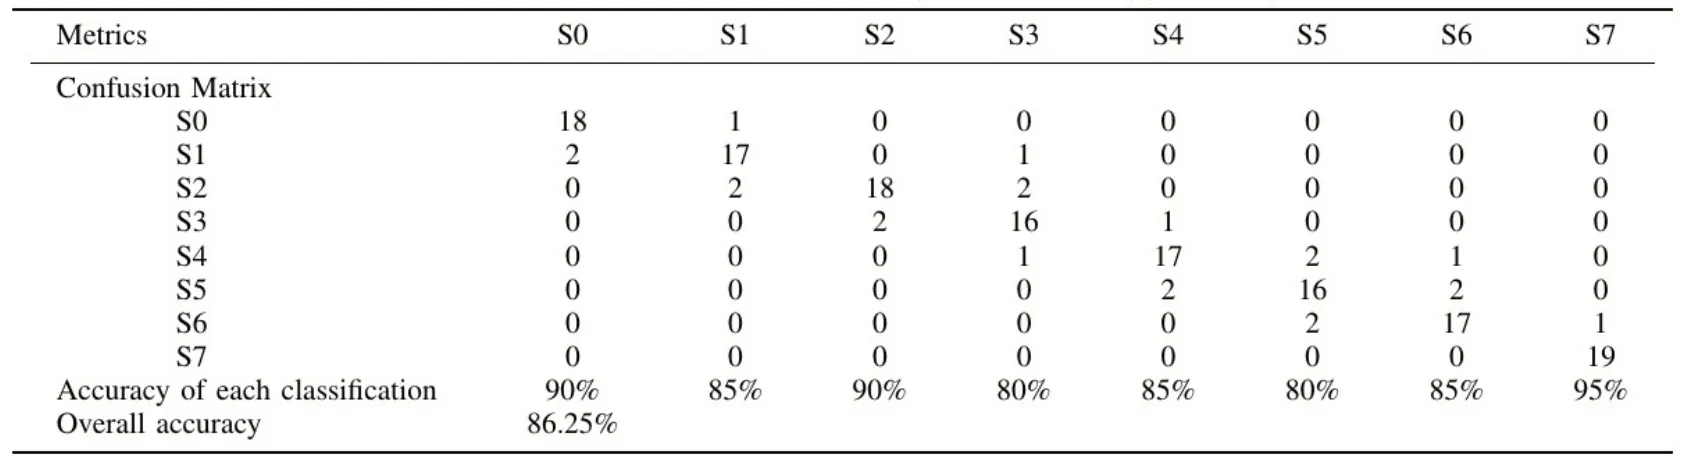
Tab.4 Accuracy of the faultseverity identification for themode M1 based on SOMM1:SOM18*6.
6 Coreof the Paper
This paper proposes an intelligent fault identification and health monitoring methodology for aircraft gas turbine engines that is subject to presence of component degradations where only the available I/O sensor measurements are being utilized and machine learning-based strategies are employed.
7 Conclusions
In this work we have developed a fault identification and health monitoring framework for component degradation severity assessment of an aircraft gas turbine engine by means of a hybrid machine learning methodology.The main advantage of this methodology relies on the efficient health monitoring capabilities of the well-known unsupervised SOM net works and their visualization capabilitiesalong with the intelligent featureextraction tools thatare based on supervised recurrent neural networks.These w ill allow us to discover relationships between health-related features and the degradation severity levels.It is important to highlight several important attributes associated with our proposed framework and methodology.
First,as compared to the extensively studied diagnostic solutions based on supervised neural networks in the literature,our proposed methodology yields advantages and superiorities in(i)enabling one to accomplish the fault identification and health monitoring objectives by only discovering inherent health information available in the system I/O data at each operating pointwithouthaving access to a prioriknow ledge of data set characteristics,and(ii)not suffering from the risk of poor threshold assignments,and(iii)enabling visual inspection of the underlying health status and information by observing the constructed SOM models.Second,in contrast to many existing SOM related diagnostic methods,our proposed methodology enables an automaticmap configuration based on well-known quantized metrics.Case studies have been demonstrated in detail the possibility and effectiveness of our proposed approach.It also demonstrates that the hybrid machine learning-based fault identification procedure provides ameans of enhancing the reliability of condi-tionmonitoring of gas turbine engines by indicating the current degradation state and tracking the degradation trend dynamically.Our future work involves severalareas such as visualization of concurrent or simultaneous multi-mode fault conditions by utilizing the SOM mapping and the remaining useful life(RUL)prediction that is combined with time series prediction methods.
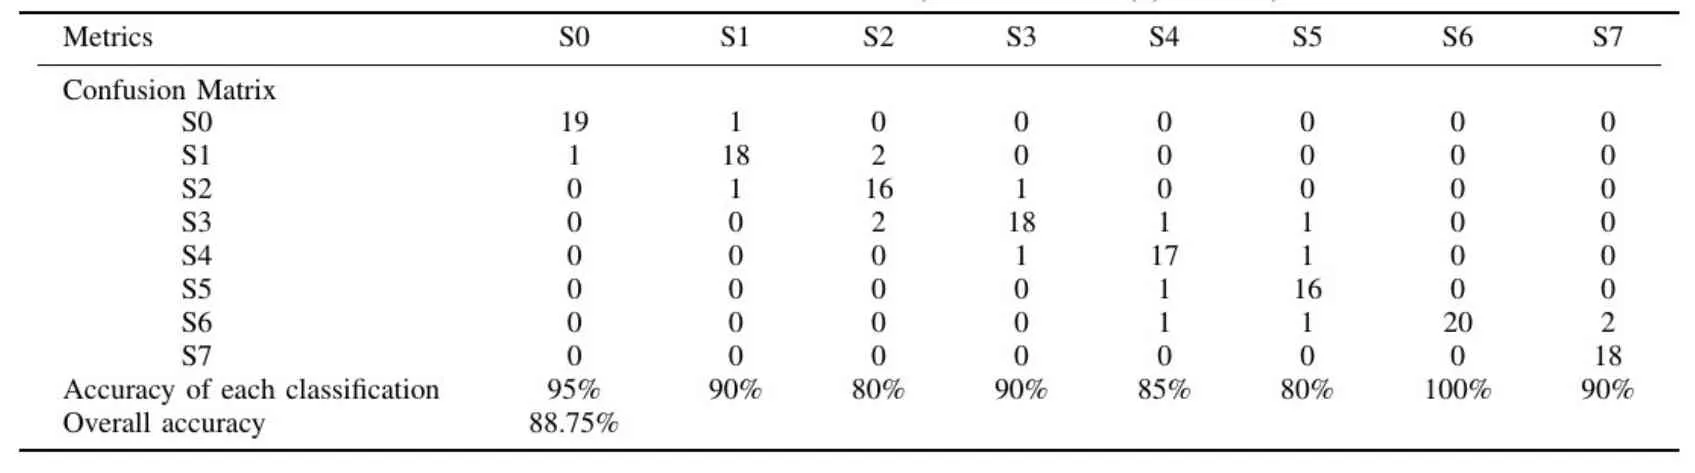
Tab.5 Accuracy of the faultseverity identification for themodeM8 based on SOMM8:SOM18*18.
8 Appendix
Based on the available literatureon modeling the nonlineardynamics of an aircraft gas turbine engine(GTE),a Simulink model for a tw in-spool engine is first developed.We have used the commercial software GSP 10 for the purpose of conducting extensive model validation studies.The mathematical model as constructed by thework of Meskin et al.(2010 and 2011)[17,18]is a set of nonlinear equations of motion that areexpressed by the follow ing equations.
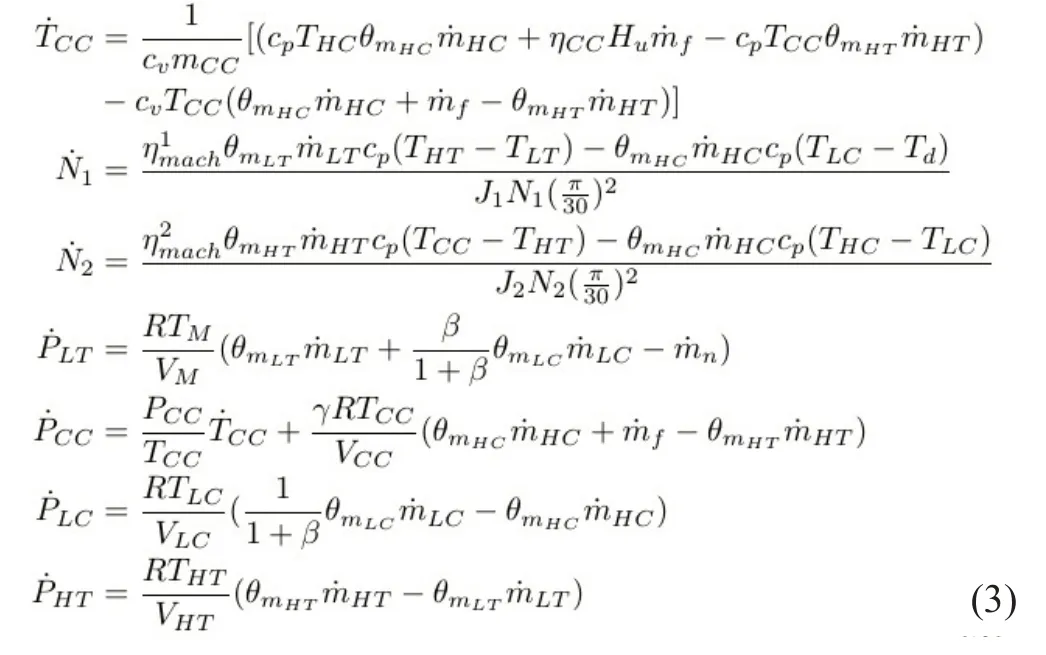
For the physical significance of themodel parameters and other details refer to the Nomenclature section and the reference Meskin etal.(2010 and 2011)[17,18].The inputor the control signal of the tw in-spool GTE is the power level angle(PLA)which is related to the fuel mass flow rate through a variable gain.The measurements are designated byz=[N1,N2,PHC,THC,TLC,PLC,TLT,THT]T.All the measurements are noise corrupted,where the noise levels are taken from Vaninietal(2014)[4].