
Integration of multiscale entropy and BASED scale of electroencephalography after adrenocorticotropic hormone therapy predict relapse of infantile spasms
2022-11-18 02:16:44LinWanChuTingZhangGangZhuJianChenXiuYuShiJingWangLiPingZouBoZhangWenBinShiChienHungYehGuangYang
World Journal of Pediatrics 2022年11期
Lin Wan·Chu-Ting Zhang·Gang Zhu·Jian Chen·Xiu-Yu Shi,5·Jing Wang·Li-Ping Zou,5·Bo Zhang·Wen-Bin Shi·Chien-Hung Yeh·Guang Yang,5
Abstract Background Even though adrenocorticotropic hormone (ACTH) demonstrated powerful efficacy in the initially successful treatment of infantile spasms (IS),nearly half of patients have experienced a relapse.We sought to investigate whether features of electroencephalogram (EEG) predict relapse in those IS patients without structural brain abnormalities.Methods We retrospectively reviewed data from children with IS who achieved initial response after ACTH treatment,along with EEG recorded within the last two days of treatment.The recurrence of epileptic spasms following treatment was tracked for 12 months.Subjects were categorized as either non-relapse or relapse groups.General clinical and EEG recordings were collected,burden of amplitudes and epileptiform discharges (BASED) score and multiscale entropy (MSE) were carefully explored for cross-group comparisons.Results Forty-one patients were enrolled in the study,of which 26 (63.4%) experienced a relapse.The BASED score was significantly higher in the relapse group.MSE in the non-relapse group was significantly lower than the relapse group in the γ band but higher in the lower frequency range (δ,θ,α).Sensitivity and specificity were 85.71% and 92.31%,respectively,when combining MSE in the δ/ γ frequency of the occipital region,plus BASED score were used to distinguish relapse from non-relapse groups.Conclusions BASED score and MSE of EEG after ACTH treatment could be used to predict relapse for IS patients without brain structural abnormalities.Patients with BASED score ≥ 3,MSE increased in higher frequency,and decreased in lower frequency had a high risk of relapse.
Keywords Burden of amplitudes and epileptiform discharges score·Infantile spasms·Multiscale entropy·Prediction·Relapse
Introduction
Infantile spasms (IS) is a catastrophic epileptic syndrome associated with poor neurodevelopmental outcomes and is characterized by epileptic spasms (ES) with or without hypsarrhythmic patterns on electroencephalogram (EEG) [1].Favorable cognitive outcomes lie in a well-controlled ES.Currently,the first-line treatment for IS includes the use of vigabatrin (VGB) and hormonal therapy [e.g.,adrenocorticotropic hormone (ACTH)and prednisone] [1–3].ACTH is used more often for IS treatment than VGB [4],effectively controlling ES in IS patients.Although ACTH’s initial effect is reported to be 42%–87% [1],the response is temporary in some patients.ES relapse has been reported in nearly 50% of IS patients who initially responded to ACTH treatment [1,5–8].
Etiology is the most important predictor of outcome in IS patients,the updated classification refers simply to known (symptomatic) and unknown (cryptogenic) etiologies [9,10].Those IS patients with known etiologies,especially structural abnormalities in the brain,often have poor prognosis [1].IS patients with structural brain abnormalities often present with difficulty controlling ES or with higher rates of ES relapse;however,the IS prognosis and ES relapse remain difficult to predict in the absence of structural brain abnormalities.
Hypsarrhythmia is one of the standard clinical criteria for both IS diagnosis and assessment of treatment response in the past;however,Yanagaki et al.reported that hypsarrhythmia resolution failed to decrease the risk of ES relapse [5].In addition,Hussain et al.found poor interrater reliability of hypsarrhythmia assessment,which is challenging in both the clinical and research arenas[11].Although a multitude of studies have assessed EEG characteristics,such as hypsarrhythmia,in IS patients,most of these studies focused on the effects of various treatments in altering these EEG characteristics [12–16].We also noticed that these published studies included some patients with structural brain abnormalities who often had the epileptogenic zones in brain,such as focal cortical dysplasia,etc.The epileptogenic zones have a special time–frequency pattern of electrical activity [17]that could have led to potential bias in the results of these studies [12–16].
The burden of amplitudes and epileptiform discharges(BASED) score developed by Mytinger et al.is a reliable interictal EEG grading scale for children with IS.The BASED score correlates well with the presence or absence of IS and may be used to measure treatment effectiveness in IS patients [18].Multiscale entropy (MSE),extended from sample entropy (SampEn),is one of the techniques developed to analyze the complexity of EEG signals [19].MSE measures the structural richness of information over multiple temporal scales and has been applied to detect EEG abnormalities in childhood epilepsy and neurodevelopmental diseases [12,20–23].Chu et al.found it was a potential biomarker to predict and monitor the treatment effect in IS [12].
However,most of these studies focused on the treatment effect,despite the relapse being a topic of immense general importance.BASED and MSE measurements of an EEG after ACTH treatment were performed in IS patients without brain structural abnormalities in the current study to see if these factors (BASED and MSE) can be used to predict ES relapse.
Methods
Subjects
Children with IS who achieved short-term responded to ACTH treatment and were reexamined in the Department of Pediatrics at the Chinese PLA General Hospital from 2015 to 2020 were recruited and screened.Patients meeting inclusion criteria were subsequently enrolled in the study.Inclusion criteria were as follows:(1) IS was defined as ES between 1 and 24 months of age [24];(2) IS [25] was due to non-structural etiologies,as confirmed by two pediatric neurologists;(3)patients completed 14 days of ACTH treatment upon IS presentation and achieved complete cessation of seizures by the end of the treatment period;(4) patients underwent examination via EEG within the last two days of ACTH treatment and were younger than two years;(5)EEG abnormalities were observed after ACTH treatment(e.g.,spikes,sharp and slow waves,polyspikes waves,etc.).Exclusion criteria were as follows: (1) anti-seizure medicines were adjusted during ACTH treatment,before relapse,or at last follow-up;(2) spasms prior to treatment did not occur daily;(3) severe EEG artifacts were present within the EEG readings;(4) absence of clinical or EEG data;(5) any patient without relapse whose follow-up time occurred within a year of ACTH treatment;and (6) relapse was caused by severe infection,trauma,or other obvious causes.
Adrenocorticotropic hormone treatment and electroencephalogram recording
Patients enrolled in the study were treated with intravenously administrated ACTH (2.5 U/kg/day,≤ 25 U/day) for 14 days[26,27].EEG recording was performed within the final two days of ACTH treatment with the standard international 10/20 system at a sampling frequency of 256 Hz.
Grouping by treatment response and relapse
Short-term response to ACTH treatment was defined as no witnessed spasms at the end of the 14 days treatment period and during the four weeks directly following ACTH treatment [1].Enrolled patients were divided into non-relapse and relapse groups.Relapse following short-term ACTH response was confirmed if patients exhibited any of the following within one year following the response period:(1) any episode of spasms occurring in clusters;(2) ≥ 2 independent episodes of spasms;and (3) subtle spasms (if accompanied by an EEG showing appropriate changes) [25].
Clinical data
Clinical data for each patient,including IS etiology,age of IS onset,time from IS onset to ACTH treatment,ACTH dosage,the presence or absence of hypsarrhythmia (either typical or atypical) [25,28,29] prior to and following ACTH treatment,ASM exposure,and oral glucocorticoid therapy were collected.
BASED scoring
Two independent,experienced neuroelectrophysiologists scored EEG data per the 2021 BASED scoring rules [18].In the case of an EEG scoring discrepancy,a senior neuroelectrophysiologist served as a tiebreaker.All study investigators were blinded to any previously documented EEG reports and clinical outcomes.EEG data was reviewed using the Micromed EEG system (Zerman di Mogliano Veneto,Italy)and was analyzed with a bipolar montage.
Features in multiscale entropy
Electroencephalogram data pre-processing
Sixteen EEG electrodes were applied to the frontal (Fp1,Fp2,F3,F4,F7,F8),central (C3,C4),parietal (P3,P4),temporal (T3,T4,T5,T6),and the occipital (O1,O2) sites and re-referenced to the common average.A notch filter with a center frequency of 50 Hz along with a sixth-order IIR Butterworth bandpass filter with a cutofffrequency set at 0.5–50 Hz was used to eliminate artifacts.Only EEG recordings obtained continuously for ≥ 1 hour,including wakefulness (i.e.,the awake stage) and/or sleep,were included in the data analysis.All data were divided into 10-minute epochs during wakefulness and sleep,respectively.
Multiscale entropy measuring
MSE,a representation of rich biological information in a wide range of time scales,measures the complexities of biophysiological signals derived from SampEn [21].Using the time series {x1,x2,…,xN} from EEG electrode recordings,whereNis the length of data,a set of non-overlapping segments depending on a scale factorτwas constructed,and the coarse-grained time series {y(τ)} was calculated as follows:
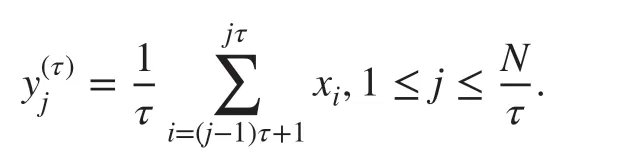
Notice that the coarse-grained sequence is reduced to the original time series whenτ=1.Next,the degree of randomness was measured for each coarse-grained sequence by SampEn.Briefly,SampEn was used to estimate the probability that two similar sequences of m consecutive points (herem=2) remain similar after one more point is embedded into the sequence,where the distance is lower than the tolerancer(herer=0.15).SampEn was defined as the negative natural logarithm of the ratio,i.e.,the total number of patterns ofm+1 length divided by the number of m-length patterns [22].To map the relationship between complexities and frequencies,the scale domain was converted to the frequency domain according to the equationf=fs/τ,where fs is the sampling rate of the original time series.The area under the MSE curve,named complexity index (CI) [23],was calculated to evaluate the multiscale complexities of epileptic EEGs for patients with IS [30,31].Of note,CI represents the cumulative amount of entropy across multiple time scales.CIs were calculated for the five frequency bands of interest (i.e.,δ: 1–4 Hz,θ: 4–8 Hz,α:8–13 Hz,β: 13–32 Hz,andγ: > 32 Hz) in patients with a prognosis of IS following ACTH treatment and were used in downstream statistical analyses.
Statistical analysis
Statistical analyses were performed using JMP 13.0 software(JMP;SAS,Cary,NC) and SPSS 26.0 software (SPSS,Chicago,IL,USA).Electrophysiological data were analyzed with MATLAB (MathWorks,Natick,MA).All clinical data are presented either as mean ± standard deviation for normally distributed data or median and interquartile range for non-normal data.Independent samplettest,Chi-square test,Fisher’s exact test,or rank-sum test were used to statistically analyze data as appropriate and where indicated.Logistic regression models were utilized to identify potential risk factors for relapse.P< 0.05 was used to indicate statistical significance.
To evaluate differences in CIs,the general linear mixed model was applied with prognosis and electrodes as the fixed factors.Two-tailedPvalues were applied for the tests(α=0.05).Tukey’s honest significant difference test was used for multiple comparison analysis testing.P< 0.05 indicated statistical significance.The receiver operating characteristic curve (ROC) was generated and used to classify cohorts with and without relapse,according to clinical and/or electrophysiological measures.
Results
Group comparisons of clinical data and BASED score
A total of 41 IS patients were screened for this study.Among them,26 (63.4%) patients experienced relapse following ACTH treatment,with the median time to relapse being three months (1st quartile–3rd quartile: 2–4).These patients were categorized into the relapse group.Fifteen(36.6%) patients remained seizure-free during the 12-month follow-up period and were categorized into the non-relapse group.Between non-relapse and relapse groups,there were no significant differences in terms of gender,IS etiology,age at IS onset,number of anti-seizure medications,presence of hypsarrhythmia before or after ACTH treatment,ACTH dosage,hormonal therapy history,interval from spasm onset to receiving ACTH treatment and age at EEG recording (P> 0.05,Table 1).Despite the lack of differences in baseline characteristics,the non-relapse group had a lower BASED score compared to the relapse group (P< 0.05,Table 1).
Risk factor analysis of relapse
Based on the aforementioned statistical analyses,all factors(BASED score,etiology,and interval from onset to receive ACTH treatment) with thePvalue < 0.2 were included in the logistic regression analysis (Table 2).The BASED score was the only independent risk factor significantly associated with relapse (P=0.014,odds ratio=2.658,95% confidence interval=1.217–5.804).
Comparisons of complexity indexes between non-relapse and relapse groups
Figure 1 shows a representative comparison (P4 in this case)of MSE curves from EEG recordings obtained in non-relapse(black line) and relapse groups (gray line).MSE curves were derived from the average across all epochs during sleep.The MSE curve profiles of the P4 electrode shown in Fig. 1 demonstrated the difference between the two groups,and the performances of the rest 15 electrodes resemble that (results not shown).Both non-relapse and relapse groups presented elevated SampEn acrossγ,β,andαbands,and then decreased under theδband.Because SampEn over one specific frequency might be varied from time to time,CIs of each predetermined frequency range of interest were calculated to provide a set of robust measures in characterizing complexity dynamics in IS.The MSE curves of both the non-relapse and the relapse groups showed that the entropies during wakefulness were lower than those during sleep (results not shown);therefore,we tested whether the CIs were affected by the prognosis and electrodes,as the next,grouped by the two stages (the awake and the sleep).Table 3 shows that the CIs for relapse patients during either wakefulness (P=0.0366) or sleep (P< 0.0001)are significantly higher than those of the non-relapse group intheγband (Fig. 1 inset and Fig. 2 a).Nevertheless,the CIs in theβband showed no significant differences between relapse and non-relapse groups (Fig. 2 b).In contrast,the lower frequency bands,includingα(P=0.0008),θ(P=0.0032),andδ(P=0.0002) bands presented an opposite trend to that of theγband,with relapse patients showing significantly lower CIs than non-relapse patients during sleep (Fig. 2 c–e).In addition,significantly higher CIs of the non-relapse cohort than the relapse ones were shown during wakefulness in theθ(P=0.0056) and theδbands (P=0.0004;Fig. 2 d,e).Given the general strongly significant differences in complexities between the two groups during sleep,only the EEGs during the sleep stage were used in subsequent analyses.
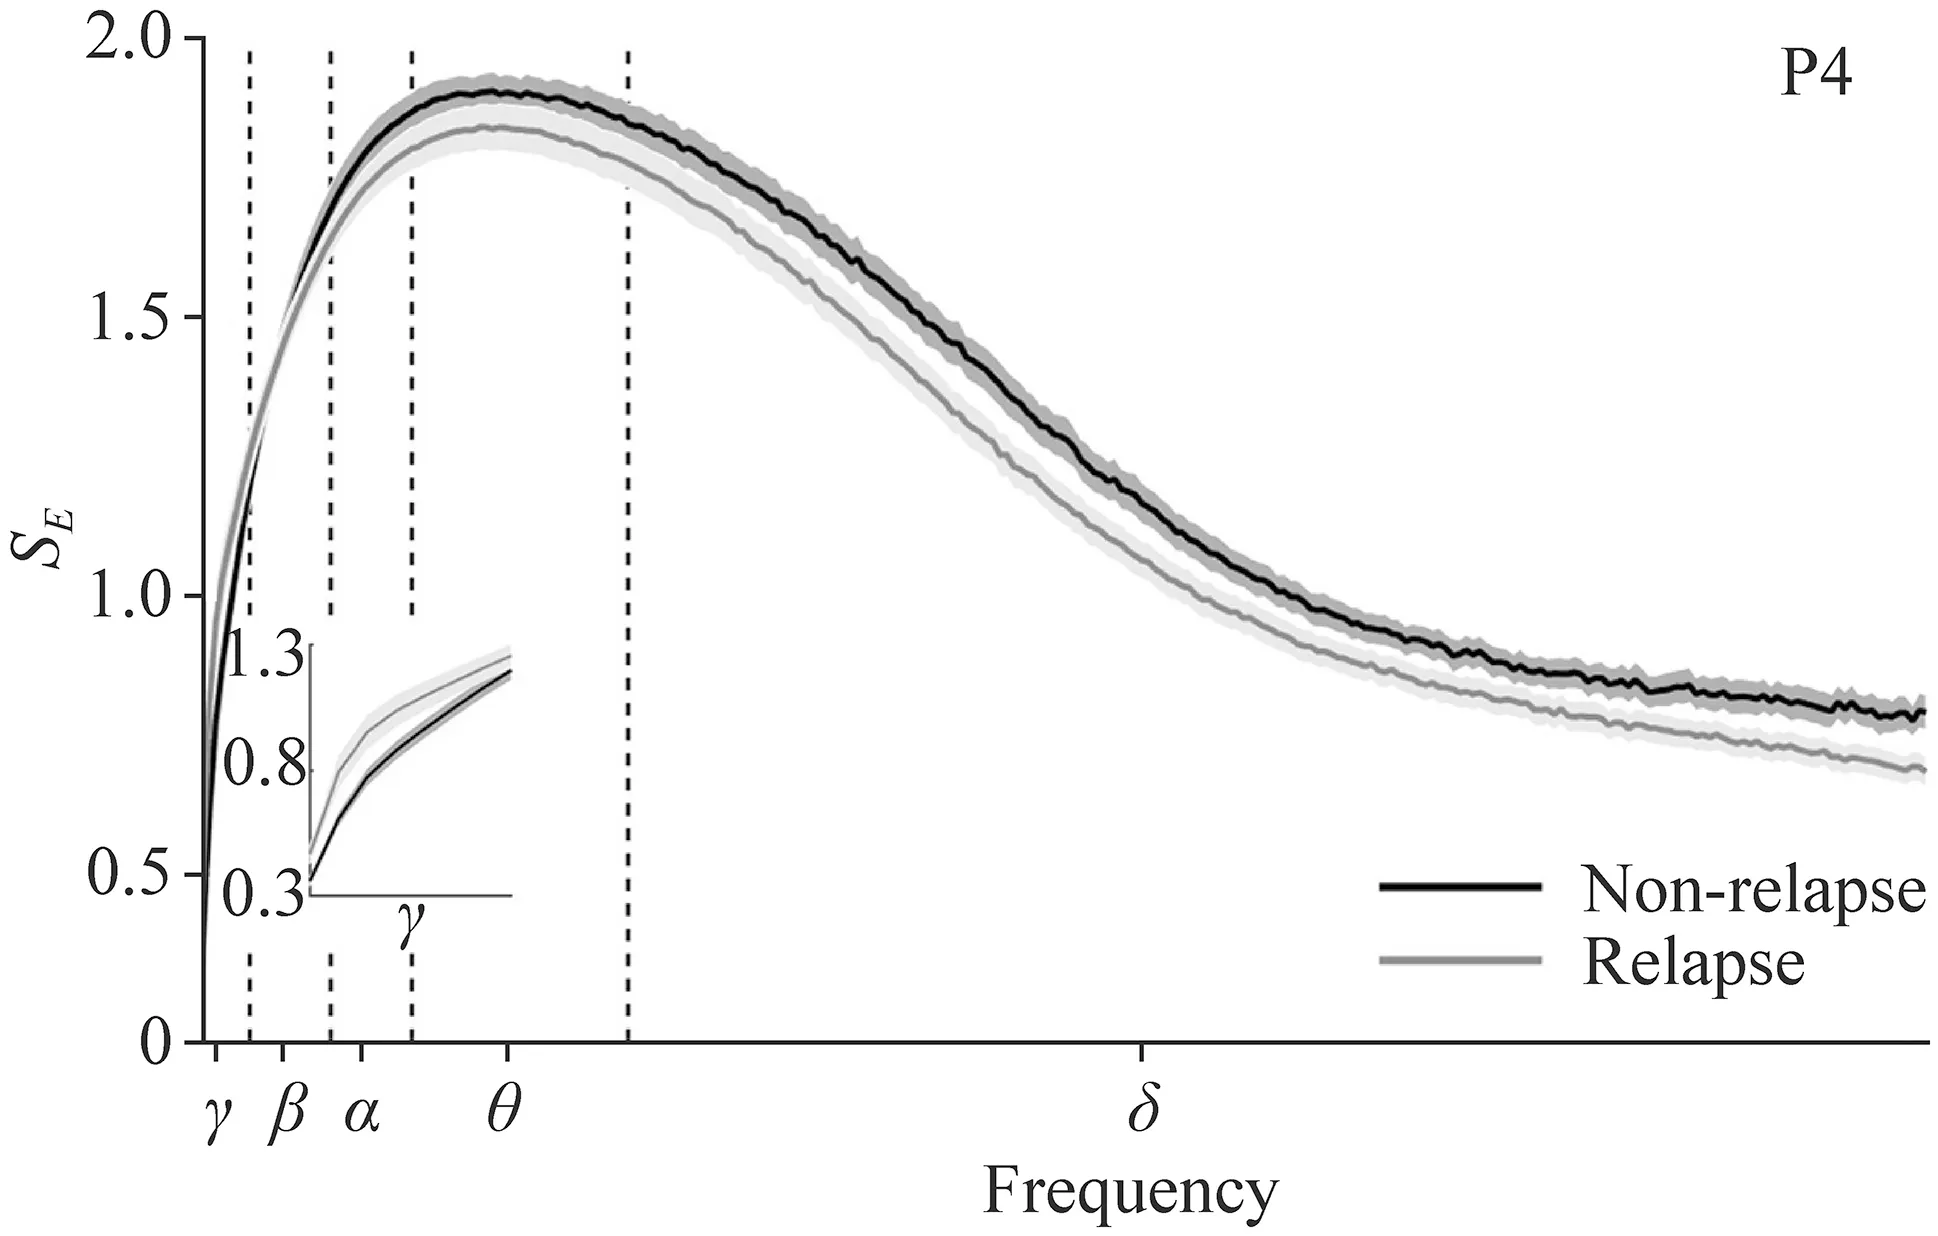
Fig.1 Averaged multiscale entropy (MSE) curves.MSE curves were averaged for non-relapse (black line) and relapse (gray line) groups during sleep and are presented as the mean ± standard error,denoted by the solid line and surrounding gray areas,respectively. P4 parietal
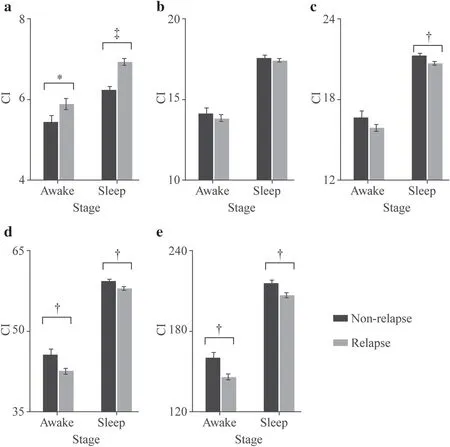
Fig.2 Comparisons of prognosis using complexity indexes (CIs).Data for non-relapsed (black) and relapsed (grey) groups are shown in γ (a),β (b),α (c),θ(d),and δ (e) bands.All data are subdivided by wakefulness (awake) and sleep.*,?,and ? indicate P < 0.05,0.01 and 0.001,respectively
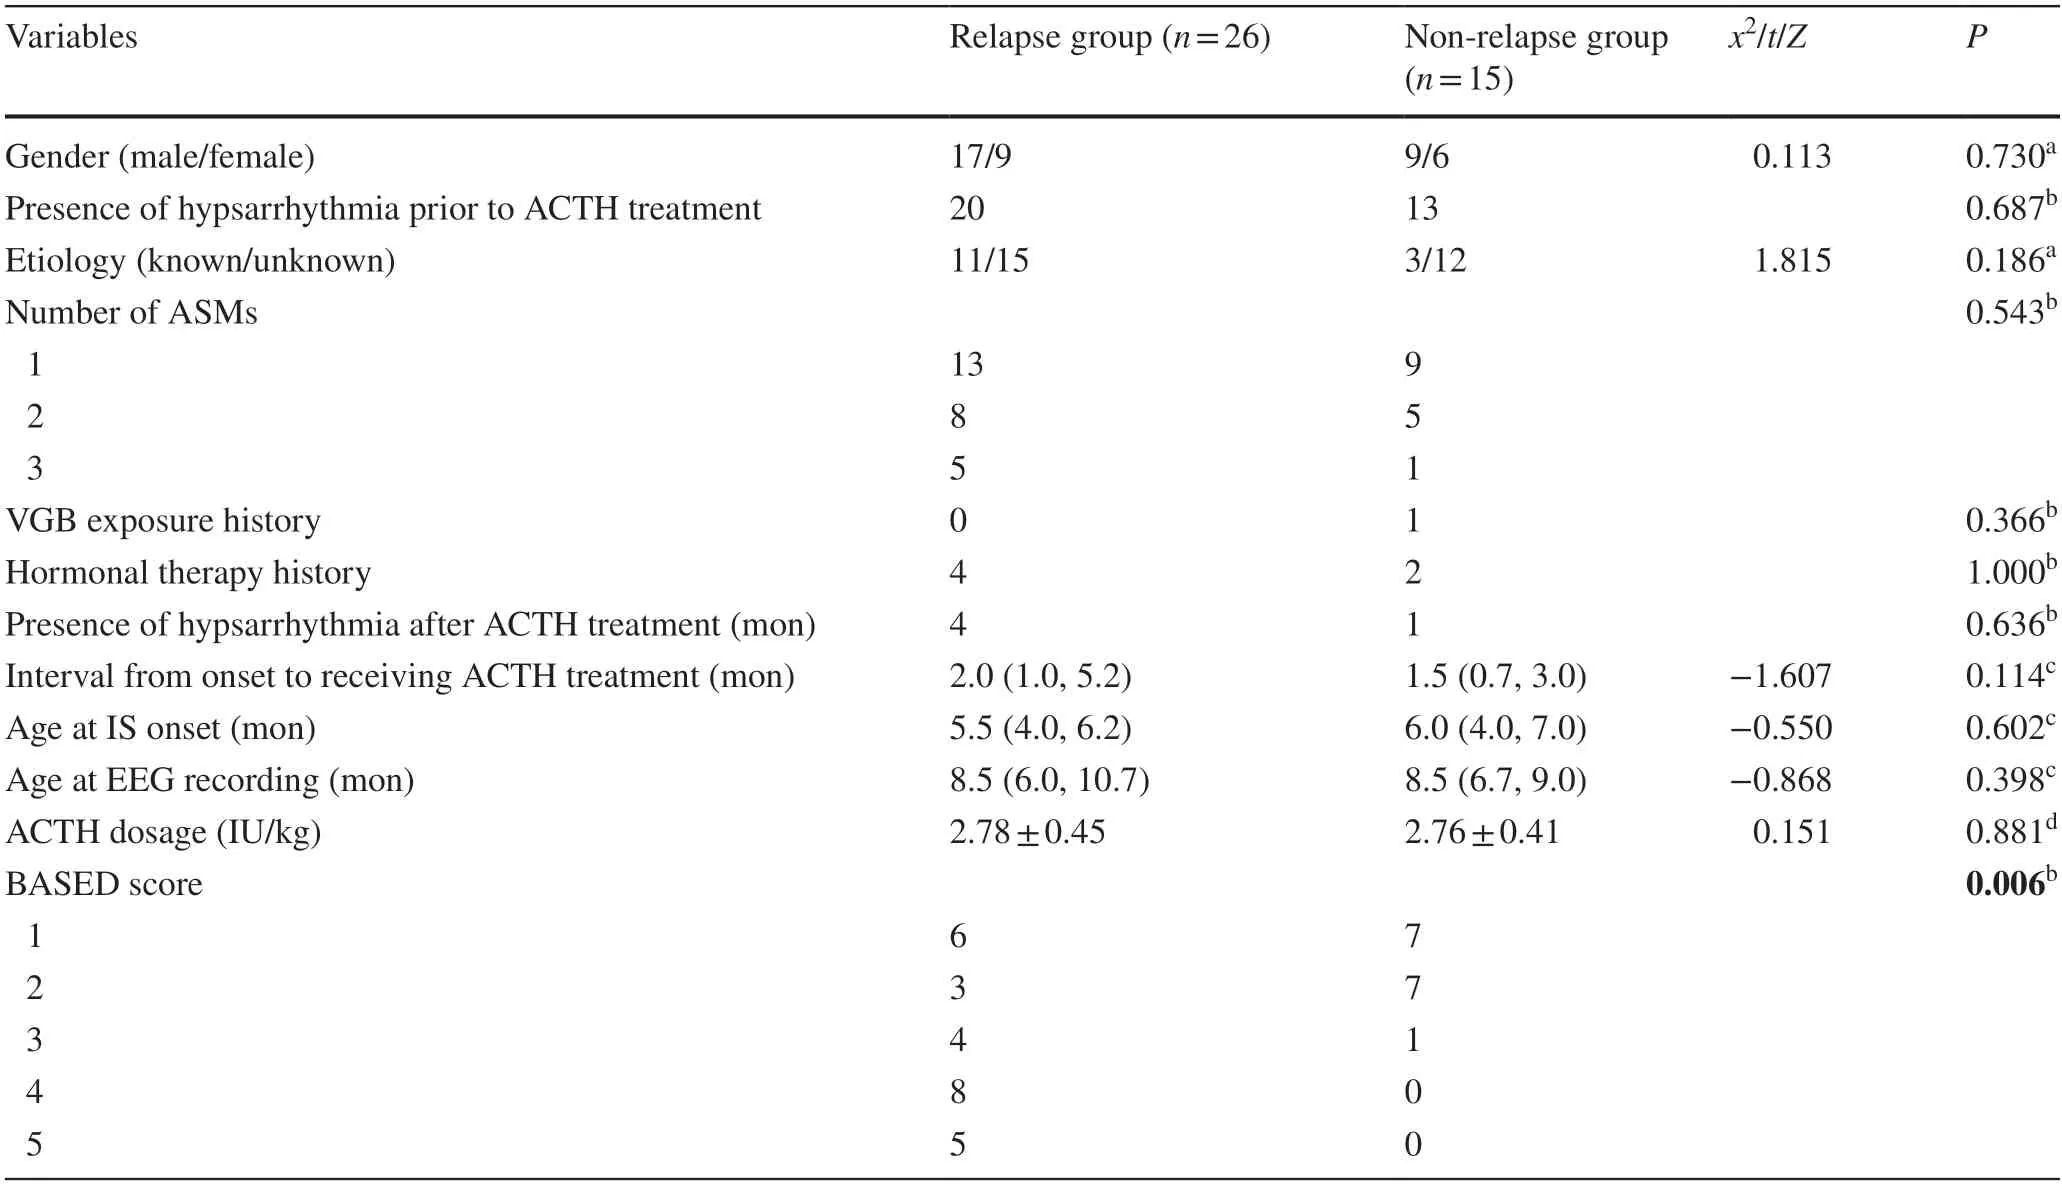
Table 1 Comparison of clinical data and BASED score between relapse and non-relapse groups
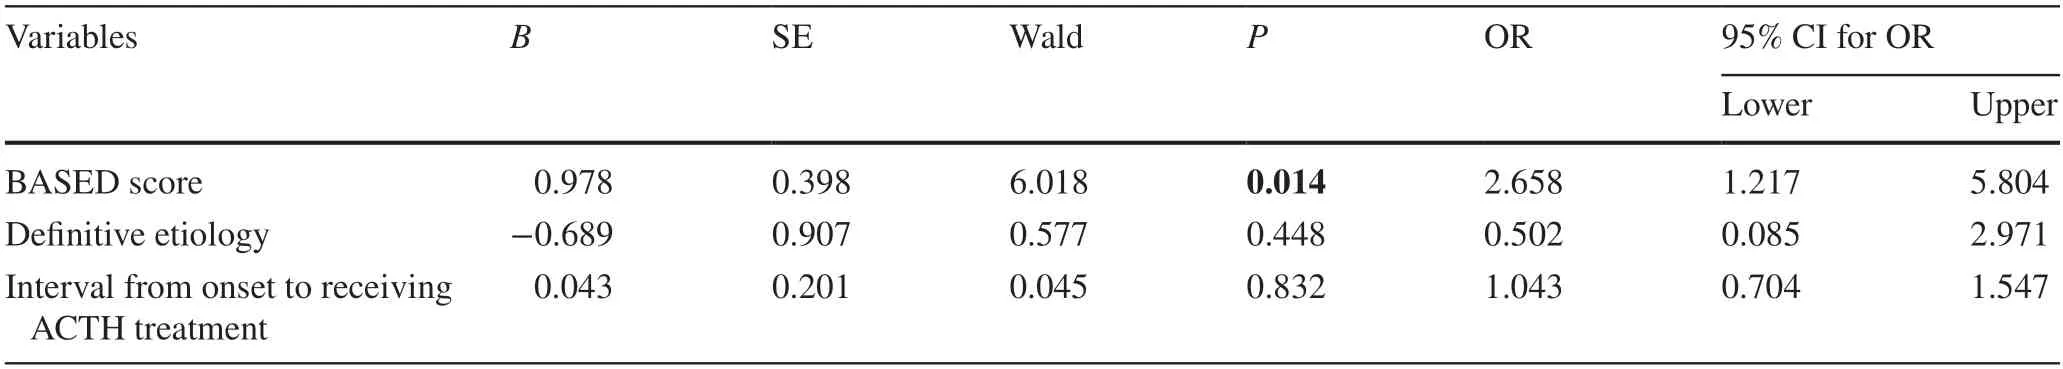
Table 2 Risk factor analysis of relapse
Correlations between complexities and the BASED scores for infantile spasms
The comparisons in complexities between the non-relapse and relapse groups indicate that CIs increase superior prognosis in the high-frequency range (γband) but decrease in the low-frequency range (δband).Next,we further explored whether there was an association between complexity and the BASED score for patients with IS following ACTHtreatment,with a hypothesis that the complexities would be positively correlated with the BASED score in the high-frequency band and negatively correlated to the BASED score in the low-frequency range.To this end,Spearman’s rank correlation between the complexities of the 5-minute EEG epochs applied the BASED scores were calculated,with data grouped by the electrode.Surprisingly,only the correlations in the occipital area were statistically significant,effective across a wide range of frequencies,γ,β,andδbands (Supplementary Table 1 and Supplementary Fig.1).There was a trend toward a significant positive correlation between CIs and the BASED scores in O2 for theγband (Supplementary Table 1;P=0.0688).In contrast,CIs in the occipital lobe were negatively correlated or tended to negatively correlate to the BASED scores in theδband (Supplementary Table 1;P=0.0413 andP=0.0738 correspond to O1 and O2,respectively).On the other side,as the accessed epochs were those clinically being regarded as the most epileptic 5-minute periods,it is also expected that positive correlations between CIs and the BASED scores for patients with IS were shown in theβband (Supplementary Table 1;P=0.0896 andP=0.0700 correspond to O1 and O2,respectively).

Table 3 Comparisons of complexity indexes with prognosis and electroencephalogram electrode channels
Classification of features
To discriminate non-relapse patients with IS from those of relapse,the complexities of 10-minute EEG epochs during sleep within theδ/γbands in the occipital brain region and the BASED scores were tested by employing a logistic regression model,wherein either every single feature itself or the combined features were applied.Performances of the logistic regression model are shown in Fig. 3 by ROC curves.The sensitivity was 28.57% for theδ/γCIs in the occipital region,whereas the specificity was 96.15%.The cutoffvalue for the BASED score in classifying prognosis was 2,along with its sensitivity and specificity corresponded to 92.86% and 65.38%,respectively.The sensitivity was 92.86% and the specificity was 73.08% for the combination of the two kinds of features.Figure 3 shows that the area under the ROC curves (AUCs) used in classifying non-relapse vs.relapse are 0.6786 (95% confidence interval=0.4872–0.8332),0.7761 (95% confidence interval=0.6273–0.8873),and 0.8352 (95% confidence interval=0.6726–0.9340),which correspond to theδ/γ-O CIs,the BASED score,and the combined use ofδ/γ-O plus BASED score,respectively.
However,none of the above AUCs exceeds 0.9.To further improve the prediction performance,we applied the classification tree model with the same features as that of the logistic regression model.Such a model follows a top-down approach,thus focusing on the local structure of the data.The sensitivity was 71.43% and the specificity was 96.15%for theδ/γCIs in the occipital region.The cutoffvalue for the BASED score remained the same,along with its sensitivity and specificity corresponded to 94.44% and 60.87%,respectively.The sensitivity was 85.71% for the combination of the two kinds of features,whereas the specificity was 92.31%.The AUC for BASED score increases slightly by 2% [0.7912 (95% confidence interval=0.6565–0.9000)],whereas AUCs which correspond to theδ/γ-O CIs and the combined use ofδ/γ-O with BASED score have been greatly improved,increasing to 0.9231 (95% confidence interval=0.8377–0.9918) and 0.9505 (95% confidence interval=0.8433–0.9921) (Fig. 3 b).In addition,we estimated predictor importance values for tree to assess the contribution of each feature (Supplementary Table 2).In this case the BASED score is the most important predictor,followed byγ-O CIs,and then byδ-O CIs.The addition ofδ/γ-O CIs to the BASED score alone greatly improved the classification performance,with the AUCs elevated from 0.7912 to 0.9505.The results show that the complementary use of the two sets of features may be optimal for predicting prognosis in IS patients.
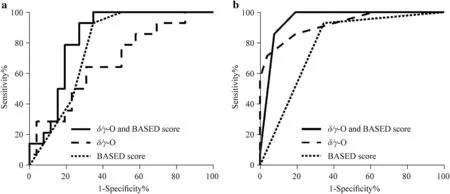
Fig.3 Receiver operating characteristic curve of candidate features in infantile spasms patients. a Logistic regression model; b classification tree model.Features shown are δ/ γ-O CI (dashed line),BASED score (dotted line),and δ/ γ-O CI plus BASED combined (solid line) in non-relapse vs.relapse groups. CI complexity index,BASED burden of amplitudes and epileptiform discharges
Discussion
The BASED score may reflect the severity of abnormal epileptiform discharges observed via EEG in IS patients,with a score of 4 or 5 representing epileptic encephalopathy [18].A BASED score < 2 after receiving therapy may be used to define electrographic remission regardless of pretreatment score [18],and this criterion has been applied in a recent study by Choi et al.[32].As the inventors of the BASED score previously mentioned,future work is needed to evaluate the relationship between the BASED score and the risk of ES relapse.To our knowledge,apart from the present study,no other such studies exist to date.In the present study we found that the BASED score was associated with the risk of relapse within one year following a short-term response with ACTH.Patients with a BASED score of 2 or lower were less likely to relapse compared to patients with a BASED score of 3 or higher.
Chu et al.found that in IS,both the abundance of epileptic discharges and the cognitive impairment caused by epileptic activities could alter the entropy of EEG signals that could possibly serve as a biomarker of disease status[12].Furthermore,they found the EEG complexity and MSE increased in those IS patients who had responded to ACTH after 6 months of follow-up,compared to the baseline and that of the ACTH non-responders [12].Thus,the association between MSE and the prognosis of IS after ACTH treatment appeared to be evident.In the present study we observed a similar outcome,with changes in MSE after ACTH treatment predicting ES relapse even in subjects who initially responded to ACTH treatment.However,in contrast to previous studies,when data were stratified by frequency distribution,differences between non-relapse and relapse groups exhibited trends in variation.Specifically,the MSE value in the non-relapse group was significantly lower than in the relapse group in the highest frequency interval (γ> 32 Hz).As the frequency decreased,group differences disappeared in theβband (13–32 Hz).With further decreases in frequency,group differences appeared again.In contrast to the results in theγband,the MSE values of lower frequency bands (δ: 1–4 Hz,θ: 4–8 Hz,α: 8–13 Hz,) were much higher in the non-relapse group than in the relapse group.
The assessment of EEG complexity represented by the MSE depends on the scale used.A higher scale implies a longer observation time window and lower frequency [33].Because the brain is the most complex physiological system,its complexity must be understood in various scales,especially the higher scales.For a complex system,there were tradeoffs between complexity and scale,when the complexity of higher frequencies increases,the complexity of low frequencies will decrease,and the converse also could be true [34].To enable the individual components of brain networks to exert their actions in concert,the complexities of the higher scales increase,leading to a corresponding decrease in the complexities of the lower scales [33].The complexities of the lower scales (γfrequency) in the nonrelapse group were decreased compared to the relapse group,reflecting reduced local neuronal fitness,but they increase the complexities in the higher scales (δ,θ,andαfrequencies),indicating an increased ability of their brain networks to adapt to uncertain changes [35].Increased neuronal network adaptability may make these IS patients more likely to achieve better outcomes;so the process of transversion of group differences in MSE across the bands was observed in the present study.
Further analysis suggested that the MSE value of the occipital region and the BASED score are related and indicated that the regularity of brain activities in the occipital lobe may play an important role in the pathophysiological regulation of IS,although this association did not achieve statistical significance.Previous studies suggest that hypsarrhythmia is likely generated subcortically,with predominant cortical expression in the parietal and occipital cortices[36–39].Similar results were found in patients with IS,who exhibit increased functional connectivity strength within the occipital head region [40].δ–γcross-frequency coupling in the electrocorticography signal is useful for localizing epileptic brain regions in pediatric patients with IS,as well as other in other types of focal epilepsy [41–44],and Miyakoshi et al.has previously successfully discriminated IS from control patients byδ–γphase-amplitude coupling [45].Based on the results in the present study and those of previous reports,the MSE of theδ/γfrequency of the occipital region and the BASED score were both used to predict ES relapse in IS patients.When both methods were combined,their predictive ability was improved.
Limitations of the current study include its sample size,retrospective design,and that it is a single-institution study.In addition,while BASED scoring investigators were blinded and experienced,scoring carries an inherently a level of subjectivity,which weakens the reliability of the results.Finally,despite the predictive power of our model,it should be noted that only patients without structural brain abnormalities were included in the study.Thus,our results may not be generalizable to all IS patients.Future studies will include IS patients with structural brain abnormalities.
In conclusion,EEG analyses of IS patients without structural brain abnormalities who achieved short-term response with ACTH treatment may be used to predict ES relapse.Specifically,our study suggests that combining the MSE of theδ/γphase from the occipital region with the BASED score may be a viable strategy for predicting ES relapse in IS patients without structural brain abnormalities.
Supplementary InformationThe online version contains supplementary material available at https:// doi.org/ 10.1007/ s12519-022-00583-9.
AcknowledgementsWe would like to thank the medical staffat the pediatric department of Chinese PLA Hospital for their assistance with this study.
Author contributionsWL,ZCT and ZG contributed equally to the manuscript.WL contributed to the conception and design of the study,and wrote the first draft of the manuscript.ZCT wrote the first draft of the manuscript.ZG performed the data analyses,and wrote the first draft of the manuscript.SXY,WJ and ZLP performed the acquisition of data.ZB,CJ and SWB performed the data analyses.YCH and YG contributed to the conception and design of the study.All the authors helped to revise the manuscript regarding important intellectual content.All the authors approved the final version for publication.
FundingThis research was partially supported by National Natural Science Foundation of China (Nos.62171028,62001026),the Natural Science Foundation of Beijing,China (No.7222187),the Medical Big Data and Artificial Intelligence Research and Development Project of the Chinese PLA General Hospital (No.2019MBD-004),the Epilepsy Research Fund of China Association Against Epilepsy (No.CU-B-2021-11),and the Nutrition and Care of Maternal &Child Research Fund Project of Guangzhou Biostime Institute of Nutrition &Care (No.2021BINCMCF030).
Data availabilityThe data sets generated during and/or analyzed during the current study are available from the corresponding author on reasonable request.
Declarations
Ethical approvalThis was a retrospective cohort study,patient identity remained anonymous,and the requirement for informed consent was approved to waive by the Ethics Committee of First Medical Center of PLA General Hospital due to the observational nature of the study(S2020-337-01).
Conflict of interestNo financial or non-financial benefits have been received or will be received from any party related directly or indirectly to the subject of this article.We confirm that we have read the journal’s position on issues involved in ethical publication and affirm that this report is consistent with those guidelines.The authors have no conflict of interest to declare.
 World Journal of Pediatrics2022年11期
- World Journal of Pediatrics的其它文章
- Instructions for Authors
- Incident respiratory disease among youths using combustible tobacco,electronic nicotine products,or both: a longitudinal analysis
- Third-line therapies in patients with Kawasaki disease refractory to first-and second-line intravenous immunoglobulin therapy
- A novel HNF4A mutation identified in a child with maturity onset diabetes of the young
- Neutropenia: diagnosis and management
- Effect of early atopic sensitization in children aged 0–2 years on the development of asthma symptoms at 9–11 years of age